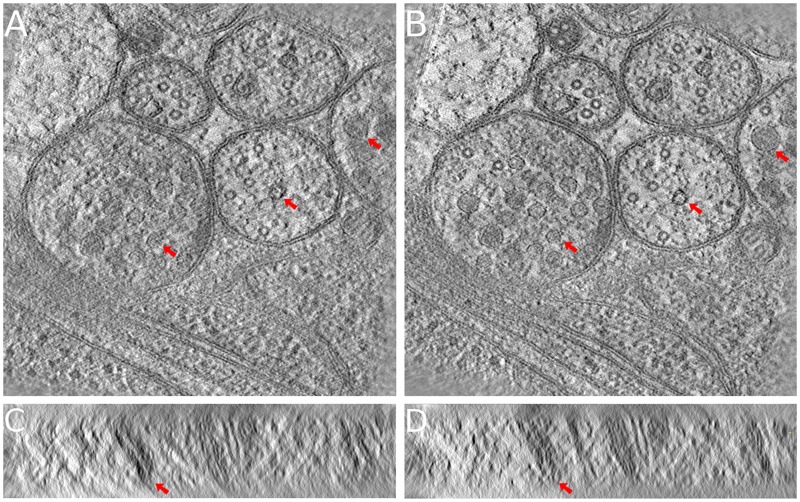
Fig. 9.
The reconstructed tomograms of the vesicle dataset. The presented tomograms are reconstructed by SART with 40 iterations and 0.2 relaxation factor. (A, C) The middle x–y slice and a typical y–z slice of the tomogram reconstructed from the result of IMOD’s marker-free alignment. (B, D) The middle x–y slice and a typical y–z slice of the tomogram reconstructed from the result of our joint method. On both the x–y slices and the y–z slices, the background noise is considerably lower and the details are much clearer in our joint method. Especially, the artifacts are notably reduced in the y–z slice

