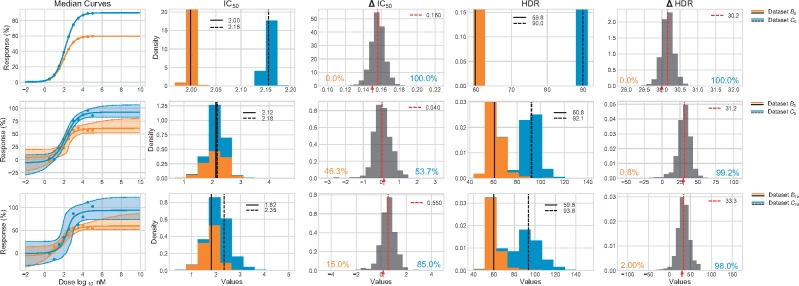
Fig. 7.
Comparison of synthetic datasets. Three pairs of synthetic datasets with R = 1 are compared: B0 to C0, B5 to C5 and B10 to C10. Each pair of datasets differs in their IC50 and HDR values. The 95% CI of each median curve is represented by the colored shaded regions. For both IC50 and HDR, the stacked individual posterior are represented by the colored histograms. Their median are marked by black segments. The numerical values are reported in the legend. The Δ IC50 and Δ HDR posterior are represented by gray histograms. The true difference is identified by a red arrow on the x-axis (0.15 for the IC50 and 30 for the HDR). The median values of the differences posterior are identified by the red hashed segments, and the numerical values are reported in the legend. The probability (in %) that a dataset has the largest value for a given parameter is identified on the graph in the color corresponding to the dataset

