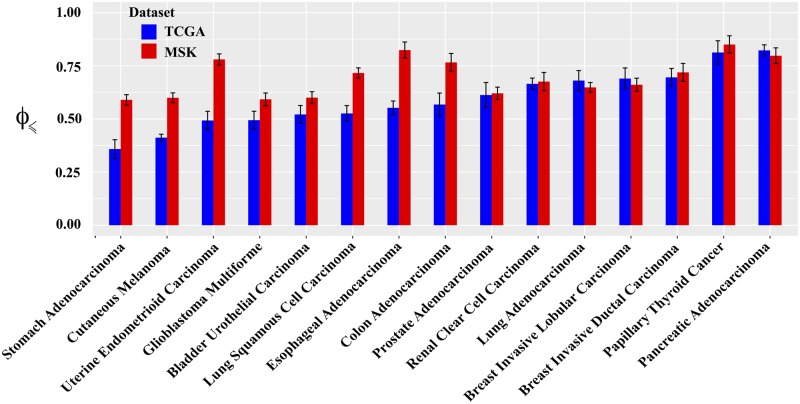
Fig. 4.
Comparison of evolutionary predictability among different cancer types. The vertical axis shows the CBN-based predictability , computed based on Equation (12) for each given cancer type. The error bars indicate the standard deviation of calculated from 100 bootstrap samples of equal size as the original genotype data. The genotypes for each cancer type are defined based on the mutational data of the corresponding n=10 most frequently mutated driver genes from TCGA (blue bars) or MSK-IMPACT (red bars). The cancer types are arranged from left to right in ascending order of their quantified based on TCGA data

