

Abstract
Motivation
As the most abundant mammalian mRNA methylation, N6-methyladenosine (m6A) exists in >25% of human mRNAs and is involved in regulating many different aspects of mRNA metabolism, stem cell differentiation and diseases like cancer. However, our current knowledge about dynamic changes of m6A levels and how the change of m6A levels for a specific gene can play a role in certain biological processes like stem cell differentiation and diseases like cancer is largely elusive.
Results
To address this, we propose in this paper FunDMDeep-m6A a novel pipeline for identifying context-specific (e.g. disease versus normal, differentiated cells versus stem cells or gene knockdown cells versus wild-type cells) m6A-mediated functional genes. FunDMDeep-m6A includes, at the first step, DMDeep-m6A a novel method based on a deep learning model and a statistical test for identifying differential m6A methylation (DmM) sites from MeRIP-Seq data at a single-base resolution. FunDMDeep-m6A then identifies and prioritizes functional DmM genes (FDmMGenes) by combing the DmM genes (DmMGenes) with differential expression analysis using a network-based method. This proposed network method includes a novel m6A-signaling bridge (MSB) score to quantify the functional significance of DmMGenes by assessing functional interaction of DmMGenes with their signaling pathways using a heat diffusion process in protein-protein interaction (PPI) networks. The test results on 4 context-specific MeRIP-Seq datasets showed that FunDMDeep-m6A can identify more context-specific and functionally significant FDmMGenes than m6A-Driver. The functional enrichment analysis of these genes revealed that m6A targets key genes of many important context-related biological processes including embryonic development, stem cell differentiation, transcription, translation, cell death, cell proliferation and cancer-related pathways. These results demonstrate the power of FunDMDeep-m6A for elucidating m6A regulatory functions and its roles in biological processes and diseases.
Availability and implementation
The R-package for DMDeep-m6A is freely available from https://github.com/NWPU-903PR/DMDeepm6A1.0.
Supplementary information
Supplementary data are available at Bioinformatics online.
1 Introduction
N 6-methyl-adenosine (m6A) methylation, as the most abundant methylation in mRNA, exists in >25% of mRNAs in mammalian cells (Dominissini et al., 2012; Meyer et al., 2012) and participates in controlling many aspects of RNA metabolism including mRNA degradation and translational efficiency (Ping et al., 2014; Slobodin et al., 2017; Wang et al., 2014, 2015; Zheng et al., 2013; Zhou et al., 2015). m6A is also reported to regulate stem cell differentiation (Batista et al., 2014; Bertero et al., 2018; Geula et al., 2015), viral life cycle (Lichinchi et al., 2016; Tan et al., 2018; Tirumuru et al., 2016), cancer and other diseases (Bansal et al., 2014; Kaklamani et al., 2011; Li et al., 2017; Lin et al., 2016; Loeb et al., 2001; Oka et al., 2002; Zhang et al., 2016a,b). Yet, our current knowledge about how m6A levels are regulated and whether and how the regulation of m6A levels of specific genes can play a role in these biological processes and other diseases is largely elusive.
The purpose of this study is to develop a pipeline to help reveal the dynamics of m6A level in specific context (e.g. disease versus normal, differentiated cells versus stem cells or gene knockdown cells versus wild-type cells) and identify functional genes and pathways mediated by the dynamic m6A levels using data from the methylated RNA immunoprecipitation sequencing (MeRIP-seq) (Dominissini et al., 2012; Meyer et al., 2012). The very first step of this pipeline is to discover the dynamic changes of m6A level, i.e. to identify differential m6A methylation (DmM) sites by comparing MeRIP-seq samples under the treated (e.g. disease, differentiated cells or gene knockdown cells) versus untreated (e.g. normal, stem cells or wild-type cells) conditions. The existing DmM-site-identification algorithms like exomePeak (Meng et al., 2013), MeTDiff (Cui et al., 2018) and QNB (Liu et al., 2017) all suffer from a limited detection resolution of ∼100 bp and the large biological and technical variation associated with the low resolution often result in a high false positive rate in the predicted peaks. To overcome this limitation, we previously developed Deep-m6A to efficiently and accurately identify single-base m6A sites from MeRIP-Seq data using a deep learning method (Zhang et al., 2019). However, Deep-m6A cannot identify single-based DmM sites and there is no existing algorithm and tool that can identify single base resolution DmM sites from MeRIP-Seq data. Moreover, the computational prediction of functional m6A genes is still inadequately addressed. In our previous work (Zhang et al., 2016a,b), we developed m6A-Driver, a network-based approach to identify m6A driven genes with significant functions under a specific context. However, m6A-Driver has several limitations. First, the DmM sites in m6A-Driver are determined based on exomePeak and have ∼100 bp resolution. Second, m6A-Driver only considers the functional interactions between DmM genes but ignores the functional interaction of DmM genes with known signaling pathways and their up- and down-stream genes in pathways. Third, only BioGRID (Chatr-Aryamontri et al., 2015) PPI network was used as a reference network in m6A-Driver, whose functional information could be incomplete and noisy.
To address these issues of m6A-Driver, we developed a novel FunDMDeep-m6A algorithm (Fig. 1) to detect DmM sites at a single-base resolution and identify and prioritize context-specific functional differential m6A methylation genes (FDmMGenes) by a network-based method that also integrates the differential methylation and expression levels under two different conditions. As the first step of FunDMDeep-m6A, we proposed DMDeep-m6A to identify single-base DmM sites. DMDeep-m6A first applies Deep-m6A to identify single-base resolution m6A sites under each condition separately and then employs a statistical test to select significant single-base DmM sites. Gene which harbors at least one DmM site is identified as DmMGene. Second, as one of the key regulatory functions of m6A is to degrade its methylated mRNAs, differential expression (DE) analysis is applied to assess the potential regulatory effect of differential m6A on the DmMGenes. Third, to quantify the functional significance of DmMGenes and motivated by cancer signaling bridge (CSB) (Jin et al., 2012; Zhao et al., 2013), we proposed a novel m6A-signaling bridge (MSB) score to model the functional interactions of DmMGenes with their connecting signaling pathways in protein-protein interaction (PPI) networks. Finally, a heat diffusion algorithm is applied to measure the influence of a DmMGene on the expression of its neighboring genes in PPI networks. To address the incomplete and noisy knowledge of a single PPI network, we used 4 PPI networks including BioGRID (release 3.4.128) (Chatr-Aryamontri et al., 2015), HINT+HI2012 (Das and Yu, 2012; Yu et al., 2011), MultiNet (Khurana et al., 2013) and iRefIndex (Razick et al., 2008) as reference network. The functional DmMGenes are selected and prioritized based on the final MSB scores. FunDMDeep-m6A was tested in 4 context-specific MeRIP-Seq datasets and the results demonstrated the power of FunDMDeep-m6A to prioritize the context-specific genes mediated by m6A and to reveal the underlying functions of m6A.
Fig. 1.
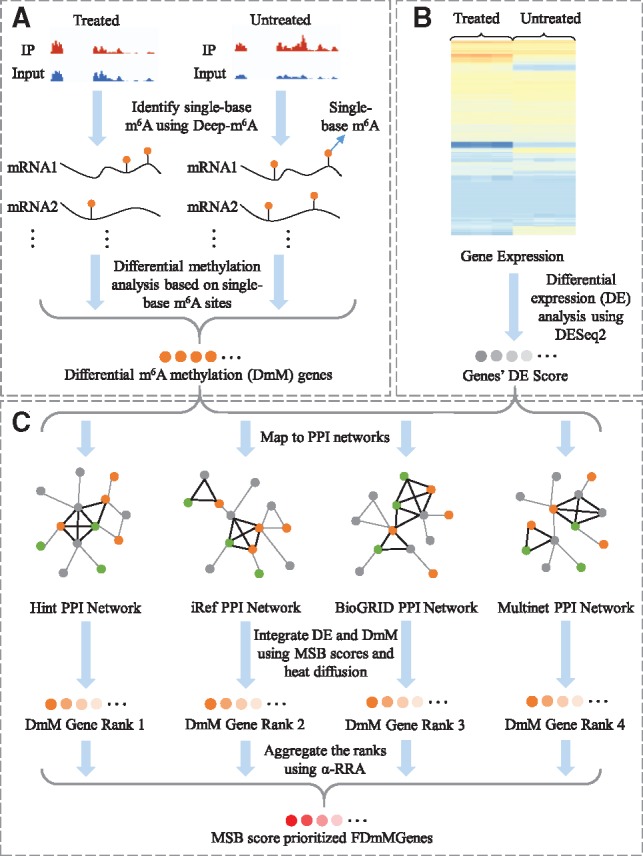
Flowchart of FunDMDeep-m6A. (A) Single-base differential m6A methylation (DmM) site identification (DMDeep-m6A). (B) Differential expression analysis. A deeper grey color means the gene has a greater degree of DE. (C) Functional DmMGene identification and prioritization by integrating the DE and DmM using a network-based method. DmMGenes are mapped to 4 PPI networks. For each PPI network, MSB score for each DmMGene is calculated by integrating the weighted DE scores of its MSB neighbors and itself. An MSB is a fully connected triangle or square motif in the network, which is denoted using bold black edges. Orange nodes denote DmM genes, green nodes denote signaling genes, and grey nodes denote genes that are neither DmM and nor signaling genes. The ranks of DmMGenes in the 4 networks are integrated using the α-RRA method. The deeper the color of DmMGenes or FDmMGenes, the bigger the MSB scores and hence the more significant functions
2 Materials and methods
2.1 Dataset
Four MeRIP-Seq datasets under different conditions and in different cells are used in this work. MeRIP-Seq includes two sets of samples, the input and the IP samples. The input samples are essentially RNA-seq and measure the number of sequence reads of the background mRNA copy numbers or gene expression. The IP samples measure the number of reads pulled-down by the anti-m6A antibody. The relative degree of m6A methylation can be assessed as the enrichment of IP reads over input reads. The input samples can be used to measure the gene expression level. The hESCs dataset contains two MeRIP-Seq IP/Input replicates in undifferentiated human embryonic stem cells and two in endodermal differentiation cells (Batista et al., 2014). The MOLM13 dataset contains two MeRIP-Seq IP/Input replicates in wild-type MOLM13 cell lines and four in METTL13 knockdown MOLM13 cells (Barbieri et al., 2017). The Hela dataset contains two MeRIP-Seq IP/Input replicates in wild-type Hela cell line and two in METTL13 knockdown Hela cell lines (Niu et al., 2013). The A549 dataset contains four MeRIP-Seq IP/Input replicates in wild-type A549 cell lines and three in METTL13 knockdown A549 cell lines (Schwartz et al., 2014).
The reference PPI networks were built based on BioGRID (release 3.4.128) (Chatr-Aryamontri et al., 2015), HINT+HI2012 (Das and Yu, 2012; Yu et al., 2011), MultiNet (Khurana et al., 2013) and iRefIndex (Razick et al., 2008). After removing the isolated proteins and self-interaction proteins, we established a PPI network with a total of 16 062 proteins and 152 676 interactions in BioGRID network. The last three PPI networks were downloaded from http://compbio.cs.brown.edu/pancancer/hotnet2/ (Leiserson et al., 2015). The HINT+HI2012 network contains 9858 genes and 40 704 edges; the iRefIndex network contains 12 128 genes and 91 808 edges; and the Multinet network contains 14 398 genes and 109 569 edges. Genes that involved in REACTOME, MSigDB C2 BIOCARTA (v6.0) or Kyoto Encyclopedia of Genes and Genomes (KEGG) pathways annotated using ToppGene (Chen et al., 2009) were denoted as the signaling genes.
2.2 Single-base differential methylation site identification
DMDeep-m6A was proposed as the first step of FunDMDeep-m6A to identify the single-base resolution m6A sites using Deep-m6A (Zhang et al., 2019) and a statistical test. For samples in each condition, exomePeak was applied to detect the peak regions from all replicates and DRACH (where D = A, G or U; R = A or G; H = A, C or U) motifs were searched in the peak regions. DRACH is the consensus motif of m6A (Dominissini et al., 2012; Linder et al., 2015; Meyer et al., 2012) and it is used in this study to reduce the false positive predictions. The ‘A’ in a motif was treated as a candidate single-base m6A site. Then for each replicate under this condition, Deep-m6A was employed to predict the probability of these candidate sites to be real m6A sites. The Deep-m6A model, trained in our previous work, takes the mRNA nucleotide sequence and reads count feature of 101 nt centered at the ‘A’ of a DRACH motif as input and outputs the probability of this ‘A’ to be a real m6A site. The reads count feature is normalized by the total number of reads for each candidate m6A site in each replicate. Candidate sites with probability more than 0.8 was identified in this work as the single-base m6A sites in the corresponding replicate. We used 0.8 to trade off low detection sensitivity and high false positive. Single-base m6A sites that appear in every replicate under one condition and but not in any replicate under the other condition were defined as condition-specific m6A sites; m6A sites that exist in both conditions are defined as candidate DmM sites.
To detect the DmM status of candidate DmM sites, we compared the methylation level of these sites under different conditions using rhtest as is used in exomePeak (Meng et al., 2013). For each candidate DmM site, reads that mapped to the 201 nt region centered at it in IP and Input samples under both conditions were counted. We extended the single-base candidate DmM m6A sites to account for the high reads variance at the single-base DmM sites across replicates. We examined the peak length detected by exomePeak in all 4 datasets and found that most peaks were around 200 nt long (Supplementary Fig. S1). As a result, we chose 201 nts to better capture the site-related reads information around a single-base m6A site. Next, an rhtest was applied to the reads count mapped to the 201 nt region centered at the candidate DmM site to detect their DmM status (see Supplementary Note 1 for the details of the test). The final collection of the DmM sites included candidate DmM sites with FDR ≤ 0.01 calculated using rhtest and the condition-specific m6A sites. Genes that contain at least one DmM sites were identified as DmMGenes.
We also developed a DMDeep-m6A R-package. The package takes the bam files of MeRIP-Seq data as input and can perform single-base m6A sites and differential m6A sites identification for human and other species. The output includes the bed files with annotated genome positions of identified sites and the excel files with the annotated the transcript positions of the sites, its corresponding transcription region 5’UTR, CDS or 3’UTR), methylation or differential methylation degree (log2 fold change), the prediction probability, the P-value and FDR. DMDeep-m6A is freely available from https://github.com/NWPU-903PR/DMDeepm6A1.0.
2.3 Gene differential expression analysis
DESeq2 (Love et al., 2014) was applied to detect differential expression (DE) genes. Reads mapped on genes in the input samples of the MeRIP-Seq data under different conditions were counted using summarizeOverlaps in the GenomicAlignments R package (Lawrence et al., 2013) and were then used to calculate the differential expression P-value by compared samples under the treated condition with the samples under the wild-type condition. The –log10 P-value of a gene was defined as its DE score to denote its DE degree to be used in the following analysis.
2.4 Functional DmM gene identification and prioritization
m6A is reported to mediate mRNA turn-over or translational efficiency of genes such as MYC (Huang et al., 2018), TGFb (Panneerdoss et al., 2018) and FOXM1 (Zhang et al., 2017) to regulate the expression of important pathways such as cell apoptosis, proliferation, migration, self-renewal and circadian rhythm in both normal and disease conditions (Fitzsimmons and Batista, 2019). Therefore, a functional DmMGene (FDmMGene) in this study is defined as a context-specific DmMGene that interacts with known pathway genes and may influence the expression of their up- and down-stream genes. To model the functional interaction of DmMGens with known pathway genes and their up- and down-stream genes, we proposed the m6A-signaling bridge (MSB) scores. MSBs are functional motifs in a PPI network, e.g. fully connected triangles and squares, which contain at least one DmMGene, one signaling gene involved in certain signaling pathways, and one gene that is neither DmM nor a signaling gene so that up- and down-stream interactions between the DmMGenes and signaling genes in pathways can be account for (see Supplementary Note 2 for more details). To calculate MSB scores, all DmMGenes are mapped to four PPI networks and for each DmMGene in each network, an MSB score is then calculated by summing the DE scores of itself and its MSB neighbors weighted by a heat diffusion probability from this DmMGene. Notice that the MSB analysis was performed in the four PPI networks separately instead of in a combined PPI network. The reason is that different PPI networks have different network characteristics, which would be destroyed if they are combined (Leiserson et al., 2015). For each PPI network with N nodes, the heat diffusion probability from a DmMGene to its neighbors is calculated using an insulated heat process that can be described in terms of a random walk with restart (RWR) (Leiserson et al., 2015). The RWR algorithm is formulated as:
| (1) |
where i denotes the ith DmMGene which served as seed node in the random walk, is an N × 1 vector whose jth element represents the heat of the start diffused to gene j at step t, is the initial probability vector in which the DmMGene i has a probability of 1 and the probability of other genes are 0, the transition matrix W is the column-normalized adjacency matrix of the PPI network, and β is a fixed parameter, which denotes the restarting probability at a given time step. Then, is updated according to (1) iteratively until the difference between and is below a predefined threshold (10−6 in this work). For DmMGene i, the heat diffusion probability from it to its neighbors is calculated as:
| (2) |
where T is the total number of random walks. Representing the heat diffusion probability of DmMGene in this way can capture high-order proximities of network nodes (Gligorijevic et al., 2018).
Finally, the MSB score of DmMGene i is calculated as:
| (3) |
| (4) |
where N is the number of genes in the network, hij is the heat diffusion probability from DmMGene i to gene j, Dj is the DE score of gene j and MSBi denotes the MSBs containing DmMGene i. hi can represent the impact of a DmMGene on its neighbors’ expression via the PPI network and the MSB can model the functional interactions of DmMGenes with genes in the signaling pathways. As a result, the MSB score can represent the functional significance of a DmMGene; the bigger the MSB score, the more functional significant the DmMGene is.
After calculating the MSB score of DmMGenes in each of the 4 PPI networks, a size factor sn is calculated for each network n using the ‘geometric’ approach (Anders and Huber, 2010; Robinson and Oshlack, 2010) to normalize the scores across the networks. Afterward, the DmMGenes mapped to each PPI network are ranked based on their normalized MSB scores and the ranks of a DmMGene in the four networks were integrated using α-RRA (Li et al., 2014). Let R = (r1, r2, r3, r4) denote the vector of the ranks of a DmMGene in the 4 networks. We first converted the ranks into the percentiles U = (u1, u2, u3, u4), where un = rn/Nn (n = 1, 2, 3, 4), Nn is the total number of genes in network n. Under the null hypothesis that the percentiles follow the uniform distribution between 0 and 1, the kth smallest value among u1, u2, u3, u4 is an order-statistic, which follows the beta distribution B(k, n + 1− k), based on which the P-value ρk for the kth smallest value can be calculated. The ρ value, which is the significance score of the gene, is then defined as ρ = min (ρ1, ρ2, ρ3, ρ4). However, this approach could also pick DmMGenes ranked in the middle of all networks. To address this issue, we used α-RRA (Li et al., 2014) to calculated the ρ value. Specifically, we first selected the top α% ranked DmMGenes in each network if their MSB scores are bigger than a threshold (-log10(0.05) in this work). If a DmMGene is selected from the kth networks, then the modified ρ value is defined as ρ = min (ρ1, …, ρk), where k ≤ 4.
To compute a P-value based on the ρ values, we performed a permutation test, where the normalized MSB scores in all networks were pooled together and then randomly assigned to DmMGenes in each network. By default, 100 × ng permutations were performed, where ng is the number of DmMGenes. The FDR from the empirical permutation P-values were computed using the Benjamini-Hochberg procedure (Benjamini and Hochberg, 1995). The mean of the normalized MSB scores in all networks of a DmMGene was used to prioritize the functional DmMGenes.
3 Results
3.1 Characteristics of single base DmM sites and FDmMGenes
We first investigated the characteristics of single-base DmM sites in the 4 datasets. For the hESCs dataset, all DmM sites were considered for the analysis, whereas for the MOLM13, Hela and A549 dataset, only condition-specific sites in the wild-type cells and the hypo-DmM sites in the METTL3 KD cells were selected as the METTL3-dependent m6A sites and genes that harbor them were selected as DmMGenes; this is because METTL3 is an m6A methyltransferase and knocking down METTL3 likely induces a decrease in m6A. The DmM site distributions on mRNA in four datasets were plotted using the Guitar R/Bioconductor package (Fig. 2A). Overall, DmM sites are mostly enriched around the stop codon and are distributed more in the 3'UTR and CDS than in the 5’UTR for all datasets and the DmM sites for MOLM13 dataset are even more enriched in the 3'UTR; this result is consistent with the report in (Barbieri et al., 2017) that 65.4% METTL3-dependent m6A peaks were enriched in the 3'UTR and only 1.0% were enriched in the 5’UTR.
Fig. 2.
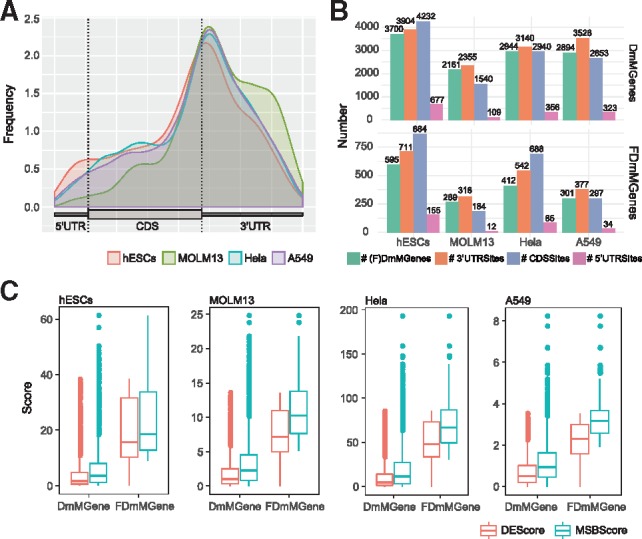
Characteristics of DmM sites and FDmMGenes. (A) DmM site distribution on mRNA. (B) The number of DmMGenes, FDmMGenes and their harbored DmM sites in the 3’UTR, CDS and 5’UTR. For the MOLM13, Hela and A549 dataset, only METTL3-dependent genes and m6A sites are calculated. (C) Comparison of MSB scores with DE scores of DmMGenes and FDmMGenes. The MSB score of a gene is the mean of normalized MSB scores of 4 PPI networks
There are in total 3700, 2161, 2944 and 2894 DmMGenes identified in the hESCs, MOLM13, Hela and A549 datasets, respectively (Fig. 2B). Each DmMGene harbors on average about one DmM site in the 3’UTR region and one DmM site in the CDS region for all datasets. We next examined the hyper and hypo methylation status of these sites. For the A549, Hela and MOLM13 datasets, all the identified DmM sites are hypo methylated; this is consistent with the fact that m6A levels should decrease because of METTL3 knock-down. For the hESCs dataset, ∼59% (2181/3700) DmMGenes harbor only hypo DmM sites in undifferentiated hESCs versus differentiated endoderm cells, ∼26% (966/3700) DmMGenes harbor only hyper DmM sites, and ∼15% (553/3700) DmMGenes harbor multiple DmM sites that are either hypo or hyper methylated. For most (∼85%) of the DmMGenes, their DmM sites share the same status of differential methylation. Out of the DmMGenes, 595, 269, 412 and 301 were identified as FDmMGenes in hESCs, MOLM13, Hela and A549 datasets, respectively (Fig. 2B) and on average, one FDmMGene contains about 1.2 DmM sits in the 3’UTR, which is more than DmMGenes, about 1.5, 0.7, 1.7 and 1 DmM sites in CDS, and 0.3, 0.04, 0.2 and 0.1 DmM sites in the 5’UTR in hESCs, MOLM13, Hela and A549 datasets, respectively. Because the 3’UTR contains binding sites of miRNA and many RNA binding proteins such as HuR that are known to regulate gene expression post-transcriptionally, these result may indicate that these DmM sites could potentially be involved in regulating gene expression.
The FDmMGenes are functional DmMGenes that have consistent relatively high MSB scores in four networks. The MSB score is a measure of the functional significance of a DmMGene, a bigger MSB score implies higher functional significance. The MSB score for a DmMGene in a network is calculated by the sum of the weighted DE scores of its MSB neighbors and itself and the DE score is the negative log10 P-value calculated by DESeq2 (see Section 2 for details). Therefore, the more functionally significant a DmMGene is, the bigger increase the MSB score has over the DE score. We then compared the DE scores and MSB scores between FDmMGenes and DmMGenes (Fig. 2C) and verified that the MSB scores of FDmMGenes have bigger increase over DE scores than those of DmMGenes do. Most of the DE and MSB scores in DmMGenes are near 0 (Supplementary Fig. S2). However, the MSB scores of FDmMGenes become significantly greater than 0 (t-test P-value < 2.2 × 10⁻¹⁶ in all datasets). Notice that some DE scores of FDmMGenes are still near 0; they would be predicted functionally insignificant in a differential expression analysis because they are not differentially expressed. We further investigated whether the top-ranked FDmMGenes are prioritized because they have higher DE scores. To evaluate this, we extracted the top 100 DmMGenes ranked based on their DE scores and the top 100 DmMGenes ranked based on their MSB scores (top FDmMGenes) and then compared the difference of DE scores between these two groups of genes in hESCs and MOLM13 datasets. As is shown in Supplementary Figure S3, the DE score of the top FDmMGenes are not always large, especially for the MOLM13 dataset, where about half (45/100) of the top-ranked FDmMGenes have relatively smaller DE scores than the top-ranked DmMGenes based on DE scores. These results demonstrate the power of FunDMDeep-m6A in identifying functional DmMGenes even with insignificant DE scores. This advantage will be further illustrated by the functional analysis of the FDmMGenes in following sections.
3.2 FunDMDeep-m6A identified more functional enriched and significant FDmMGenes
We then compared the results of FunDMDeep-m6A with m6A-Driver as they are both proposed to identify context specific functional DmMGenes. We first compared the number of genes identified by these two methods (Fig. 3A). The number of m6A-Driven genes (mDrGenes) identified by m6A-Driver are much larger than that of FDmMGenes identified by FunDMDeep-m6A in all 4 datasets.
Fig. 3.
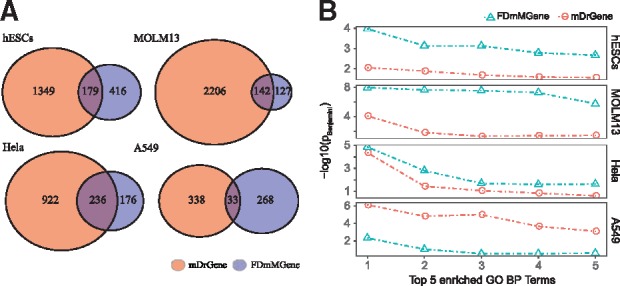
Comparison of FDmMGenes with mDrGenes. (A) The number of m6A-Driven genes (mDrGenes) and FDmMGenes. (B) Enrichment of top 5 functional enriched GO biological processes for top 100 FDmMGenes and mDrGenes. The FDmMGenes are ranked based on their MSB scores and the mDrGenes are ranked based on their DE degree. The enrichment analysis was done using DAVID
We then compared the degree of functional enrichment for FDmMGenes and mDrGenes. As the number of them is very different, to make the comparison fair, we selected top 100 ranked FDmMGenes based on their MSB score and top 100 ranked mDrGenes based on DE FDR calculated by DESeq2. We employed DAVID to assess the enrichment of GO Biological Processes (BP) for these 2 group of genes and compared the degree of enrichment of top 5 enriched BP terms (Fig. 3B). The functionally enriched degrees of top 100 FDmMGenes in hESCs, MOLM13 and Hela datasets are consistently larger than those of mDrGenes. In the A549 dataset, although the top enriched degrees are smaller than those of mDrGenes but the enriched biological processes are more significant in cancer-associated processes including 11 FDmMGenes enriched in apoptosis, 3 FDmMGenes enriched in SMAD protein import into the nucleus and 9 FDmMGenes enriched in negative regulation of cell proliferation. Enrichment of cancer-related functions is more biologically meaningful as oncogenic roles of METTL3 have been reported for lung and breast cancer (Lin et al., 2016; Panneerdoss et al., 2018). In contrast, the top BPs enriched in top mDrGenes are all related to transcription, which are general functions not specific in cancer (Supplementary Fig. S4). Taken together, these results show that FDmMGenes should have higher prediction specificity and precision in terms of functional significance than mDrGenes.
3.3 FunDMDeep-m6A prioritized more context-specific and functional significant FDmMGenes
To further demonstrate the advantages of FunDMDeep-m6A in prioritizing the context specific functional DmMGenes, we compared the enriched functions of FDmMGenes and mDrGenes in hESCs dataset, which is the only dataset with a clear context, i.e. stem cell differentiation from hESCs to endoderm cells. We performed GO BP enrichment analysis and KEGG pathway enrichment analysis for these genes using ToppGene (Chen et al., 2009) and DAVID (Dennis et al., 2003). The functional enrichment analysis illustrated that FDmMGenes are more context-specific than mDrGenes (Supplementary Figs S5–S6). Among the top 20 enriched biological processes enriched in FDmMGenes using ToppGene, 19 are directly related to cell differentiation, embryo development and morphogenesis (Supplementary Fig. S5), including embryonic morphogenesis, embryo development, regulation of cell differentiation and cell morphogenesis involved in differentiation. There are also 25 FDmMGenes significantly enriched in endoderm development (pBenjamini = 3.4 × 10⁻¹⁴) BP and 40 FDmMGenes significantly enriched in stem cell differentiation (pBenjamini = 6.2 × 10⁻¹²). Although there are also 19 mDrGenes enriched in endoderm development (pBenjamini = 8.8 × 10⁻⁴) and 48 mDrGenes enriched in stem cell differentiation (pBenjamini = 7.8 × 10⁻⁵), the enrichment degrees are much lower than that of FDmMGenes and therefore m6A-Driver failed to prioritize these pathways.
Among the top 20 enriched KEGG pathways (Supplementary Fig. S6) in FDmMGenes using DAVID are signaling pathways regulating pluripotency of stem cells and pathways regulating cell differentiation including the TGF-beta signaling pathway, the MAPK signaling pathway and the Wnt signaling pathway. In contrast, the top enriched functions of mDrGenes are more general cell processes such as cell cycle, regulation of gene expression, regulation of transcription.
Next, we investigated the power of FunDMDeep-m6A in prioritizing functionally significant DmMGenes. m6A has been reported to play essential roles in stem cell differentiation (Batista et al., 2014; Bertero et al., 2018; Geula et al., 2015) and leukemia (Bansal et al., 2014; Barbieri et al., 2017; Ianniello and Fatica, 2018; Li et al., 2017; Vu et al., 2017; Weng et al., 2018). Therefore, we first examined whether FunDMDeep-m6A can identify known functional genes regulated by m6A in the hESCs and MOLM13 datasets. The known functional genes are DmMGenes and involved in maintenance of the stem cell state and key regulators of endodermal differentiation that are shown to be mediated by m6A in hESCs (Batista et al., 2014) (red genes in Fig. 4A), and m6A regulated genes relevant to AML proliferation reported in (Ianniello and Fatica, 2018) (red genes in Fig. 4B) in MOLM13 dataset.
Fig. 4.
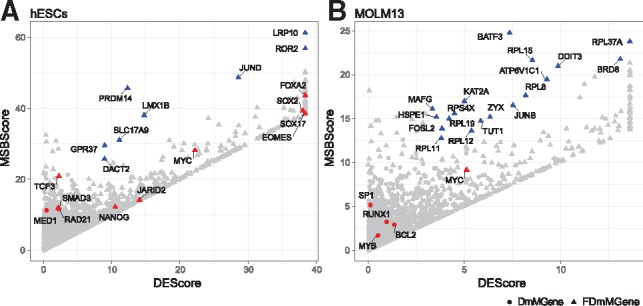
DmMgenes’ MSB score along with DE score. Each dot in the plot denotes a DmMGene and the shape of the dot denotes if the gene is either DmM (circle) or FDmM (triangle). The color is used to emphasize the functional DmMGenes. The red dots are known context-specific functional genes from (Batista et al., 2014) and (Ianniello and Fatica, 2018), which are genes involved in the maintenance of stem cell state and key regulators of endodermal differentiation for (A) hESCs dataset and m6A regulated genes relevant for AML proliferation for (B) MOLM13 dataset. The blue dots are prioritized FDmMGenes with relatively high MSB scores compared to its DE scores
Most known DmM genes in the hESCs dataset were identified as FDmMGenes (Fig. 4A; red dots; 7 out 9 DmM genes). Among these FDmMGenes, NANOG and SOX2 are in the very upstream of the pathway for maintenance of stem cell state (Young, 2011) and EOMES, FOXA2 and SOX17 are key regulators of endodermal differentiation. In particular, stem cell maintenance gene TCF3 and SMAD3 are also identified as FDmMGenes, which may be missed by traditional DE-based methods due to their low DE score. This again demonstrates the power of FunDMDeep-m6A in identifying functionally significant DmMGenes with low DE scores. However, among the known functional DmMGenes in the MOLM13 dataset, only MYC was identified as FDmMGene. This is reasonable because SP1, RUNX1 and MYB are reported to be regulated by m6A via promoting translation of their mRNAs (Barbieri et al., 2017; Vu et al., 2017; Weng et al., 2018); they may be prioritized if there were protein level scores available to calculate an MSB score. What is interesting is that among the prioritized FDmMGenes in MOLM13 dataset, RPL11, RPL12, RPL15, RPL19, RPL37A, RPL8 and RPS4X are involved in translational initiation and translation, which may help regulate the translation of m6A target mRNAs and this may provide another clue of m6A regulation mechanism in leukemia.
The key aim of this study is to prioritize functional differential m6A methylation genes (FDmMGenes), which may be candidates of critical genes regulated by m6A under specific condition. To show that top-ranked FDmMGenes are context-specific and functionally significant, we performed the functional analysis on the FDmMGenes whose MSB scores are significantly higher than their DE scores identified in the hESCs and MOLM13 datasets (Fig. 4). The prioritized FDmMGenes along with their MSB scores and differential expression scores for these 2 datasets are included in Supplementary File 2. We focused on the FDmMGenes whose MSB scores are larger than their DE scores, whose MSB scores larger than 90% quantile of all MSB scores, and whose DE score larger than 80% quantile of all DE scores and we defined them as prioritized FDmMGenes. Besides the known functional DmMGenes, the prioritized FDmMGenes in the hESCs and MOLM13 datasets are also functional significant and context-specific. In the hESCs dataset, PRDM14 plays an important role in embryonic stem cell population maintenance (Chan et al., 2013; Chia et al., 2010; Tsuneyoshi et al., 2008); JUND is involved in cell differentiation, cell proliferation and cell death; DACT2 plays a role in cell differentiation and cancer for it is involved in biological process like epithelial cell morphogenesis, hematopoietic progenitor cell differentiation and regulation of Wnt signaling pathway annotated by GO; LMX1B is also involved in cell differentiation and embryonic development GO BP terms like multicellular organism development, neuron differentiation and in utero embryonic development; ROR2 is involved in embryonic genitalia morphogenesis, embryonic digit morphogenesis and negative regulation of cell proliferation GO BP terms; GPR37 plays a negative role in cell death and positive cell proliferation (Huang et al., 2014; Liu et al., 2014); SLC17A9 regulates cell viability (Cao et al., 2014); LRP10 is reported as a negative regulator of the canonical Wnt/beta-catenin signaling pathway, which plays fundamental roles in the differentiation, proliferation and growth in cells and animals (Jeong et al., 2010). In MOLM13, DDIT3 is a significant gene in Wnt pathway and an oncogene in liposarcoma annotated by COSMIC (Forbes et al., 2011); BRD8 is reported to be associated with tumor progression toward advanced stages (Yamada and Rao, 2009); BATF3 is involved in myeloid dendritic cell differentiation GO BP term; KAT2A is a repressor of NF-kappa-B, which is a critical regulator of inflammatory and cell survival signals, by promoting ubiquitination of the NF-kappa-B subunit RELA in a HAT-independent manner (Mao et al., 2009); MAFG is involved in blood coagulation and regulation of cell proliferation GO BPs. All these prioritized functional genes may be marker genes regulated by m6A and provide new hypotheses of m6A regulatory mechanisms in influencing stem cell differentiation and leukemia development.
3.4 METTL3 regulates some common and context-specific genes and functions in different cell types
We next investigated the functional roles that METTL3-dependent m6A sites play in different cell types. We analyzed 3 METTL3 KD datasets and identified 269, 412 and 301 METTL3-dependent FDmMGenes in MOLM13, Hela and A549 cell lines, respectively. We counted the overlaps of the 3 sets of FDmMGenes (Supplementary Fig. S7). There is only 1 common FDmMGene (CBX4 gene) and more than 80% of the METTL3-dependent FDmMGenes are cell line specific, which indicates that METTL3 may influence different functions in different cell type. We then performed the functional enrichment analysis using ToppGene and DAVID for the 3 sets of FDmMGenes (Supplementary Figs S8–S10). Again, there is no common function among the three cell lines. However, there are common functions between Hela and A549 cell lines, which include cell cycle, gene expression, transcription and chromosome organization.
We next examined the cell-line specific functions, for the MOLM13 cell line, they are mainly about translation and ribosome biogenesis including translation, translational initiation, ribonucleoprotein complex biogenesis, ribosome biogenesis and Ribosome KEGG pathway. It is reported that m6A promotes translation of mRNAs relevant for AML proliferation (Barbieri et al., 2017; Vu et al., 2017; Weng et al., 2018) and our results show that METTL3-dependent m6A may not only influence the translation of key genes via directly modifying them but also via influence the expression of genes involved in regulation of transcription. This result is also consistent with the fact that METTL3 is associated with translating ribosomes in AML (Sorci et al., 2018). Therefore, FDmMGenes identified in MOLM13 may provide new clues to study roles of m6A in AML. For the A549 cell line, the specific functions are mainly about cell death, apoptotic process and DNA replication like regulation of apoptotic process, regulation of cell death and DNA replication. The Hela cell line specific functions are mainly about cancer, chromatin organization and histone modification including pathways in cancer, cell-cell adhesion, leukocyte transendothelial migration, focal adhesion, chromatin organization, chromatin remodeling, histone modification and histone deacetylation. All these results demonstrate the power of FunDMDeep-m6A in identifying context-specific functional genes mediated by m6A and give new hypothesis to study the function and mechanism of m6A.
4 Discussion and conclusion
We proposed FunDMDeep-m6A, a novel pipeline for identifying and prioritizing context-specific functional DmM genes from MeRIP-seq data using deep learning and network-based method. The first step of FunDMDeep-m6A is DMDeep-m6A, which is developed to identify single-base DmM sites from MeRIP-seq samples from treated and untreated conditions. To our knowledge, DMDeep-m6A is the first method and tool to identify single-base DmM sites from MeRIP-Seq data. Second, to elucidate the functional interaction of DmMGene with signaling pathways, we proposed a novel m6A-signaling bridge (MSB) to model the functional interaction of DmMGenes with signaling pathway genes and its up- and down-stream genes and used a heat diffusion process to assess the influence of DmMGenes on its MSB neighbors’ expression. Then, an MSB score for a DmMGene is calculated by summing the DE score of itself and its MSB neighbors weighted by the heat diffusion probability from it. In this way, the MSB score can be used to represent the functional significance of a DmMGene and prioritize them. Third, we used 4 PPI networks as reference network in this work to avoid the incomplete and noisy information in a single PPI network and integrated the ranks of DmMGenes based on MSB scores in all networks using the α-RRA method. The results on 4 context-specific MeRIP-Seq datasets demonstrated the power of FunDMDeep-m6A in identifying and prioritizing more context-specific and functionally significant DmMGenes. In the hESCs dataset, the prioritized FDmMGenes like PRDM14 and JUND play substantial roles in stem cell differentiation and 15 FMmMGenes including TGFB1, SMAD3, SMAD6, SMAD7, NODAL and MYC are significantly enriched in TGF-beta signaling pathway, which has essential roles in embryonic development. These significant FDmMGenes may be new markers mediated by m6A in regulating stem cell differentiation. In the MOLM13 dataset, RPL11, RPL12, RPL15, RPL19, RPL37A, RPL8 and RPS4X are involved in translational initiation, which may help regulate the translation of m6A targeted mRNAs and this may provide another clue for m6A involvement in leukemia.
In summary, FunDMDeep-m6A can efficiently identify single-base DmM sites and identify and prioritize context specific functional significant FDmMGenes by capturing the functional interactions of DmMGene with signaling pathways based on the novel idea of MSB. However, there are still several issues that need to be further addressed in the future. First, the requirement to have the DRACH motif in DmD site identification helps reduce the false positive predictions but also sacrifices the prediction sensitivity. Therefore, developing FunDMDeep-m6A without the motif limitation in the future will provide additional value. Second, we only used the DE analysis to denote the functional significance of DmMGene and its MSB neighbors. Being able to integrate the protein translation data into the analysis of the functional significance of DmMGenes in the future work will help elucidate the translational function of m6A.
Funding
This work was supported by the National Natural Science Foundation of China (61873202, 61473232, 31671373 and 91430111) awarded to SWZ and JM; and the National Institutes of Health (R01GM113245) awarded to YH.
Conflict of Interest: none declared.
Supplementary Material
References
- Anders S., Huber W. (2010) Differential expression analysis for sequence count data. Genome Biol., 11, R106.. [DOI] [PMC free article] [PubMed] [Google Scholar]
- Bansal H. et al. (2014) WTAP is a novel oncogenic protein in acute myeloid leukemia. Leukemia, 28, 1171–1174. [DOI] [PMC free article] [PubMed] [Google Scholar]
- Barbieri I. et al. (2017) Promoter-bound METTL3 maintains myeloid leukaemia by m(6)A-dependent translation control. Nature, 552, 126–131. [DOI] [PMC free article] [PubMed] [Google Scholar]
- Batista P.J. et al. (2014) m(6)A RNA modification controls cell fate transition in mammalian embryonic stem cells. Cell Stem Cell, 15, 707–719. [DOI] [PMC free article] [PubMed] [Google Scholar]
- Benjamini Y., Hochberg Y. (1995) Controlling the false discovery rate – a practical and powerful approach to multiple testing. J. R. Stat. Soc. B, 57, 289–300. [Google Scholar]
- Bertero A. et al. (2018) The SMAD2/3 interactome reveals that TGFbeta controls m(6)A mRNA methylation in pluripotency. Nature, 555, 256–259. [DOI] [PMC free article] [PubMed] [Google Scholar]
- Cao Q. et al. (2014) SLC17A9 protein functions as a lysosomal ATP transporter and regulates cell viability. J. Biol. Chem., 289, 23189–23199. [DOI] [PMC free article] [PubMed] [Google Scholar]
- Chan Y.S. et al. (2013) A PRC2-dependent repressive role of PRDM14 in human embryonic stem cells and induced pluripotent stem cell reprogramming. Stem Cells, 31, 682–692. [DOI] [PubMed] [Google Scholar]
- Chatr-Aryamontri A. et al. (2015) The BioGRID interaction database: 2015 update. Nucleic Acids Res., 43, D470–478. [DOI] [PMC free article] [PubMed] [Google Scholar]
- Chen J. et al. (2009) ToppGene Suite for gene list enrichment analysis and candidate gene prioritization. Nucleic Acids Res., 37, W305–311. [DOI] [PMC free article] [PubMed] [Google Scholar]
- Chia N.Y. et al. (2010) A genome-wide RNAi screen reveals determinants of human embryonic stem cell identity. Nature, 468, 316–320. [DOI] [PubMed] [Google Scholar]
- Cui X. et al. (2018) MeTDiff: a novel differential RNA methylation analysis for MeRIP-Seq data. IEEE/ACM Trans. Comput. Biol. Bioinform., 15, 526–534. [DOI] [PubMed] [Google Scholar]
- Das J., Yu H.Y. (2012) HINT: high-quality protein interactomes and their applications in understanding human disease. BMC Syst. Biol., 6, 92. [DOI] [PMC free article] [PubMed] [Google Scholar]
- Dennis G., Jr et al. (2003) DAVID: database for annotation, visualization, and integrated discovery. Genome Biol., 4, P3. [PubMed] [Google Scholar]
- Dominissini D. et al. (2012) Topology of the human and mouse m6A RNA methylomes revealed by m6A-seq. Nature, 485, 201–206. [DOI] [PubMed] [Google Scholar]
- Fitzsimmons C.M., Batista P.J. (2019) It's complicated… m(6)A-dependent regulation of gene expression in cancer. Biochim. Biophys. Acta Gene Regul. Mech., 1862, 382–393. [DOI] [PMC free article] [PubMed] [Google Scholar]
- Forbes S.A. et al. (2011) COSMIC: mining complete cancer genomes in the catalogue of somatic mutations in cancer. Nucleic Acids Res., 39, D945–950. [DOI] [PMC free article] [PubMed] [Google Scholar]
- Geula S. et al. (2015) Stem cells. m6A mRNA methylation facilitates resolution of naive pluripotency toward differentiation. Science, 347, 1002–1006. [DOI] [PubMed] [Google Scholar]
- Gligorijevic V. et al. (2018) deepNF: deep network fusion for protein function prediction. Bioinformatics, 34, 3873–3881. [DOI] [PMC free article] [PubMed] [Google Scholar]
- Huang H.L. et al. (2018) Recognition of RNA N-6- methyladenosine by IGF2BP proteins enhances mRNA stability and translation. Nat. Cell Biol., 20, 285. [DOI] [PMC free article] [PubMed] [Google Scholar]
- Huang X.T. et al. (2014) The role of the orphan G protein-coupled receptor 37 (GPR37) in multiple myeloma cells. Leukemia Res., 38, 225–235. [DOI] [PubMed] [Google Scholar]
- Ianniello Z., Fatica A. (2018) N6-methyladenosine role in acute myeloid leukaemia. Int. J. Mol. Sci., 19, 2345. [DOI] [PMC free article] [PubMed] [Google Scholar]
- Jeong Y.H. et al. (2010) The low-density lipoprotein receptor-related protein 10 is a negative regulator of the canonical Wnt/beta-catenin signaling pathway. Biochem. Biophys. Res. Commun., 392, 495–499. [DOI] [PubMed] [Google Scholar]
- Jin G. et al. (2012) A novel method of transcriptional response analysis to facilitate drug repositioning for cancer therapy. Cancer Res., 72, 33–44. [DOI] [PMC free article] [PubMed] [Google Scholar]
- Kaklamani V. et al. (2011) The role of the fat mass and obesity associated gene (FTO) in breast cancer risk. BMC Med. Genet., 12, 52. [DOI] [PMC free article] [PubMed] [Google Scholar]
- Khurana E. et al. (2013) Interpretation of genomic variants using a unified biological network approach. PLoS Comput. Biol., 9, e1002886. [DOI] [PMC free article] [PubMed] [Google Scholar]
- Lawrence M. et al. (2013) Software for computing and annotating genomic ranges. PLoS Comput. Biol., 9, e1003118. [DOI] [PMC free article] [PubMed] [Google Scholar]
- Leiserson M.D. et al. (2015) Pan-cancer network analysis identifies combinations of rare somatic mutations across pathways and protein complexes. Nat. Genet., 47, 106–114. [DOI] [PMC free article] [PubMed] [Google Scholar]
- Li W. et al. (2014) MAGeCK enables robust identification of essential genes from genome-scale CRISPR/Cas9 knockout screens. Genome Biol., 15, 554. [DOI] [PMC free article] [PubMed] [Google Scholar]
- Li Z.J. et al. (2017) FTO plays an oncogenic role in acute myeloid leukemia as a N-6-methyladenosine RNA demethylase. Cancer Cell., 31, 127–141. [DOI] [PMC free article] [PubMed] [Google Scholar]
- Lichinchi G. et al. (2016) Dynamics of human and viral RNA methylation during Zika virus infection. Cell Host Microbe, 20, 666–673. [DOI] [PMC free article] [PubMed] [Google Scholar]
- Lin S.B. et al. (2016) The m(6)A methyltransferase METTL3 promotes translation in human cancer cells. Mol. Cell, 62, 335–345. [DOI] [PMC free article] [PubMed] [Google Scholar]
- Linder B. et al. (2015) Single-nucleotide-resolution mapping of m6A and m6Am throughout the transcriptome. Nat. Methods, 12, 767–U114. [DOI] [PMC free article] [PubMed] [Google Scholar]
- Liu F. et al. (2014) A low level of GPR37 is associated with human hepatocellular carcinoma progression and poor patient survival. Pathol. Res. Pract., 210, 885–892. [DOI] [PubMed] [Google Scholar]
- Liu L. et al. (2017) QNB: differential RNA methylation analysis for count-based small-sample sequencing data with a quad-negative binomial model. BMC Bioinformatics, 18, 387. [DOI] [PMC free article] [PubMed] [Google Scholar]
- Loeb D.M. et al. (2001) Wilms' tumor suppressor gene (WT1) is expressed in primary breast tumors despite tumor-specific promoter methylation. Cancer Res., 61, 921–925. [PubMed] [Google Scholar]
- Love M.I. et al. (2014) Moderated estimation of fold change and dispersion for RNA-seq data with DESeq2. Genome Biol., 15, 550.. [DOI] [PMC free article] [PubMed] [Google Scholar]
- Mao X.C. et al. (2009) GCN5 is a required cofactor for a ubiquitin ligase that targets NF-kappa B/RelA. Gene Dev., 23, 849–861. [DOI] [PMC free article] [PubMed] [Google Scholar]
- Meng J. et al. (2013) Exome-based analysis for RNA epigenome sequencing data. Bioinformatics, 29, 1565–1567. [DOI] [PMC free article] [PubMed] [Google Scholar]
- Meyer K.D. et al. (2012) Comprehensive analysis of mRNA methylation reveals enrichment in 3' UTRs and near stop codons. Cell, 149, 1635–1646. [DOI] [PMC free article] [PubMed] [Google Scholar]
- Niu Y. et al. (2013) N6-methyl-adenosine (m6A) in RNA: an old modification with a novel epigenetic function. Genomics Proteomics Bioinf., 11, 8–17. [DOI] [PMC free article] [PubMed] [Google Scholar]
- Oka Y. et al. (2002) WT1 as a novel target antigen for cancer immunotherapy. Curr. Cancer Drug Targets, 2, 45–54. [DOI] [PubMed] [Google Scholar]
- Panneerdoss S. et al. (2018) Cross-talk among writers, readers, and erasers of m(6)A regulates cancer growth and progression. Sci. Adv., 4, eaar8263. [DOI] [PMC free article] [PubMed] [Google Scholar]
- Ping X.L. et al. (2014) Mammalian WTAP is a regulatory subunit of the RNA N6-methyladenosine methyltransferase. Cell Res., 24, 177–189. [DOI] [PMC free article] [PubMed] [Google Scholar]
- Razick S. et al. (2008) iRefIndex: a consolidated protein interaction database with provenance. BMC Bioinformatics, 9, 405. [DOI] [PMC free article] [PubMed] [Google Scholar]
- Robinson M.D., Oshlack A. (2010) A scaling normalization method for differential expression analysis of RNA-seq data. Genome Biol., 11, R25.. [DOI] [PMC free article] [PubMed] [Google Scholar]
- Schwartz S. et al. (2014) Perturbation of m6A writers reveals two distinct classes of mRNA methylation at internal and 5' sites. Cell Rep., 8, 284–296. [DOI] [PMC free article] [PubMed] [Google Scholar]
- Slobodin B. et al. (2017) Transcription impacts the efficiency of mRNA translation via co-transcriptional N6-adenosine methylation. Cell, 169, 326–337. [DOI] [PMC free article] [PubMed] [Google Scholar]
- Sorci M. et al. (2018) METTL3 regulates WTAP protein homeostasis. Cell Death Dis., 9, 796. [DOI] [PMC free article] [PubMed] [Google Scholar]
- Tan B. et al. (2018) Viral and cellular N(6)-methyladenosine and N(6), 2'-O-dimethyladenosine epitranscriptomes in the KSHV life cycle. Nat. Microbiol., 3, 108–120. [DOI] [PMC free article] [PubMed] [Google Scholar]
- Tirumuru N. et al. (2016) N(6)-methyladenosine of HIV-1 RNA regulates viral infection and HIV-1 Gag protein expression. Elife, 5, e15528. [DOI] [PMC free article] [PubMed] [Google Scholar]
- Tsuneyoshi N. et al. (2008) PRDM14 suppresses expression of differentiation marker genes in human embryonic stem cells. Biochem. Biophys. Res. Commun., 367, 899–905. [DOI] [PubMed] [Google Scholar]
- Vu L.P. et al. (2017) The N(6)-methyladenosine (m(6)A)-forming enzyme METTL3 controls myeloid differentiation of normal hematopoietic and leukemia cells. Nat. Med., 23, 1369–1376. [DOI] [PMC free article] [PubMed] [Google Scholar]
- Wang X. et al. (2015) N(6)-methyladenosine modulates messenger RNA translation efficiency. Cell, 161, 1388–1399. [DOI] [PMC free article] [PubMed] [Google Scholar]
- Wang Y. et al. (2014) N6-methyladenosine modification destabilizes developmental regulators in embryonic stem cells. Nat. Cell Biol., 16, 191–198. [DOI] [PMC free article] [PubMed] [Google Scholar]
- Weng H. et al. (2018) METTL14 inhibits hematopoietic stem/progenitor differentiation and promotes leukemogenesis via mRNA m(6)A modification. Cell Stem Cell, 22, 191–205 e199. [DOI] [PMC free article] [PubMed] [Google Scholar]
- Yamada H.Y., Rao C.V. (2009) BRD8 is a potential chemosensitizing target for spindle poisons in colorectal cancer therapy. Int. J. Oncol., 35, 1101–1109. [DOI] [PubMed] [Google Scholar]
- Young R.A. (2011) Control of the embryonic stem cell state. Cell, 144, 940–954. [DOI] [PMC free article] [PubMed] [Google Scholar]
- Yu H.Y. et al. (2011) Next-generation sequencing to generate interactome datasets. Nat. Methods, 8, 478–U2257. [DOI] [PMC free article] [PubMed] [Google Scholar]
- Zhang C. et al. (2016a) Hypoxia induces the breast cancer stem cell phenotype by HIF-dependent and ALKBH5-mediated m(6)A-demethylation of NANOG mRNA. Proc. Natl. Acad. Sci. USA, 113, E2047–2056. [DOI] [PMC free article] [PubMed] [Google Scholar]
- Zhang S.Y. et al. (2016b) m6A-driver: identifying context-specific mRNA m6A methylation-driven gene interaction networks. Plos Comput. Biol., 12, e1005287. [DOI] [PMC free article] [PubMed] [Google Scholar]
- Zhang S.C. et al. (2017) m(6)A demethylase ALKBH5 maintains tumorigenicity of glioblastoma stem-like cells by sustaining FOXM1 expression and cell proliferation program. Cancer Cell, 31, 591–591+. [DOI] [PMC free article] [PubMed] [Google Scholar]
- Zhang S.Y. et al. (2019) Global analysis of N6-methyladenosine functions and its disease association using deep learning and network-based methods. PLoS Comput. Biol., 15, e1006663. [DOI] [PMC free article] [PubMed] [Google Scholar]
- Zhao H. et al. (2013) Novel modeling of cancer cell signaling pathways enables systematic drug repositioning for distinct breast cancer metastases. Cancer Res., 73, 6149–6163. [DOI] [PMC free article] [PubMed] [Google Scholar]
- Zheng G.Q. et al. (2013) ALKBH5 is a mammalian RNA demethylase that impacts RNA metabolism and mouse fertility. Mol. Cell, 49, 18–29. [DOI] [PMC free article] [PubMed] [Google Scholar]
- Zhou J. et al. (2015) Dynamic m(6)A mRNA methylation directs translational control of heat shock response. Nature, 526, 591–594. [DOI] [PMC free article] [PubMed] [Google Scholar]
Associated Data
This section collects any data citations, data availability statements, or supplementary materials included in this article.