

Abstract
Objectives:
To examine trends in strong opioid prescribing in a primary care population in Wales and identify if factors such as age, deprivation and recorded diagnosis of depression or anxiety may have influenced any changes noted.
Design:
Trend, cross-sectional and longitudinal analyses of routine data from the Primary Care General Practice database and accessed via the Secure Anonymised Information Linkage (SAIL) databank.
Setting:
A total of 345 Primary Care practices in Wales.
Participants:
Anonymised records of 1,223,503 people aged 18 or over, receiving at least one opioid prescription between 1 January 2005 and 31 December 2015 were analysed. People with a cancer diagnosis (10.1%) were excluded from the detailed analysis.
Results:
During the study period, 26,180,200 opioid prescriptions were issued to 1,223,503 individuals (55.9% female, 89.9% non-cancer diagnoses). The greatest increase in annual prescribing was in the 18–24 age group (10,470%), from 0.08 to 8.3 prescriptions/1000 population, although the 85+ age group had the highest prescribing rates across the study period (from 149.9 to 288.5 prescriptions/1000 population). The number of people with recorded diagnoses of depression or anxiety and prescribed strong opioids increased from 1.2 to 5.1 people/1000 population (328%). The increase was 366.9% in areas of highest deprivation compared to 310.3 in the least. Areas of greatest deprivation had more than twice the rate of strong opioid prescribing than the least deprived areas of Wales.
Conclusion:
The study highlights a large increase in strong opioid prescribing for non-cancer pain, in Wales between 2005 and 2015. Population groups of interest include the youngest and oldest adult age groups and people with depression or anxiety particularly if living in the most deprived communities. Based on this evidence, development of a Welsh national guidance on safe and rational prescribing of opioids in chronic pain would be advisable to prevent further escalation of these medicines.
Summary points
This is the first large-scale, observational study of opioid prescribing in Wales.
Over 1 million individual, anonymised medical records have been searched in order to develop the study cohort, thus reducing recall bias.
Diagnosis and intervention coding in the Primary Care General Practice database is limited at input and may lead to under-reporting of diagnoses.
There are limitations to the data available through the Secure Anonymised Information Linkage databank because anonymously linked dispensing data (what people collect from the pharmacy) are not currently available. Consequently, the results presented here could be seen as an ‘intention to treat’ and may under- or overestimate what people in Wales actually consume.
Keywords: Analgesics, opioid, primary health care/statistics and numerical data, United Kingdom/epidemiology, adult, public health surveillance
Introduction
A recent estimate of the prevalence of pain in the United Kingdom suggests that around 44% of the population (28 million) could be living with pain of mild to severe intensity.1 Perhaps, as a consequence, opioid prescribing has increased significantly in the United Kingdom over the last 20 years.2–5 However, evidence that supports the use or value of opioids in persistent pain conditions is sparse.6–9 It is unclear whether the increase in opioid prescribing has led to an improvement in outcomes for people living with pain. Furthermore, concerns persist about the general health risks associated with opioid use.10–12 There is agreement, however, that certain groups of people using opioids are more susceptible to developing problematic use, particularly those with comorbid conditions such as depression or anxiety, previous substance misuse or difficult social circumstances.13–15
Rising concerns that the United Kingdom is following North America in terms of a prescription ‘opioid crisis’ have been widely discussed in professional journals16–18 and more mainstream media.19 It has been postulated that differences between the UK and North American healthcare systems, in respect of legislation and safeguards in place to limit and monitor prescribing of controlled drugs, provide a degree of protection to the UK population.17 Despite significant increases in opioid prescribing in the United Kingdom over the last 20 years,2,3,20 no notable changes in the number of people being diagnosed with opioid use disorders have been observed.4
In Wales, the number of hospital admissions involving opioids was reported to have fallen 2.4% to 1860 between 2010–2011 and 2014–2015.21 Increases have been reported in England where opioid poisonings accounted for 14,053 hospital admissions in 2016–2017, a 40% increase since 2006–2007.21,22
While the United Kingdom might not be in the throes of an ‘opioid epidemic’, the most recent data describe an increase in the number of opioid-associated deaths.23 In 2016, in England and Wales, 54% (2038 of 3744) of drug-related deaths had opioids, illicit or prescribed, associated – marking a new high level and following 4 years of increasing numbers of opioid-associated deaths. In Wales, 158 opioid-related deaths were recorded in 2016, which was proportionally higher than in England (5.08 per 100,000 in Wales compared to 3.38 per 100,000 in England).23 Diamorphine is detected as morphine in post-mortem toxicology and, consequently, the data are unable to differentiate between morphine and diamorphine. Notable from these data, therefore, is that the majority of deaths are related to illicit drug use rather than prescribed opioid analgesics,23 indicating that there appears to have been a stable trend in deaths related to prescribed opioids.
A research briefing by the Welsh Government in 2016 acknowledged the problems of determining the extent to which prescribed opioids may contribute to the rising death rate and hospital admissions.24 This echoes an earlier report from England, which also highlighted the lack of definitive data on the misuse of prescribed analgesics and a reliance on anecdotal reports and proxy measures such as poisoning and admissions as a means of estimating the scale of the problem.14
The aim of this study is to examine the opioid prescribing trends across the Welsh population, taking into account the other factors such as comorbidities and deprivation to form a more accurate picture of the sections of the population where opioid medicines are most widely used. Furthermore, understanding the populations receiving the highest levels of prescribing might allow Welsh Government and Local Health Boards to consider where resources are best placed to address high levels of prescribing.
Method
Prescribing data from 1 January 2005 to 31 December 2015 obtained from the Secure Anonymised Information Linkage (SAIL) databank were examined using a retrospective, cross-sectional study design. The Information Governance Review Panel (IGRP) based in SAIL granted study approval (SAIL identification no. 0507).
The SAIL databank was established in 2007 but the available datasets are backdated, even as new data sources come online.25 Unique Anonymous Linkage Fields (ALFs) are allocated to person-based records within the SAIL datasets, allowing data linkage to provide a record of all healthcare interactions for the individual.25 Consequently, the SAIL datasets allow longitudinal research in large population groups across Wales. The SAIL databank contains anonymous patient records, representing approximately 78% of primary care practices and also 78% of the total population of Wales (SAIL databank, Personal Communication, September 2017; Table 1).
Table 1.
Representation of General Practice within SAIL databank.
| 2015 population (% total) | Number of General Practices (% Wales total) | General Practices registered with SAIL (% SAIL total) | |
|---|---|---|---|
| Wales total | 3,099,086 (100) | 443 (100) | 345 (78) |
| Health Board (HB) | |||
| Abertawe Bro Morgannwg | 525,466 (17) | 73 (16) | 70 (20) |
| Aneurin Bevan | 581,789 (19) | 82 (19) | 57 (17) |
| Betsi Cadwalader | 694,473 (22) | 109 (25) | 82 (24) |
| Cardiff and Vale | 484,752 (16) | 66 (15) | 53 (15) |
| Cwm Taf | 296,735 (10) | 43 (10) | 33 (10) |
| Hywel Dda | 383,229 (12) | 53 (12) | 43 (12) |
| Powys | 132,642 (4) | 17 (4) | 7 (2) |
Data identification
People prescribed opioid medications between 2005 and 2015 were identified from the SAIL datasets by individual read codes for each medicine. Read codes, a thesaurus of clinical terms, are currently used for recording all interactions, diagnoses and interventions within Primary Care in Wales, with a reliance on individual practitioners to input codes in regards to investigations and diagnosis. However, prescriptions are automatically coded at input and, consequently, this is a reliable method of data identification and has been validated by its use in other studies.2,3,25,26 Read codes for prescribable opioid preparations were taken from the Clinical Terminology Browser available from the NHS Information Authority and accessed via the SAIL gateway. Prescribing patterns reported in this study provide an overview of ‘intention to treat’ rather than actual opioid consumption in Wales. This is due to the fact that, while dispensing data are available, they cannot be anonymously linked to individuals at present and are therefore not available in SAIL.
Prescriptions for any opioid preparation (see Table 3), including products combined with a non-opioid analgesic, for example, paracetamol, were identified within the Primary Care General Practice event database using read codes for the individual product. All available formulations of the opioid medicines were included.
Table 3.
Study categorisation of weak and strong opioids.
| Weak opioid | Strong opioid |
|---|---|
| Buprenorphine 5, 10, 15 and 20 µg/h patch | Buprenorphine – S/L preparations < 2 mg, ⩾35 µg/h patches |
| Codeine | Diamorphine |
| Dihydrocodeine | Fentanyl |
| Dextropropoxyphene | Hydromorphone |
| Dipipanone | Methadone – tablets only |
| Meptazinol | Morphine |
| Pentazocine (with paracetamol) | Oxycodone |
| Tramadol | Pentazocine |
| Pethidine | |
| Tapentadol |
All opioid prescriptions were linked to individual patient demographic data using the ALFs. Data relating to patients aged less than 18 years were removed and only patients aged 18 years or over during the study period (2005–2015) were included. Further stratification into cancer and non-cancer groups was undertaken using read codes for cancer diagnoses as a flag within the collated data. Within the non-cancer group, read codes for recorded depression or anxiety diagnoses at any time within the study period identified a subgroup for further analysis.
All data were subjected to repeated cross-sectional sampling to determine annual time series and prescribing trends over the study period.
Deprivation scores
The Welsh Index of Multiple Deprivation (WIMD) is the official measure used by the Welsh Government to determine relative deprivation of areas within Wales.27 The WIMD is a weighted total score of deprivation based on income (23.5%), employment status (23.5%), health (14%), education (14%), geographical access of services (10%), community safety (5%), physical environment (5%) and housing (5%). Scores are not linear so areas in group 2 are not twice as deprived as those in group 4.27 For this study, the 2011 Index was used and presented in quintiles with WIMD1 being the most deprived areas and WIMD5 the least deprived (Table 2).
Table 2.
Changes in SAIL databank population within Welsh Index of Multiple Deprivation areas between 2005 and 2015.
| Welsh Index of Multiple Deprivation (WIMD) |
|||||
|---|---|---|---|---|---|
| 1 | 2 | 3 | 4 | 5 | |
| Population | |||||
| 2005 | 474,322 | 471,917 | 449,154 | 439,017 | 478,200 |
| 2015 | 490,276 | 490,460 | 471,156 | 462,270 | 496,737 |
| Percentage change (%) | 3.4 | 3.9 | 4.9 | 5.3 | 3.9 |
SAIL: Secure Anonymised Information Linkage.
Measuring utilisation
The number of prescriptions and the number of patients per year, per group (weak or strong opioid) and per drug (by name) were calculated in repeat, cross-sections for each year and further stratified into cancer and non-cancer groups. Data were standardised to annual population size using data taken from the Office for National Statistics (ONS)28 and StatsWales.29 Age group data were standardised by age group population and deprivation data were standardised by population per quintile.
Categorisation of weak and strong opioids
Opioids were categorised into weak or strong groups (Table 3) based on recognised listing by the World Health Organisation,30 the British National Formulary31 (BNF) and clinical guidelines, where drugs might be categorised on the basis of the order in which they are used in clinical practice.32
Data analysis
Data were extracted from the study tables within SAIL using Structured Query Language code searches in the Eclipse software. Trends were reported standardised for population and with percentage change rate of prescribing and people receiving prescriptions over the study period noted.
Patient involvement
People living with non-cancer-related pain (patients) were not involved in developing the research question, choosing outcome measures, study design or assisting in the interpretation or dissemination of the results. Following publication, results will be shared with patient groups and other organisations where there is patient–public involvement. The authors encourage feedback and discussion from people living with non-cancer pain, in order to develop meaningful outcomes from the research and to develop further research.
Results
Number of people prescribed opioids
Between 2005 and 2015, there were 26,180,200 prescriptions for all opioid medications and all indications, issued to 1,223,503 patients (Table 4). People without a recorded diagnosis of cancer comprised 89.8%, of all those receiving prescriptions for opioids. The annual increase in the number of people prescribed opioids for any diagnosis was 12.2% when standardised to annual population (Table 4). Over the same period, the population of Wales increased 4.4%.28 Over the 11-year study period, the number of people receiving opioid prescriptions and those who had a recorded cancer diagnosis reduced by 6.8% (from 19.2 to 17.9 per 1000 population). Conversely, people without a recorded cancer diagnosis receiving opioid prescriptions increased 19.4% (from 126.2 to 150.6 per 1000 population) over the same period.
Table 4.
Characteristics of opioid users included during the study period (2005–2015).
| Total opioid users (% total) | Non-cancer group (% total) | Cancer group (% total) | |
|---|---|---|---|
| Number of people | 1,223,503 (100) | 1,099,026 (89.8) | 124,477 (10.2) |
| Gender | |||
| Male | 539,004 (44.1) | 478,738 (43.6) | 60,266 (48.4) |
| Female | 684,499 (55.9) | 620,288 (56.4) | 64,211 (51.6) |
| Age (years at index datea) | |||
| Mean ± SD | 57.2 ± 19.2 | 55.6 ± 19.1 | 71.2 ± 13.7 |
| Range | 18–114 | 18–114 | 18–108 |
| Rank of age (years at index datea) | |||
| 18–24 | 37,898 (3.1) | 37,715 (3.4) | 183 (0.1) |
| 25–44 | 313,062 (25.6) | 307,826 (28.0) | 5236 (4.2) |
| 45–64 | 403,305 (33.0) | 374,490 (34.1) | 28,815 (23.1) |
| 65–74 | 205,134 (16.8) | 170,720 (15.5) | 34,414 (27.6) |
| 75–84 | 162,011 (13.2) | 126,601 (11.5) | 35,410 (28.4) |
| 85+ | 102,093 (8.3) | 81,674 (7.4) | 20,419 (16.4) |
SD: standard deviation.
Index date: 1 January 2016.
The prevalence of opioid prescribing in Wales peaked in 2012 at 16.7% and then started to reduce slowly. In 2015, the prevalence was 15.9% (Figure 1). Strong opioids accounted for 6% of all opioid prescriptions in 2005 (48.3 of 809.9 prescriptions per 1000 population). In 2015, strong opioid prescribing had increased to 17.7% of all opioid prescriptions (199 of 1127.6 prescriptions per 1000 population).
Figure 1.

Trend in all opioid prescriptions during 2005–2015 and population prevalence; data are adjusted by annual population.
Strong opioid prescribing for people without a recorded diagnosis of cancer
The number of people receiving strong opioid prescriptions who did not have a recorded diagnosis of cancer (non-cancer) tripled between 2005 and 2015 (Table 5).
Table 5.
Changes in strong opioid prescribing per 1000 population for non-cancer pain in Wales during 2005–2015.
| Prescriptions |
People receiving prescriptions |
|||||
|---|---|---|---|---|---|---|
| 2005 (n = 1,875,340) | 2015 (n = 2,721,688) | Change rate in prescriptions during 2005–2015 (%) | 2005 (n = 336,711) | 2015 (n = 406,772) | Change rate in people receiving prescriptions during 2005–2015 (%) | |
| All opioids | 809.9 | 1127.6 | 39.2 | 145.4 | 168.5 | 15.9 |
| Cancer | 113.1 | 126.9 | 12.2 | 19.2 | 17.9 | −6.8 |
| Non-cancer | 696.8 | 1000.7 | 43.6 | 126.2 | 150.6 | 19.4 |
| Non-cancer | ||||||
| Strong opioids | 40.2 | 163.1 | 306.2 | 4.4 | 13.3 | 200.1 |
| Weak opioids | 656.6 | 837.6 | 27.6 | 121.8 | 137.4 | 12.8 |
| Strong opioids | ||||||
| Gender | ||||||
| Male | 41.0 | 146.6 | 257.9 | 3.7 | 10.1 | 170 |
| Female | 39.5 | 175.5 | 344.0 | 5.1 | 16.3 | 222.4 |
| Age group (years) | ||||||
| 18–24 | 0.08 | 8.3 | 10470.4 | 0.02 | 1.2 | 5165.6 |
| 25–44 | 16.0 | 104.2 | 550.9 | 1.31 | 6.7 | 413.7 |
| 45–64 | 49.0 | 220.0 | 348.5 | 4.53 | 15.0 | 232.0 |
| 65–74 | 73.6 | 193.8 | 163.4 | 8.28 | 17.5 | 111.9 |
| 75–84 | 74.7 | 225.6 | 202.0 | 11.1 | 24.6 | 120.8 |
| 85+ | 149.9 | 288.5 | 92.5 | 23.2 | 43.5 | 87.8 |
| Recorded diagnosis | ||||||
| Depression/anxiety | 12.6 | 72.1 | 473.5 | 1.2 | 5.1 | 328.0 |
| No depression/anxiety | 27.6 | 90.8 | 229.2 | 3.4 | 8.4 | 149.9 |
Data are standardised by population, age, gender and deprivation score.
Gender
More women than men received prescriptions in all diagnosis groups studied (Table 3). The number of females without a recorded cancer diagnosis receiving strong opioid prescriptions increased by 222.4% (from 5.1 to 16.3 per 1000 population) compared to a 170% increase in males (from 3.7 to 10.1 per 1000 population) (Table 5).
Non-cancer strong opioid prescriptions increased more in females than males (344% increase compared to 257.9%, respectively; Table 5).
Age groups
A third of people receiving opioid prescriptions for all diagnoses and non-cancer pain were within the 45–64 years age group (Table 4), and this was reflected in the group without a cancer diagnosis as well. The greatest increase in the annual number of people receiving prescriptions was seen in people aged 18–24 years (from 0.02 to 1.2 people per 1000 population; Table 5), although the number of people is low in real terms (Figure 2). People aged 85 years and older had the lowest percentage increase in numbers despite being the age group with the greatest number of people receiving opioid prescriptions (Table 5).
Figure 2.
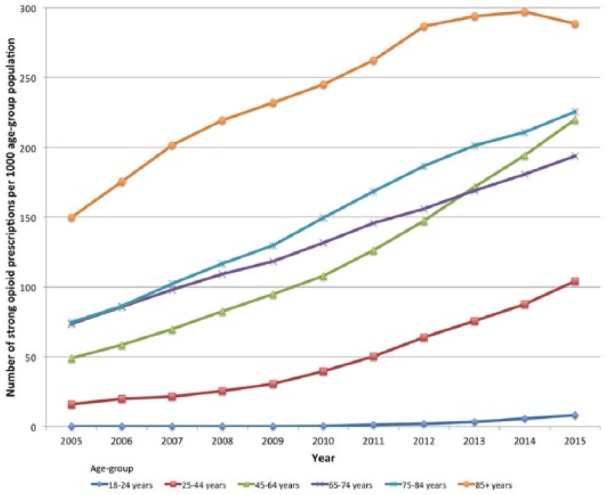
Strong opioid prescribing during 2005–2015 by age group and prescriptions per 1000 population; data are adjusted by annual age group population.
The number of prescriptions per 1000 age group population was the greatest in the oldest age group (85+ years) and rose by 92.5% over the study period (from 149.9 to 288.5 per 1000 population). Percentage increase in annual prescription numbers was the highest in the 18–24 years age group (10,470% from 0.08 to 8.3 per 1000 age group population) despite there being nearly 35 times difference between prescription numbers per 1000 in the youngest and oldest age groups.
Strong opioid prescribing by drug
Morphine was the most commonly prescribed strong opioid for the whole study period. In 2005, 38% of people receiving strong opioid prescriptions for non-cancer pain had morphine and this rose to 64% in 2015, marking a 380.9% increase (from 2.0 to 9.5 prescriptions per 1000 population; Table 6).
Table 6.
Changes in strong opioid prescribing by drug.
| Strong opioid | Prescriptions |
People receiving prescriptions |
||||
|---|---|---|---|---|---|---|
| 2005 | 2015 | Change rate (%) | 2005 | 2015 | Change rate (%) | |
| Morphine | 16.9 | 104.2 | 515.8 | 2.0 | 9.5 | 380.9 |
| Oxycodone | 5.5 | 25.7 | 371.5 | 0.6 | 1.7 | 197.8 |
| Fentanyl | 6.2 | 18.3 | 193.3 | 1.0 | 1.7 | 63.0 |
| Buprenorphine | 8.1 | 9.4 | 15.1 | 1.0 | 0.6 | −36.3 |
| Other | 3.4 | 5.5 | 62.9 | 0.7 | 1.4 | 103.2 |
Morphine prescriptions rose from 16.9 to 104.2 prescriptions per 1000 population (515.8% increase) between 2005 and 2015. The proportion of strong opioid prescribing that morphine comprised in 2015 was 64% and was the same for the number of people prescribed strong opioids (Figure 3).
Figure 3.

Trend in the annual number of strong opioid prescriptions per 1000 population and named drug.
Strong opioid prescribing trends in people with a diagnosis of depression or anxiety
The number of people with a recorded diagnosis of depression or anxiety and those who received strong opioid prescriptions increased by 328% over the study period (from 1.2 to 5.1 people per 1000 population). This was twice the increase noted in the number of people receiving strong opioid prescriptions but without a recorded diagnosis of depression or anxiety (149.9% increase; Table 5).
The number of strong opioid prescriptions where there was a recorded diagnosis of depression or anxiety increased by 473.5% in the 11 years of the study compared to a 229.2% where there was not a recorded depression or anxiety diagnosis.
Deprivation
The biggest increase in the number of people receiving strong opioid prescriptions for non-cancer pain was seen in the most deprived areas of Wales (WIMD1; Table 7) and nearly twice as many people received strong opioids in the most deprived areas compared to those in the least deprived areas.
Table 7.
Strong opioid prescribing by area of deprivation (presented by quintiles based on WIMD2011; WIMD1 = most deprived, WIMD5 = least deprived).
| Deprivation score (WIMD2011) | Prescriptions |
People receiving prescriptions |
||||
|---|---|---|---|---|---|---|
| 2005 | 2015 | Change rate (%) | 2005 | 2015 | Change rate (%) | |
| All strong opioids | ||||||
| 1 | 47.7 | 212.6 | 345.8 | 5.1 | 15.7 | 210.9 |
| 2 | 44.3 | 175.9 | 297.1 | 4.7 | 14.0 | 200.0 |
| 3 | 43.3 | 170.4 | 293.9 | 4.9 | 14.3 | 192.5 |
| 4 | 31.6 | 121.6 | 285.2 | 3.7 | 10.9 | 191.5 |
| 5 | 22.5 | 88.3 | 291.9 | 3.1 | 8.7 | 180.5 |
| Diagnosed depression/anxiety | ||||||
| 1 | 15.3 | 104.0 | 577.5 | 1.5 | 7.0 | 366.9 |
| 2 | 13.2 | 68.4 | 418.4 | 1.3 | 5.5 | 310.0 |
| 3 | 8.2 | 46.4 | 466.6 | 1.2 | 5.0 | 303.5 |
| 4 | 6.6 | 39.4 | 495.3 | 0.8 | 3.7 | 332.0 |
| 5 | 2.9 | 15.1 | 418.1 | 0.7 | 2.9 | 310.3 |
| No diagnosed depression/anxiety | ||||||
| 1 | 32.4 | 108.7 | 235.9 | 3.6 | 8.8 | 141.3 |
| 2 | 28.9 | 95.3 | 229.8 | 3.3 | 8.5 | 150.2 |
| 3 | 29.4 | 99.2 | 237.5 | 3.6 | 9.3 | 154.6 |
| 4 | 23.2 | 74.4 | 220.6 | 2.9 | 7.2 | 155.0 |
| 5 | 16.5 | 51.6 | 213.8 | 2.4 | 5.7 | 145.8 |
More than twice as many people with a recorded diagnosis of depression or anxiety lived in the most deprived areas compared to the number in the least deprived (Table 7). There were more people without a recorded diagnosis of depression or anxiety in areas within the 3rd quintile of deprivation (Figure 3).
The number of prescriptions for strong opioids was the highest in the most deprived areas of Wales for people with or without a recorded diagnosis of depression or anxiety (Table 7). Areas of greatest deprivation had the largest increase in strong opioid prescribing when people had a recorded diagnosis of depression or anxiety (577.5%, from 15.3 to 104 prescriptions per 1000 population; Figure 4).
Figure 4.

Strong opioid prescribing by area of deprivation (presented by quintiles from WIMD2011). Annual data are adjusted by deprivation area population. WIMD1 = most deprived areas, WIMD5 = least deprived areas.
Discussion
This study demonstrates an increase in weak and strong opioid prescribing and, more specifically, a large increase in strong opioid prescribing across Wales between 2005 and 2015 with four times more prescriptions issued in 2015 compared to 2005. Morphine was the most commonly prescribed strong opioid throughout the 11-year study period. The majority of prescriptions for strong opioids in Wales were for people without a recorded cancer diagnosis and people aged 65 years and older received proportionally more opioid prescriptions than the younger age groups. While around a third of strong opioid prescriptions were issued to people with a recorded diagnosis of depression or anxiety, the largest increase in prescribing was seen in that group. Furthermore, areas of greatest deprivation had higher levels of strong opioid prescribing than the least deprived areas across Wales. Wales has the lowest overall life expectancy in the United Kingdom and high levels of deprivation.33 The country also has historically high levels of obesity and low activity which add to the public health burden.33,34 These factors have been associated with higher incidence of chronic non-malignant pain35 and, consequently, the high level of prescribing is perhaps not entirely unexpected.
The observed increase in opioid prescribing in Wales is comparable to findings from other UK studies such as a sixfold increase in strong opioid prescribing in a primary care population in Yorkshire between 2005 and 2012, which was previously reported,5 and a similar increase was also seen in Tayside in Scotland between 1995 and 2005.3 While those studies were for localised populations, large international population-based studies have also shown increases in strong opioid prescribing over similar time periods.36–38 Consequently, the changes in strong opioid prescribing seen in Wales were expected, albeit not previously examined.
The predominance of prescribing for non-cancer pain is in line with a study of primary care prescribing in England and Wales which found that 87.8% of strong opioid prescriptions were for people without a cancer diagnosis.2 Similarly, the greater representation of women receiving strong opioid prescriptions has also been observed in other UK studies.20 Population percentages of females receiving opioid prescriptions have been reported between 51.5%3 and 59.9%2 in UK studies and so the percentage of women in Wales is not unexpected. It is widely accepted that women more frequently report and seek treatment for chronic pain than men,39,40 putting our findings here in line with the previously described epidemiology.
The higher levels of strong opioid prescribing in the age groups that are 65 years and older described here mirrors other UK studies. Zin et al.2 described 31.7% of strong opioid users to be aged between 66 and 80 years. Other research groups have also described higher rates of strong opioid prescribing in age groups over 65 years20 and that prescribing is disproportionally higher in people over 60 years of age than the other age groups.3 A higher incidence of women aged over 65 receiving strong opioids compared to men of the same age is also described in the literature.5
The implications for higher levels of strong opioid prescribing in older people include the increased risk of interactions with polypharmacy, notably other central nervous system medications such as benzodiazepines and anti-depressants.41 Evidence exists that older people taking prescribed opioid medicines are at an increased risk of falls and fractures,42–44 which further increases the probability of morbidity and mortality. The contrasting issue however is the concern that pain itself can place older people at risk of falls45,46 which imposes a difficult choice upon prescribers trying to adequately support that population of patients.
Previous studies in Scotland and England have noted a similar predominance of morphine prescribing described here, even when increases in alternative opioids are noted.2,3 In Wales, national prescribing indicators are set each year to encourage rational and evidence-based use of medicines and targeted to specific clinical areas.47 Between 2012 and 2016, the All Wales Medicines Strategy Group (AWMSG) set an indicator to encourage the use of morphine and increase morphine as a total percentage of all strong opioid prescribing,47 and this corresponds with a more marked increase in morphine prescription numbers (Figure 3).
The increase in strong opioid prescribing for people with a recorded diagnosis of depression or anxiety is perhaps not unforeseen, given the long-known links between the co-occurrence of chronic pain and depression or anxiety.48,49 However, that prescribing rates increased more than in people without a diagnosis of depression or anxiety requires more investigation and analysis. Evidence has been presented to suggest that opioids can increase the prevalence of new and recurrent depressive episodes, particularly when opioids are given at high dose.50–53 So assurances are required that such patterns of prescribing are not placing people at greater risk of morbidity.
Higher prevalence of strong opioid prescribing in areas of greatest deprivation was a marked finding of this study. A recent examination of opioid prescribing in England noted similar outcomes in terms of a strong relationship between opioid prescribing and areas of most deprivation.54 Studies in Germany55 and the United States56 have also described the associations between higher rates of opioid prescribing and lower socio-economic conditions.
It is worrying given the recently declared national emergency on opioid prescribing in the United States57 where, despite misuse and addiction touching all parts of society, by far the worst affected are those in the most deprived areas where health and social inequalities prevail.56,58
Strengths of the study
This study provides a population view of prescribing over an extended period and using a large dataset, which consequently avoids recall bias. The SAIL dataset includes all people prescribed opioids from each practice providing data to the organisation24,59 which avoids selection bias. Furthermore, as SAIL gathers data from a representative majority of the population, it also reduces regional variation. Large databases of diagnostic and prescribing data have been scrutinised for their validity and determined as an accurate means for recording diagnoses in Primary Care.60,61 A plethora of prescribing data are available through National Health Service sources that can be used to highlight geographical areas or practices where opioid prescribing might be of concern. However, prescribing data alone does not provide an indication of diagnosis nor tell us how long an individual has been using the medication.62,63 It does not also permit users to identify individuals on multiple medications, which might increase overall risk of harm from opioid medications or the combined risk of multiple medications or comorbidities.
Limitations of the study
The datasets currently available from SAIL do not include dispensing data (what is actually issued from community pharmacies) and, therefore, are not a measure of opioid drugs consumed. Prescribing data are essentially an ‘intention to treat’ and, consequently, could present an overestimation of opioid use in Primary Care. Further planned analysis of the data will include a comparison with dispensing data in order to determine the accuracy of prescribing estimates made using SAIL data. This will be of benefit for future studies across all areas of prescribing in Wales. The lack of data on dosing through the SAIL databank means that it is not possible to provide data by morphine equivalent dose (MED). Proxies for MED measurements are being examined as the total intake is an important measure when examining long-term harms of opioids.64
A pragmatic approach was taken, in respect of the categorisation of opioids for this study. As described, BNF classification and clinical placement were used but may not correspond with the categories used in other studies.
Duration of prescribing and whether people received prescriptions for multiple opioids have not been included in the analysis described here. Examination of the data continues in that respect, as harms of opioids are known to be connected to exposure duration as well as the total intake.64
Conclusion
This study is the first of its kind in Wales and demonstrates the major increase in strong opioid prescribing between 2005 and 2015. The Welsh data resemble those seen in other parts of the United Kingdom and further afield, in respect of persistent increases in prescribing levels over the last 20 years.
High levels of opioid prescribing within the relatively deprived and unhealthy Welsh population are of concern. The rising use of opioids for non-cancer-related pain and particularly those categorised as ‘strong’ (e.g. morphine, oxycodone and fentanyl) has been of increasing concern to healthcare professionals and policymakers around the world for many years.65–67
The increase in strong opioid prescribing in Wales is alarming, particularly during a time of growing evidence of harms caused by long-term and high-dose use.64,68,69 International guidelines have, for some time,8,26,70–72 advocated a ‘lowest effective dose for the shortest time’ approach to opioid prescribing. However, no nationally agreed guidelines for the management of chronic pain currently exist in Wales. Scotland produced national guidelines on the management of chronic pain in 201326 and have recently released improvement guidelines for quality prescribing in chronic pain.73 It would seem prudent, on the basis of the preliminary findings presented here, that Wales takes note and thinks to develop guidance of this sort if it wishes to avoid further escalation of strong opioid prescribing and the potential for an opioid crisis of its own.
Acknowledgments
Fatemeh Torabi and Ashley Akbari from The Farr Institute Cypher, Prudent Healthcare Intelligence Hub, Administrative Data Research Centre Wales, Swansea Medical School have advised on the study design and data extraction process from the SAIL databank and critically reviewed the study proposal. Fatemeh Torabi provided the technical expertise to undertake databank interrogation in accordance with the restrictions of SAIL. Both of them have undertaken technical review of the methodology section of the manuscript. E.D., C.P., J.R. and B.S. initiated and developed the research questions. E.D. conducted the data analysis and interpretation and led drafting and development of the manuscript. All authors critically revised the manuscript and approved the final version submitted for publication. The guarantor of this article is E.D.
Footnotes
Conflict of interest: The author(s) declared no potential conflicts of interest with respect to the research, authorship and/or publication of this article.
Data sharing statement: Raw data are not currently available pending approval for release from SAIL. It is envisaged to be available via Dryad in due course.
Ethical approval: Ethical approval was not sought as this is a retrospective review of databases.
Funding: This work was supported by Pharmacy Research UK (PRUK reference no. PRUK-2016-PA1-A). The views expressed in this report are those of the author/s and not necessarily that of Pharmacy Research UK. The PhD Fellowship (E.D.) has been partly funded by the Welsh Government, through Health and Care Research Wales as part of the Research Capacity Building Collaboration (RCBC)Wales programme.
Informed consent: Informed consent was not sought as this is a retrospective review of databases.
Trial registration: The project is registered with SAIL (0507 – TOPAS) and Swansea University. It is not registered with Health and Research Wales as it does not include direct patient input due to the nature of a large dataset study.
ORCID iD: Emma Davies  https://orcid.org/0000-0003-1171-3201
References
- 1. Fayaz A, Croft P, Langford RM, et al. Prevalence of chronic pain in the UK: a systematic review and meta-analysis of population studies. BMJ Open 2016; 6(6): e010364. [DOI] [PMC free article] [PubMed] [Google Scholar]
- 2. Zin CS, Chen LC, Knaggs RD. Changes in trends and pattern of strong opioid prescribing in primary care. Eur J Pain 2014; 18(9): 1343–1351. [DOI] [PMC free article] [PubMed] [Google Scholar]
- 3. Ruscitto A, Smith BH, Guthrie B. Changes in opioid and other analgesic use 1995-2010: repeated cross-sectional analysis of dispensed prescribing for a large geographical population in Scotland. Eur J Pain 2014; 19(1): 59–66. [DOI] [PubMed] [Google Scholar]
- 4. Cooper AJM, Willis J, Fuller J, et al. Prevalence and incidence trends for diagnosed prescription opioid use disorders in the United Kingdom. Pain Ther 2017; 6: 73–84. [DOI] [PMC free article] [PubMed] [Google Scholar]
- 5. Foy R, Ben Leaman McCrorie C, Petty D, et al. Prescribed opioids in primary care: cross-sectional and longitudinal analyses of influence of patient and practice characteristics. BMJ Open 2016; 6(5): e010276. [DOI] [PMC free article] [PubMed] [Google Scholar]
- 6. Chou R, Ballantyne JC, Fanciullo GJ, et al. Research gaps on use of opioids for chronic noncancer pain: findings from a review of the evidence for an American Pain Society and American Academy of Pain Medicine clinical practice guideline. J Pain 2009; 10(2): 147–159. [DOI] [PubMed] [Google Scholar]
- 7. Chapman CR, Lipschitz DL, Angst MS, et al. Opioid pharmacotherapy for chronic non-cancer pain in the United States: a research guideline for developing an evidence-base. Journal of Pain 2010; 11(9): 807–829. [DOI] [PubMed] [Google Scholar]
- 8. Franklin GM. Opioids for chronic noncancer pain: a position paper of the American Academy of Neurology. Neurology 2014; 83(14): 1277–1284. [DOI] [PubMed] [Google Scholar]
- 9. Chaparro LE, Furlan AD, Deshpande A. Opioids compared with placebo or other treatments for chronic low back pain: an update of the Cochrane review. Spine (Phila Pa 1976) 2014; 39: 556–563. [DOI] [PubMed] [Google Scholar]
- 10. Gomes T, Mamdani MM, Dhalla IA, et al. Opioid dose and drug-related mortality in patients with nonmalignant pain. Arch Intern Med 2011; 171(7): 686–691. [DOI] [PubMed] [Google Scholar]
- 11. Gomes T, Mamdani MM, Dhalla IA, et al. The burden of premature opioid-related mortality. Addiction 2014; 109(9): 1482–1488. [DOI] [PMC free article] [PubMed] [Google Scholar]
- 12. Seyfried O, Hester J. Opioids and endocrine dysfunction. Br J Pain 2012; 6(1): 17–24. [DOI] [PMC free article] [PubMed] [Google Scholar]
- 13. Ballantyne JC. Assessing the prevalence of opioid misuse, abuse, and addiction in chronic pain. Pain 2015; 156(4): 567–568. [DOI] [PubMed] [Google Scholar]
- 14. Shapiro H. Opioid painkiller dependency (OPD): an overview: a report written for the All-Party Parliamentary Group on Prescribed Medicine Dependency, pp. 1–18, http://www.drugwise.org.uk/wp-content/uploads/opioid_painkiller_dependency_final_report_sept_201.pdf
- 15. Ballantyne JC, LaForge KS. Opioid dependence and addiction during opioid treatment of chronic pain. Pain 2007; 129(3): 235–255. [DOI] [PubMed] [Google Scholar]
- 16. Stannard C. Opioids in the UK: what’s the problem? BMJ 2013; 347: f5108. [DOI] [PubMed] [Google Scholar]
- 17. Weisberg DF, Becker WC, Fiellin DA, et al. Prescription opioid misuse in the United States and the United Kingdom: cautionary lessons. Int J Drug Policy 2014; 25(6): 1124–1130. [DOI] [PubMed] [Google Scholar]
- 18. Shei A, Hirst M, Kirson NY, et al. Estimating the health care burden of prescription opioid abuse in five European countries. Clinicoecon Outcomes Res 2015; 7: 477–488. [DOI] [PMC free article] [PubMed] [Google Scholar]
- 19. Marsh S. ‘Unnecessary’ painkillers could leave thousands addicted, doctors warn. The Guardian, 5 May 2017, https://www.theguardian.com/science/2017/may/05/unnecessary-opioid-painkiller-prescriptions-thousands-addicted-nhs-doctors-warn
- 20. Bedson J, Chen Y, Hayward RA, et al. Trends in long-term opioid prescribing in primary care patients with musculoskeletal conditions. Pain 2016; 157(7): 1525–1531. [DOI] [PMC free article] [PubMed] [Google Scholar]
- 21. Emmerson C, Smith J. Reading between the lines: the annual profile for substance misuse 2014-15, November 2015, pp. 1–86, http://www2.nphs.wales.nhs.uk:8080/SubstanceMisuseDocs.nsf/61c1e930f9121fd080256f2a004937ed/9033e325fd64e85980257eed0031a86a/$FILE/Reading_between_the_lines_Annual_Profile_Substance_Misuse_Wales_2014-15.pdf
- 22. Health Social Care Information Centre, https://digital.nhs.uk/data-and-information/publications/statistical/statistics-on-drug-misuse/2018 (accessed April 2018).
- 23. Office for National Statistics. Deaths related to drug poisoning in England and Wales: 2015 registrations. Office for National Statistics, 8 September 2016, pp. 1–27. [Google Scholar]
- 24. Roberts H. Misuse of prescription and over-the-counter medications, 28 June 2016, pp. 1–12, http://www.assembly.wales/research%20documents/16-039%2016-039%20-%20addication%20to%20over%20the%20counter%20prescriptions/16-039-web-english.pdf
- 25. Ford DV, Jones KH, Verplancke J-P, et al. The SAIL databank: building a national architecture for e-health research and evaluation. BMC Health Serv Res 2009; 9: 157. [DOI] [PMC free article] [PubMed] [Google Scholar]
- 26. Lyons RA, Jones KH, John G, et al. The SAIL databank: linking multiple health and social care datasets. BMC Med Inform Decis Mak 2009; 9(1): 3. [DOI] [PMC free article] [PubMed] [Google Scholar]
- 27. Wales SF. Welsh Index of Multiple Deprivation, 2011, p. 15, http://gov.wales/docs/statistics/2011/110922wimd11guidanceen.pdf
- 28. Office for National Statistics, https://www.ons.gov.uk/peoplepopulationandcommunity/populationandmigration/populationestimates (accessed February 2018).
- 29. StatsWales, https://statswales.gov.wales/Catalogue/Population-and-Migration/Population/Estimates (accessed February 2018).
- 30. World Health Organization, http://www.who.int/cancer/palliative/painladder/en/ (accessed December 2017).
- 31. British National Formulary, https://bnf.nice.org.uk/treatment-summary/analgesics.html (accessed December 2017).
- 32. Network SIG. Management of chronic pain. SIGN 136, 6 December 2013, pp. 1–71. [Google Scholar]
- 33. Edwards RT, Charles JM, Thomas S, et al. A national Programme Budgeting and Marginal Analysis (PBMA) of health improvement spending across Wales: disinvestment and reinvestment across the life course. BMC Public Health 2014; 14(1): 837. [DOI] [PMC free article] [PubMed] [Google Scholar]
- 34. Public Health Wales Observatory. Lifestyle and health, 18 January 2010, pp. 1–10, http://www.publichealthwalesobservatory.wales.nhs.uk/profiles-of-lifestyle-and-health/ (accessed December 2017).
- 35. Price C, Hoggart B, Olukoga O, et al. National Pain Audit Final Report 2010–2012. British Pain Society and Dr Foster, 2012, https://www.britishpainsociety.org/static/uploads/resources/files/members_articles_npa_2012_1.pdf
- 36. Fischer B, Jones W, Rehm JR. Trends and changes in prescription opioid analgesic dispensing in Canada 2005. 2012: an update with a focus on recent interventions. BMC Health Serv Res 2014; 14(1): 1–8. [DOI] [PMC free article] [PubMed] [Google Scholar]
- 37. Gomes T, Mamdani MM, Paterson JM, et al. Trends in high-dose opioid prescribing in Canada. Can Fam Physician 2014; 60(9): 826–832. [PMC free article] [PubMed] [Google Scholar]
- 38. Wagemaakers FN, Hollingworth SA, Kreijkamp-Kaspers S, et al. Opioid analgesic use in Australia and the Netherlands: a cross-country comparison. Int J Clin Pharm 2017; 39(4): 874–880. [DOI] [PubMed] [Google Scholar]
- 39. Breivik H, Collett B, Ventafridda V, et al. Survey of chronic pain in Europe: prevalence, impact on daily life, and treatment. Eur J Pain 2006; 10(4): 287–333. [DOI] [PubMed] [Google Scholar]
- 40. Stubbs D, Krebs E, Bair M, et al. Sex differences in pain and pain-related disability among primary care patients with chronic musculoskeletal pain. Pain Med 2010; 11(2): 232–239. [DOI] [PubMed] [Google Scholar]
- 41. Gerlach LB, Olfson M, Kales HC, et al. Opioids and other central nervous system-active polypharmacy in older adults in the United States. J Am Geriatr Soc 2017; 65(9): 2052–2056. [DOI] [PMC free article] [PubMed] [Google Scholar]
- 42. Miller M, Stürmer T, Azrael D, et al. Opioid analgesics and the risk of fractures in older adults with arthritis. J Am Geriatr Soc 2011; 59(3): 430–438. [DOI] [PMC free article] [PubMed] [Google Scholar]
- 43. Saunders KW, Dunn KM, Merrill JO, et al. Relationship of opioid use and dosage levels to fractures in older chronic pain patients. J Gen Intern Med 2010; 25(4): 310–315. [DOI] [PMC free article] [PubMed] [Google Scholar]
- 44. Hirst A, Knight C, Hirst M, et al. Tramadol and the risk of fracture in an elderly female population: a cost utility assessment with comparison to transdermal buprenorphine. Eur J Health Econ 2015; 10: 1–11. [DOI] [PMC free article] [PubMed] [Google Scholar]
- 45. Stubbs B, Eggermont L, Patchay S, et al. Older adults with chronic musculoskeletal pain are at increased risk of recurrent falls and the brief pain inventory could help identify those most at risk. Geriatr Gerontol Int 2014; 15(7): 881–888. [DOI] [PubMed] [Google Scholar]
- 46. Stubbs B, Schofield P, Binnekade T, et al. Pain is associated with recurrent falls in community-dwelling older adults: evidence from a systematic review and meta-analysis. Pain Med 2014; 15(7): 1115–1128. [DOI] [PubMed] [Google Scholar]
- 47. All Wales Medicines Strategy Group. National prescribing indicators, http://www.awmsg.org/medman_cepp.html (accessed December 2017).
- 48. Fishbain DA, Cutler R, Rosomoff HL, et al. Chronic pain-associated depression: antecedent or consequence of chronic pain? A review. Clin J Pain 1997; 13(2): 116–137. [DOI] [PubMed] [Google Scholar]
- 49. Emptage NP, Sturm R, Robinson RL. Depression and comorbid pain as predictors of disability, employment, insurance status, and health care costs. Psychiatr Serv 2005; 56(4): 468–474. [DOI] [PubMed] [Google Scholar]
- 50. Merrill JO, Korff Von M, Banta-Green CJ, et al. Prescribed opioid difficulties, depression and opioid dose among chronic opioid therapy patients. Gen Hosp Psychiatry 2012; 34(6): 581–587. [DOI] [PMC free article] [PubMed] [Google Scholar]
- 51. Scherrer JF, Salas J, Copeland LA, et al. Increased risk of depression recurrence after initiation of prescription opioids in noncancer pain patients. J Pain 2016; 17(4): 473–482. [DOI] [PMC free article] [PubMed] [Google Scholar]
- 52. Scherrer JF, Salas J, Sullivan MD, et al. The influence of prescription opioid use duration and dose on development of treatment resistant depression. Prev Med 2016; 91: 110–116. [DOI] [PMC free article] [PubMed] [Google Scholar]
- 53. Smith K, Mattick RP, Bruno R, et al. Factors associated with the development of depression in chronic non-cancer pain patients following the onset of opioid treatment for pain. J Affect Disord 2015; 184: 72–80. [DOI] [PubMed] [Google Scholar]
- 54. Mordecai L, Reynolds C, Donaldson LJ, et al. Patterns of regional variation of opioid prescribing in primary care in England: a retrospective observational study. Br J Gen Pract 2018; 68(668): e225–e233. [DOI] [PMC free article] [PubMed] [Google Scholar]
- 55. Chevalier P, Smulders M, Chavoshi S, et al. A description of clinical characteristics and treatment patterns observed within prescribed opioid users in Germany and the UK. Pain Manag 2014; 4(4): 267–276, https://www.futuremedicine.com/doi/full/10.2217/pmt.14.26?url_ver=Z39.88-2003&rfr_id=ori%3Arid%3Acrossref.org&rfr_dat=cr_pub%3Dpubmed [DOI] [PubMed] [Google Scholar]
- 56. Keyes KM, Cerdá M, Brady JE, et al. Understanding the rural-urban differences in nonmedical prescription opioid use and abuse in the United States. Am J Public Health 2014; 104(2): e52–e59. [DOI] [PMC free article] [PubMed] [Google Scholar]
- 57. White House Health Factsheet, https://www.whitehouse.gov/briefings-statements/president-donald-j-trump-taking-action-drug-addiction-opioid-crisis/ (accessed December 2017).
- 58. Brady JE, Giglio R, Keyes KM, et al. Risk markers for fatal and non-fatal prescription drug overdose: a meta-analysis. Inj Epidemiol 2017; 4(1): 24. [DOI] [PMC free article] [PubMed] [Google Scholar]
- 59. Jones KH, Ford DV, Jones C, et al. A case study of the Secure Anonymous Information Linkage (SAIL) gateway: a privacy-protecting remote access system for health-related research and evaluation. J Biomed Inform 2014; 50: 196–204. [DOI] [PMC free article] [PubMed] [Google Scholar]
- 60. Williams T, van Staa T, Puri S, et al. Recent advances in the utility and use of the General Practice Research Database as an example of a UK primary care data resource. Ther Adv Drug Saf 2012; 3(2): 89–99. [DOI] [PMC free article] [PubMed] [Google Scholar]
- 61. Herrett E, Thomas SL, Schoonen WM, et al. Validation and validity of diagnoses in the General Practice Research Database: a systematic review. Br J Clin Pharmacol 2010; 69(1): 4–14. [DOI] [PMC free article] [PubMed] [Google Scholar]
- 62. Mabotuwana T, Warren J, Harrison J, et al. What can primary care prescribing data tell us about individual adherence to long-term medication?-comparison to pharmacy dispensing data. Pharmacoepidemiol Drug Saf 2009; 18(10): 956–964. [DOI] [PubMed] [Google Scholar]
- 63. Hoven JL, Haaijer-Ruskamp FM, Vander Stichele RH. Indicators of prescribing quality in drug utilisation research: report of a European meeting (DURQUIM, 13-15 May 2004). Eur J Clin Pharmacol 2004; 60(11): 831–834. [DOI] [PubMed] [Google Scholar]
- 64. Els C, Jackson TD, Kunyk D, et al. Adverse events associated with medium- and long-term use of opioids for chronic non-cancer pain: an overview of Cochrane Reviews. Cochrane Database Syst Rev 2017; 10(10): CD012509. [DOI] [PMC free article] [PubMed] [Google Scholar]
- 65. Blanch B, Pearson S-A, Haber PS. An overview of the patterns of prescription opioid use, costs and related harms in Australia. Br J Clin Pharmacol 2014; 78(5): 1159–1166. [DOI] [PMC free article] [PubMed] [Google Scholar]
- 66. Franklin GM, Rahman EA, Turner JA, et al. Opioid use for chronic low back pain: a prospective, population-based study among injured workers in Washington state, 2002-2005. Clin J Pain 2009; 25(9): 743–751. [DOI] [PubMed] [Google Scholar]
- 67. Webster LR. Chronic pain and the opioid conundrum. Anesthesiol Clin 2016; 34(2): 341–355. [DOI] [PubMed] [Google Scholar]
- 68. Leung PTM, Macdonald EM, Stanbrook MB, et al. A 1980 letter on the risk of opioid addiction. N Engl J Med 2017; 376(22): 2194–2195. [DOI] [PubMed] [Google Scholar]
- 69. Raghavan S, Harvey AD, Humble SR. New opioid side effects and implications for long-term therapy. Trends Anaesth Crit Care 2011; 1(1): 18–21. [Google Scholar]
- 70. Dowell D, Haegerich TM, Chou R. CDC guideline for prescribing opioids for chronic pain – United States, 2016. JAMA 2016; 315: 1624–1645. [DOI] [PMC free article] [PubMed] [Google Scholar]
- 71. Faculty of Pain Medicines, Royal College of Anaesthetists. Opioids aware: a resource for patients and healthcare professionals to support prescribing of opioid medicines for pain, https://www.fpm.ac.uk/faculty-of-pain-medicine/opioids-aware
- 72. Victor TW, Alvarez NA, Gould E. Opioid prescribing practices in chronic pain management: guidelines do not sufficiently influence clinical practice. J Pain 2009; 10(10): 1051–1057. [DOI] [PubMed] [Google Scholar]
- 73. NHS Scotland Effective Prescribing and Therapeutics. Quality prescribing for chronic pain, https://www.therapeutics.scot.nhs.uk/wp-content/uploads/2018/03/Strategy-Chronic-Pain-Quality-Prescribing-for-Chronic-Pain-2018.pdf (accessed March 2018).