Abstract
Background:
In radiotherapy, low-energy photon beams are better adapted to the treated volume, and the use of high-energy beams can reduce hot spots in the radiation therapy. Therefore, mixing low and high energies with different ratios can control the rate of hotspots, as well as the dose distribution of the target volume.
Material and Methods:
The percentage depth doses (PDDs) were calculated at various depths, by using a fitted double exponential equation. Then, using quality factor equation and PDD of a 10×10 cm2 field, the amount of energy equivalent to each PDD and the value of weighting factors of 6, 18 MV energies were calculated to produce different energies. To validate the mathematical model, dosimetry of 10 MV energy was used. For this purpose, PDDs and dose Profile of 10 MV obtained from the mix were compared with ones obtained from the measurement
Results:
The value of weighting factor of 6 MV energy required for the 10 ×10 cm2 field to create dose distribution of 15 MV energy using 6 and 18 MV energies was obtained as equal to 0.57. Comparison of percentage depth dose curves and dose profile shows good agreement with the practical measurements of 10 MV for 10×10 cm2 field using gamma index.
Conclusion:
The simultaneous use of high and low photon energies with different weighting factors to achieve desirable energy makes possible the treatment of tumors located at various depths without the need for different modes of energy in the accelerator leading to a decrease in the cost of the equipment and a safer treatment of the cancerous patients.
Keywords: Percentage Depth Dose , Weighting Factors , Mathematical Model , Dose Profile
Introduction
The use of high-energy photons is considered as the most common method in the radiation therapy of tumors [1]. Tumors that are undergoing radiation therapy may be superficial or deep. Photon beams with a relatively low energy used to treat the superficial tumors (<10 MV) are better adapted to the target volume due to reduced lateral electron distribution. High-energy photon beams applied to treat deep tumors have a high penetrating power and protect the skin [2]. The use of high-energy beams is a practical way to reduce hot spots in the radiation therapy. However, subcutaneous tissues that are in the buildup region do not receive enough doses [3,4].
The dose distribution is affected from the incident photon energy. Therefore, it is essential to use the most appropriate incident photon energy to achieve an optimal treatment plan [5]. The idea of mixing different energies was raised initially in 1995 by Steeves et. al. They proposed mixing electron and photon beams to achieve the optimal dose distribution. Their approach led to better dose distribution and fewer acute and chronic skin complications compared to the traditional method in which used photon beams for patients with breast cancer after mastectomy [6]. Park et. al. showed mixing the electron and photon beams in IMRT plan led to total dose reduction outside the target volume for prostate cancer. They also showed that a mix of low and high-energy photon beams can improve the specifications of the beam dosimetry in the treatment planned to treat deep tumors [2].
The radiation therapy equipment (common accelerators) has some limitations in terms of providing multiple energies for the treatment of tumors located at different depths, and adding the ability to produce multiple photon energies to the accelerators will impose high costs on radiotherapy centers. In this study, the weighting factors for the production of intermediate energies by mixing two 6 and 18 MV photon energy modes have been presented, so that other photon energies can be achieved by utilizing this method.
Material and Methods
Dosimetry
In this study, Elekta Precise with 6, 10, and 18 MV photon energies with dose rate of 300 MU/min was used. Blue phantom with the dimensions of 50×50×50 cm3 manufactured by the IBA Welhofer Company and the Farmer 0.6 cc ionization chamber were also used. The percentage depth doses (PDDs) were measured for 6, 10, and 18 MV with source-surface distance (SSD) of 100 cm for 5×5 to 40×40 cm2 fields.
Analytical Theory and Computations
At first according to previous study [7] a double exponential function was fitted to the PDD curves resulted from dosimetry of 6 and 18 MV for different radiation fields of 5×5 to 40×40 cm2 (R2> 0.95) (Eq. 1).
(1)
Where independent variables z and l represent the depth and field size for each energy, respectively. Coefficients a, b, c and d are functions which depend on the linac type, the field size, and the photon energy. The curve fitting toolbox of MATLAB software version 7 was employed in this study.
The PDD curves of 6 and 18 MV were mixed with different weighting factors (α) for each field. The Eq.2 was derived after normalization.
(2)
According to the idea of LaRivere [8], the quality of a photon beam in MV can be calculated as follows:
(3)
Where PDD(10, 10×10,100) is the percentage depth dose measured at 10 cm depth in a 10×10 cm2 field with SSD =100 cm. The Eq.3 can be used to calculate the beam quality (Q) by determined PDD(10,10×10,100) for 6 and 18 MV mixed energies.
To achieve any desired quality (Q), a program was written to calculate the PDD(10,10×10,100) at first as PDDQ (Eq.4).
(4)
Using an iterative loop and the regular change of α coefficient from 0 to 1, PDDmixed(10×10,100) was calculated and normalized. Then PDD at the depth of 10 cm was extracted as PDDmixed and compared with PDDQ at each time of the loop running. The program continued until the difference between the PDDmixed and PDDQ was minimized. In other words:
(5)
In addition, the calculated α coefficient for each quality Q was employed to obtain the dose profile at any depth for 10×10 cm2 field.
Validation
To validate this method, PDD and dose profile of 10 MV obtained from mixed and measured for a 10×10 cm2 field were compared using gamma-index (2%, 2 mm) criteria. Since generally rectangular fields are used clinically, the calculated weighting factor for 10×10 cm2 was applied to produce the PDD for 10 MV and field sizes of 5×5, 8×8, 15× 15, 20×20, 30×30 and 35×35 cm2. Afterwards, the results were compared with the PDDs achieved by dosimetry.
To further evaluation, the dosimetric characteristics including PDD10 cm, dmax, d80%, and d50% were compared with the results of the other studies for some energies between 6 and 18 MV.
Results
Coefficients a, b, c and d computed using the double exponential equation (Eq. 1) for the 6 and 18 MV and the considered fields have been shown in Table 1.
Table 1.
Constant coefficients related to Eq.1 for 5×5, 8×8, 10×10, 15×15, 20×20, 30×30 and 35×35 cm2 fields.
| L×L (cm2) | 6 MV | 18 MV | ||||||
|---|---|---|---|---|---|---|---|---|
| a | b | c | d | a | b | c | d | |
| 5×5 | 117.3 | -0.06 | -80.8 | -1.43 | 125.8 | -0.05 | -110.9 | -0.81 |
| 8×8 | 115.6 | -0.05 | -75.88 | -1.46 | 122 | -0.05 | -102.6 | -0.87 |
| 10×10 | 114.7 | -0.05 | -71.34 | -1.53 | 120.2 | -0.05 | -96.2 | -0.92 |
| 15×15 | 113.8 | -0.05 | -68.35 | -1.51 | 118.2 | -0.04 | -89.18 | -0.96 |
| 20×20 | 112.4 | -0.05 | -62.41 | -1.54 | 116.2 | -0.04 | -79.90 | -1.033 |
| 30×30 | 111.2 | -0.04 | -53.91 | -1.60 | 114.5 | -0.04 | -69.70 | -1.07 |
| 35×35 | 111.1 | -0.04 | -51.37 | -1.58 | 114.4 | -0.04 | -67.44 | -1.07 |
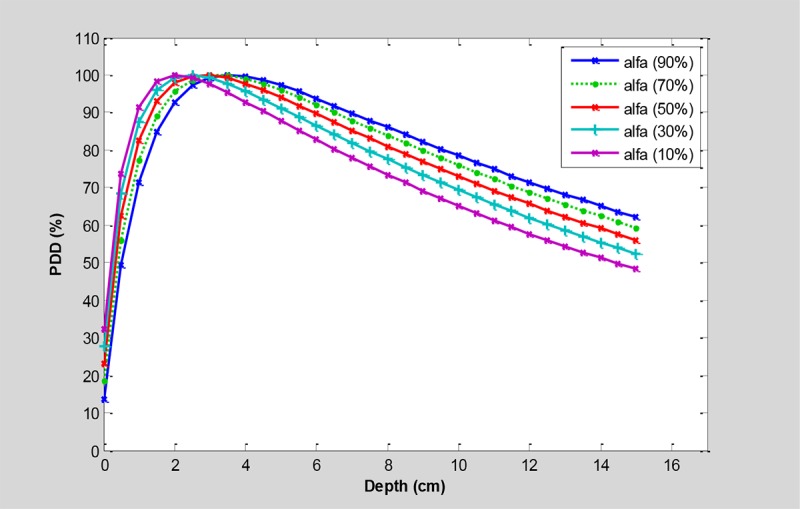
The mix of 6 and 18 MV photon energies with different weighting factors and 20% increments for the 10×10 cm2 field has been presented in Figure 1.
Figure1.

The PDDs for mixing the 6 and 18 MV photon beams in a 10×10 cm2 field with different weighting factors (α) and 20% increments of weighting factors.
Table 2 presents the values of weighting factors calculated to achieve different energies between the 6 and 18 MV for a 10×10 cm2 field.
Table 2.
The calculated weighting factors to achieve different energies between the 6 and 18 MV for a 10×10 cm2 field.
| Q (MV) | 6 | 8 | 9 | 10 | 15 | 18 |
|---|---|---|---|---|---|---|
| α% by 6 MV | 1 | 0.79 | 0.68 | 0.57 | 0.07 | 0 |
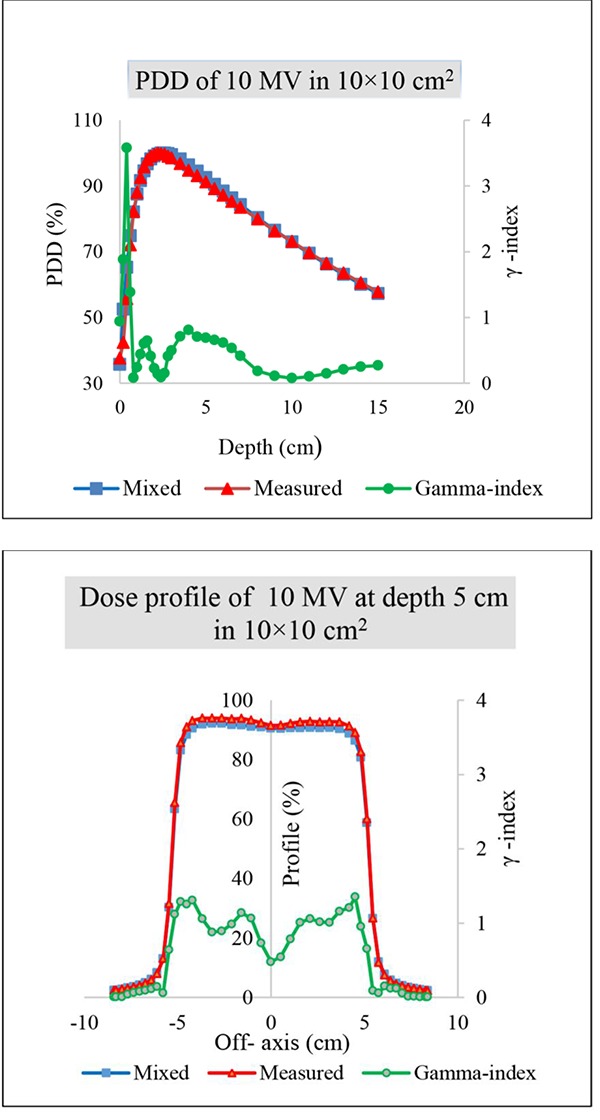
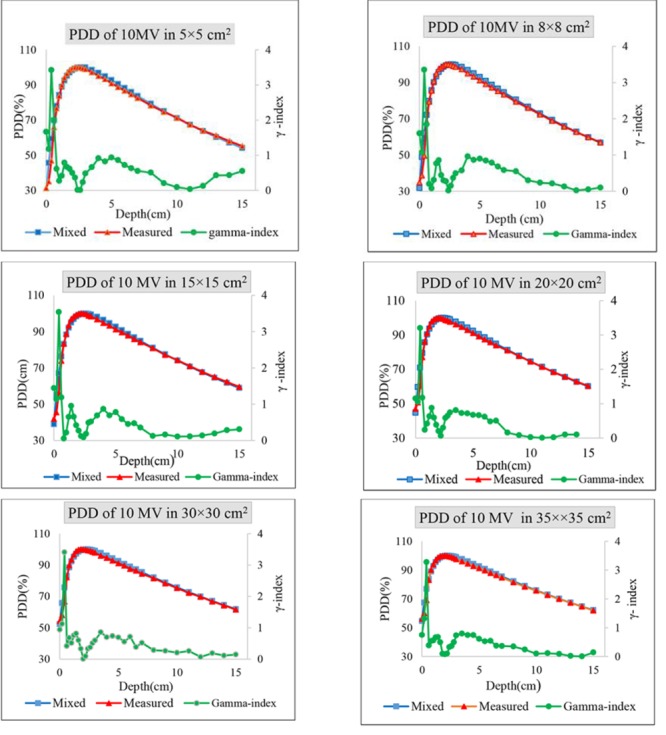
To create a dose distribution of 10 MV using a mix of 6 and 18 MV, the weighting factor α needed for the 10×10 cm2 field was obtained as equal to 0.57. Figure 2 illustrates the comparison of the PDD and dose profile of 10 MV resulted from the computational method with the PDD and dose profile resulted from dosimetry. The comparison of calculated and measured PDDs of 10 MV for different fields are shown in Figure 3.
Figure2.

comparison of calculated (weighing factor α=0.43) and measured PDDs and dose profile of 10 MV in a 10×10 cm2 field.
Figure3.

The comparison of calculated (weighing factor α=0.43 ) and measured PDDs of 10 MV for 5×5, 8×8, 15×15, 20×20, 30×30, and 35×35 cm2.
Discussion
Appropriate selection of energy for radiation therapy plays an important role in delivering the optimized treatment to the target volume. Since the limited number of energy modalities can attenuate the ability to access high efficiency treatments, in this study, a new method based on simultaneous use of high and low energy advantages was presented to obtain the dose distribution corresponding to the quality of energy in radiation treatments.
As shown in Figure 1, the less weighting factor of 6 MV, thus the increased portion of 18 MV makes the deeper maximum dose followed by the skin sparing effect. The equivalent energy to the combination of both energies can be calculated by using Eq. 3 according to the Table 2.
Comparison of percentage depth dose curves and also dose profile shows good agreement with the practical measurements of 10 MV for 10×10 cm2 field using gamma index. The differences are found with γ<1 except the points located at the depth of less than 5 mm in buildup region and close to geometrical field edges for profile dose. The deviations may be due to the dosimetric measurement errors which occur in high gradient doses.
Due to unviability of the Q value for different field sizes, the weighting factors calculated for standard field were employed to produce the PDDs for the other fields and the results were compared with measurements. As can be seen in Figure 3, the results are similar to 10×10 cm2 field. For further investigations, dosimetric characteristics including PDD10cm, dmax, d80% and d50% were compared with the previous studies (refer to Table 3. Estimations of PDD10 cm only showed less than 1% differences compared to the results of Wang et al. [9] Maximum and minimum differences were observed for 12 MV and 8 MV with 0.09% and 0.92%, respectively. Differences for dmax and d80% did not show more than 1mm and 2 mm. In addition, the results of d50% were considered in comparison with Buzdar et al. Considerations demonstrated 1-5 mm differences in depth. Accordingly Use of suitable weighting factors determined for 6 and 18 MV photon energies can result the same dose distributions as the other requirement qualities for different depths of tumor.
Table 3.
The results of the dosimetric characteristics including PDD10 cm, dmax, d80% and d50% comparison with the other studies.
| Q (MV) | PDD10 cm (%) | dmax (cm) | d80% (cm) | d50% (cm) | ||||||||
|---|---|---|---|---|---|---|---|---|---|---|---|---|
| I | II | Diff | I | II | Diff | I | II | Diff | I | II | Diff | |
| 6 | 67.1 | 67 ± 0.2 | 0.1 | 2.2 | 2.2 ± 0.2 | 0 | 6.8 | 6.7 ± 0.2 | 0.1 | 15.1 | 15.6 | 0.5 |
| 8 | 70.3 | 71 ± 0.2 | 0.9 | 2.4 | 2.5 ± 0.2 | 0.1 | 7.3 | 7.5 ± 0.2 | 0.2 | 16.9 | 17.2 | 0.3 |
| 10 | 72.9 | 73 ± 0.2 | 0.2 | 2.7 | 2.8 ± 0.2 | 0.1 | 8.1 | 8.0 ± 0.2 | 0.1 | 17.9 | 18.0 | 0.1 |
| 12 | 74.9 | 75 ± 0.2 | 0.1 | 3.0 | 3.0 ± 0.2 | 0.0 | 8.5 | 8.5 ± 0.2 | 0.0 | 18.9 | 19.0 | 0.1 |
| 15 | 77.5 | 77 ± 0.2 | 0.6 | 3.1 | 3.2 ± 0.2 | 0.1 | 9.2 | 9.2 ± 0.2 | 0.1 | 20.3 | 20.0 | 0.3 |
Conclusion
The results of this study indicate the possibility of mixing high and low photon energies with different weighting factors to achieve a desired energy for the treatment of tumors located at different depths. This method removes the need for accelerators with different modes of photon energy and leads to reduced cost and better results of treatment.
Acknowledgement
The authors of this paper tend to appreciate sincerely the personnel of the Radiotherapy and Oncology Department of karj, Mr. Hasan Hassani and the personnel of Ahvaz Golestan Hospital and Shahrekord Parsian Hospital, Mrs. Fariba Einy for their collaboration. In addition, they wish to thank Research Deputy of Ahvaz Jundishapur University of Medical Sciences for financing this research project (U-95066).
Conflict of Interest: None
References
- 1.Gustafsson A, Lind B K, Brahme A. A generalized pencil beam algorithm for optimization of radiation therapy. Med Phys. 1994;21:343–56. doi: 10.1118/1.597302. [DOI] [PubMed] [Google Scholar]
- 2.Park J M, Choi C H, Ha S W, Ye S J. The dosimetric effect of mixed-energy IMRT plans for prostate cancer. J Appl Clin Med Phys. 2011;12:3563. doi: 10.1120/jacmp.v12i4.3563. [ PMC Free Article] [DOI] [PMC free article] [PubMed] [Google Scholar]
- 3.Birgani M T, Fatahiasl J, Hosseini S M, Bagheri A, Behrooz M A, Zabiehzadeh M, et al. Breast Radiotherapy with Mixed Energy Photons; a Model for Optimal Beam Weighting. Asian Pac J Cancer Prev. 2015;16:7785–8. doi: 10.7314/apjcp.2015.16.17.7785. [DOI] [PubMed] [Google Scholar]
- 4.Lief E P, Hunt M A, Hong L X, Amols H I. Radiation therapy of large intact breasts using a beam spoiler or photons with mixed energies. Med Dosim. 2007;32:246–53. doi: 10.1016/j.meddos.2007.02.002. [DOI] [PubMed] [Google Scholar]
- 5.Khan F M, Gibbons J P. Khan’s the physics of radiation therapy: Lippincott Williams & Wilkins; 2014. [Google Scholar]
- 6.Steeves R A, Thomadsen B R, Hansen H, Phromratanapongse P, Paliwal B R. A practical alternative to conventional five-field irradiation postmastectomy for locally advanced breast cancer. Med Dosim. 1994;19:135–40. doi: 10.1016/0958-3947(94)90045-0. [DOI] [PubMed] [Google Scholar]
- 7.Tahmasbi B M, Karbalaei S. Calculation of analytical expressions for measured percentage depth dose data in megavoltage photon therapy. Iran Red Crescent Med J. 2009;11:140–4. [Google Scholar]
- 8.LaRiviere P D. The quality of high-energy X-ray beams. Br J Radiol. 1989;62:473–81. doi: 10.1259/0007-1285-62-737-473. [DOI] [PubMed] [Google Scholar]
- 9.Wong J R, Cheng C-W. Method for producing a range of therapeutic radiation energy levels. Google Patents; 2002. [Google Scholar]
- 10.Buzdar S A, Rao M A, Nazir A. An analysis of depth dose characteristics of photon in water. Journal of Ayub Medical College Abbottabad. 2009;21(4):41–5. [PubMed] [Google Scholar]


