
Fig. 2.
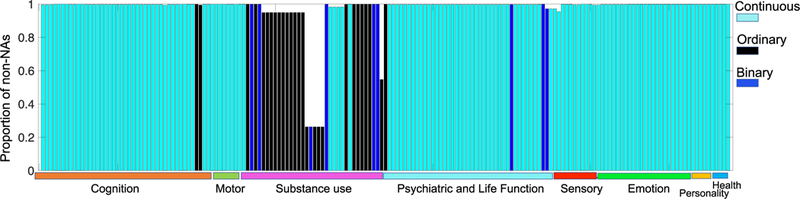
Plot of 175 selected trait measures. The y-axis indicates the proportion of non-NA values for each trait and the y-axis shows the types of traits.
Official websites use .gov
A
.gov website belongs to an official
government organization in the United States.
Secure .gov websites use HTTPS
A lock (
) or https:// means you've safely
connected to the .gov website. Share sensitive
information only on official, secure websites.
Plot of 175 selected trait measures. The y-axis indicates the proportion of non-NA values for each trait and the y-axis shows the types of traits.