

ABSTRACT
Photoreception is pivotal to our experience and perception of the natural world; hence the eye is of prime importance for most vertebrate animals to sense light. Central to visual health is mitochondrial homeostasis, and the selective autophagic turnover of mitochondria (mitophagy) is predicted to play a key role here. Despite studies that link aberrant mitophagy to ocular dysfunction, little is known about the prevalence of basal mitophagy, or its relationship to general autophagy, in the visual system. In this study, we utilize the mito-QC mouse and a closely related general macroautophagy reporter model to profile basal mitophagy and macroautophagy in the adult and developing eye. We report that ocular macroautophagy is widespread, but surprisingly mitophagy does not always follow the same pattern of occurrence. We observe low levels of mitophagy in the lens and ciliary body, in stark contrast to the high levels of general MAP1LC3-dependent macroautophagy in these regions. We uncover a striking reversal of this process in the adult retina, where mitophagy accounts for a larger degree of the macroautophagy taking place, specifically in the photoreceptor neurons of the outer nuclear layer. We also show the developmental regulation of autophagy in a variety of ocular tissues. In particular, mitophagy in the adult mouse retina is reversed in localization during the latter stages of development. Our work thus defines the landscape of mitochondrial homeostasis in the mammalian eye, and in doing so highlights the selective nature of autophagy in vivo and the specificity of the reporters used.
Abbreviations: ATG: autophagy related; GFP: green fluorescent protein; LC3: microtubule associated protein 1 light chain 3; ONH: optic nerve head; ONL: outer nuclear layer; RPE: retinal pigment epithelium.
KEYWORDS: Autophagy, ciliary body, cornea, eye, hyaloid, lens, mitochondria, mito-QC, mitophagy, retina
Introduction
Although general macroautophagy has been studied extensively in the context of nutrient deprivation, it has emerged that several types of autophagy exist to orchestrate cellular homeostasis. These include selective pathways that can degrade damaged or superfluous organelles via autophagy. Mitochondrial autophagy (mitophagy) is emerging as a key pathway in the regulation of mitochondrial network integrity [1–3]. Although the great majority of research has focused on mitophagy as an induced cellular stress-response to mitotoxic damage, recent studies describing mitophagy reporter mice have revealed the pervasive and basal nature of mammalian mitophagy in vivo [1,2]. Mitochondrial homeostasis is also critical for ocular health [4]. This is strongly evidenced by a variety of ophthalmic manifestations in both rare and common conditions, including inherited mitochondrial diseases, diabetic retinopathy and glaucoma, respectively [5–12]. Furthermore, disrupted autophagic signalling has been reported in a variety of ocular disease contexts (reviewed in [4]). Although macroautophagy has been studied in the mammalian eye since the late 1970’s [13], we still do not understand the extent of selective autophagy here. This is principally due to a lack of sensitive tools that enable comparative analysis of selective versus non-selective autophagy in vivo. Given the allure of dysregulated mitophagy as a contributor to a variety of disease states, it is important to understand the normal mitochondrial landscape of tissue and its mitophagic regulation in vivo.
Comprised of several unique tissues, the mammalian eye can be broadly classified into three distinct regions: the corneo-scleral, uveal and retinal layers. In this resource we focus on these regions, in particular on selected ocular structures of major clinical interest, where several studies have inferred the involvement of macroautophagy. Light enters the eye via the cornea, a refractive, transparent and avascular structure that focuses light on the retina. Defective autophagic flux is associated with genetic and damage-induced corneal pathology [14–16]. Posterior to the cornea lies the lens, another transparent and avascular tissue consisting of a unique tapestry of epithelial and fiber cells. In concert with the cornea, the lens functions to focus light on the retina [17,18]. Lens fiber cells are elongated structures that undergo a striking elimination of all membrane bound organelles as they mature. Although the consensus agrees the importance of autophagy as a cellular quality control mechanism in the developing and mature lens, its precise contribution to organelle elimination here remains unclear [4,17]. The retina is a constituent of the central nervous system, and a vascularised region of high-metabolic demand. Multiple studies have demonstrated the metabolic significance of general autophagy in the retina, and mitophagy is predicted to be particularly important regulator of retinal viability in health and disease [4].
Owing to the difficulty of studying the selective turnover of mitochondria in mammalian tissues, there has been an understandable lack of data on mitophagy in the retina and associated tissues of the eye. However, using our mito-QC mouse model [19], we have now been able to characterize mitophagy and mitochondrial network morphology in the adult and developing eye. Recently, we described the phenomenon of retinal mitophagy using mito-QC [20] and in the present study, we expand upon this initial description by characterizing the spatio-temporal regulation of mitochondrial homeostasis in the eye as a whole. We further extend this work by comparing the degree of mitophagy with that of general macroautophagy, by using a recently described autophagy reporter mouse based on the same principle, and generated in the same way, as mito-QC [19,20]. Surprisingly, high levels of mitophagy and general macroautophagy do not always coincide, highlighting the specificity of our reporter systems and demonstrating the selective nature of autophagy in vivo. Given the postulated contribution of mitochondrial dysfunction to many ophthalmological disorders, this resource should be of broad interest to vision researchers with an interest in mitochondrial biology, in addition to those studying the physiological implications of autophagy.
Results
In this Resource we follow the path of light through the eye and describe macroautophagy from the cornea to the optic nerve in adult and embryonic day 16.5 (E16.5) eyes. To reveal the nature and degree of macroautophagy in the eye, we utilized our previously characterized and validated mouse models that monitor mitophagy [19] and total macroautophagy [20]. Both models rely on similar transgenes expressed from the Rosa26 locus that utilize a tandem mCherry-GFP tag, either attached to the mitochondria through the outer membrane targeting region of FIS1 (amino acids 101-152); or the autophagosome itself through attachment to the N terminus of MAP1LC3B/LC3B (microtubule associated protein 1 light chain 3 beta). In these instances, when a mitochondrion or autophagosome undergoes lysosomal delivery, the acidic microenvironment is sufficient to quench the GFP signal, but not that from mCherry. Hence the degree of mitophagy or general macroautophagy can be determined from the appearance and number of mCherry-only foci (mito/autolysosomes) in tissue sections. The almost identical nature of these mouse models, combined with the fact that they were generated and bred in the same way, gives us a unique opportunity to determine the relative degree of mitophagy, with respect to general macroautophagy, occurring in vivo.
Comparative analysis of autophagy and mitophagy in the cornea
Often referred to as the ‘window of the eye’ the cornea is a transparent, avascular structure and accounts for 80% of the refractive power of the eye. Its fixed surface convexity enables images to be focused on the retina and an overview of the cornea is shown in Figure 1(a,b). The cornea consists of a stratified multicellular epithelium, a multi-lamellar collagenous stroma interlaced with keratocytes, a proteinaceous acellular layer (Descemet’s membrane) and a monolayer of inter-digitated secretory endothelial cells. Its anterior location means the cornea directly interfaces with the immediate environment, where it is exposed to myriad environmental stresses and serves as a protective barrier by absorbing UV-B light. Impaired autophagic flux and mitochondrial quality control in the cornea has been linked to granular corneal dystrophy type 2, Fuchs’ endothelial corneal dystrophy and non-nephropathic cystinosis [21–23]. Furthermore, impaired mitochondrial morphology and defective respiration has been observed in human corneal biopsies from diabetic patients [24]. Metabolic and classical electron microscopy-based studies have established the cornea as mitochondrially rich, and using eye cryosections from adult mito-QC mice, we were able to verify this (Figure 1(d)). Mitochondria in the epithelial layer appeared punctate and highly ordered, yet not as networked as those in the endothelial layer. Mitophagy, as evidenced by the appearance of mCherry-only puncta, was also apparent in both the epithelial and endothelial layers (Figure 1(c,d)). In contrast to mitophagy, there was a greater abundance of general autophagy as visualised in cryosections from mCherry-GFP-LC3 adult mice (Figure 1(c,e)). On comparing the 2 models, it would thus appear that mitophagy accounts for only a fraction of the total corneal macroautophagy. A strict quantitative comparison is challenging given that the dynamics of autophagosome fusion with lysosomes, as well as the relative reporter labelling of mitochondria vs. autophagosomes, would also need to be considered.
Figure 1.
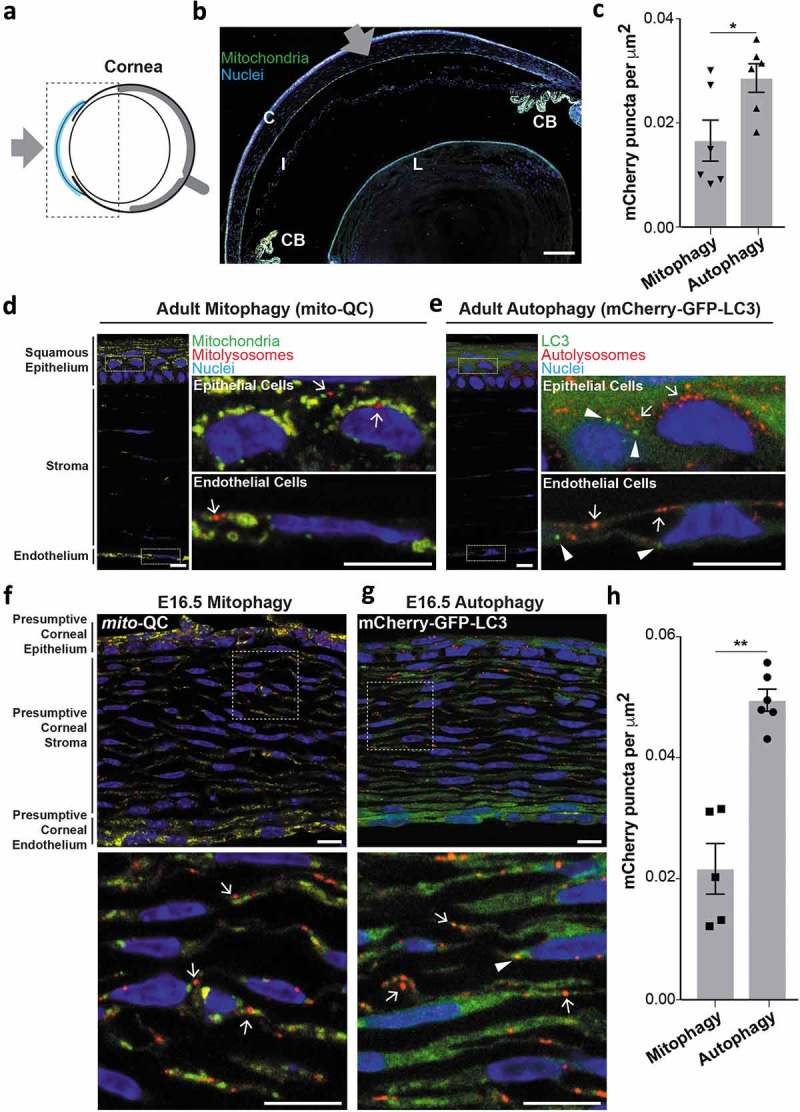
Basal mitophagy and macroautophagy in the cornea. (a) Schematic of the mouse eye depicting location of cornea in blue. Boxed area shown in panel (b). Gray arrow represents the light path i.e. direction of light entering the eye. (b) Overview micrograph of mito-QC eye section depicting cornea (C), iris (I), ciliary body (CB) and lens (L). Gray arrow represents light path. Scale bar: 100 μm. (c) Quantification of mCherry-only puncta from mito-QC (mitophagy) or mCherry-GFP-LC3 (autophagy) corneal eye sections. Data points are means from individual animals ±SEM (*P < 0.05 (0.0342)). (d) Representative mito-QC optical section showing mitophagy in the cornea. Boxed regions are shown magnified on the right and arrows mark instances of mitophagy defined by the presence of mCherry-only mitolysosomes. (e) Representative mCherry-GFP-LC3 section showing autophagy in the cornea. Boxed regions are shown magnified on the right and arrows mark examples of autolysosomes and arrowheads indicate presumptive autophagosomes. (f) Optical section detailing pronounced mitophagy in the mito-QC E16.5 corneal stroma. Boxed region is shown magnified below with arrows marking examples of mitolysosomes. (g) Optical section detailing autophagy in the mCherry-GFP-LC3 E16.5 corneal stroma. Boxed region is shown magnified below with autolysosomes (arrows) autophagosomes (arrowheads). (h) Quantification of mCherry-only puncta from mito-QC (mitophagy) or mCherry-GFP-LC3 (autophagy) E16.5 corneal eye sections. Data points are means from individual animals ±SEM (**P < 0.01 (0.0012)). Scale bars (panels d-g): 10 μm.
As in vivo mitophagy is a developmentally-regulated process [19] and in particular is important for retinal development [25], we next explored if this phenomenon occurs in the developing cornea. We thus examined the cornea in eye sections from embryonic mito-QC and mCherry-GFP-LC3 animals in more detail at E16.5. We observed a slight increase in corneal mitophagy compared to adult, which is likely accounted for by the increased number of developing stromal keratinocytes in the presumptive stromal region (Figure 1(f,h)). In contrast, corneal autophagy in general at E16.5 is increased by 60% compared to the adult cornea (Figure 1(g,h)). This period in development is coincident with the synthesis of many matrix molecules in the endothelium, and may represent the discovery of an unknown stage of metabolic adaption or remodelling in the mammalian eye [26]. Regardless, the differential changes in mitophagy versus general autophagy demonstrate the selective nature of mammalian autophagy in vivo and highlight the specificity of the reporters.
Mitophagy in the lens
The lens is a biconvex, avascular and translucent structure: thousands of anucleated fibers stretch between its anterior and posterior poles in a precise geometrical arrangement [27]. This unique form of the lens enables its function by facilitating the focus of light on the retina. Each fiber has the shape of a 6-sided prism and is highly enriched in crystallin proteins [17,28]. Lens fibers are tightly packed and enveloped by the lens capsule, connected by a suspensory ligament to the ciliary body. The anterior lens is covered by a cuboidal epithelium of nucleated cells, which merge with a proliferative layer at the equatorial margin (Figure 2(a,b)). Damage to lens epithelial or fiber cells (e.g. ionising radiation) or disrupted lens development can induce opacities that cause cataracts, estimated to account for 50% of global blindness [29]. Of relevance here, ATG5-dependent macroautophagy is essential to prevent cataractogenesis [17]. Despite extensive research on autophagy in the adult lens, little is known about mitochondrial network homeostasis in this structure. Interestingly, cryosections from adult mito-QC mice revealed little evidence of mitophagy in the adult lens fiber cells or in the lens epithelium (Figure 2(c,d)). The mito-QC signal was also sufficient to resolve the morphology of mitochondria in lens equatorial fibers (Figure 2(d,f)). 3D volume rendering of the equatorial region revealed highly elongated mitochondria, interspersed with smaller circular mitochondria, with the total mitochondrial density decreasing towards the central organelle-free zone (Figure 2(f)). Mitochondria of the lens epithelium were noticeably different in morphology, appearing more punctate and less networked than those in adjacent fiber cells (Figure 2(d)). The lack of mitophagy in the adult mouse lens contrasts with published descriptions of mitophagy and autophagy in the adult human lens [18]. However, as these studies relied upon electron microscopy, it is somewhat difficult to discern differences between mitophagy specifically over general autophagy. Consistent with this, cryosections from adult autophagy reporter mice showed pronounced autophagy in the lens epithelium, and to a lesser extent in fiber cells (Figure 2(c,e)). These data demonstrate that although LC3-dependent macroautophagy occured to a high degree in lens, the selective elimination of mitochondria by mitophagy proceeded at a much lower level. This scenario also appears to manifest during lens embryonic development at E16.5, with a low level of mitophagy compared to general macroautophagy in the lens epithelium (Figure 2(g,h)). Our work supports previously published data suggesting that organelle clearance during lens fiber development does not proceed via macroautophagy [30].
Figure 2.

Mitochondrial architecture, mitophagy and autophagy in the adult lens. (a) Schematic of the mouse eye depicting anatomical location of the lens in light blue. Boxed area is shown in panel (b) and gray arrow represents light path. (b) Overview photomicrograph of mito-QC eye section depicting the lens; LE, lens epithelium; Eq, equatorial region; OFZ, organelle-free zone; CB, ciliary body. Gray arrow, as in panel A. Scale bar: 100 μm. (c) Quantification of mCherry-only puncta from mito-QC (mitophagy) or mCherry-GFP-LC3 (autophagy) lens sections. Data points represent means from individual animals ±SEM (***P < 0.0001). (d) Upper left panel shows optical section of the adult lens equatorial region from a mito-QC mouse, below is magnified area of lens epithelium showing small spherical mitochondria and minimal mitophagy, with examples of mitolysosomes marked by arrows. Panel on right shows maximum Z-projection of lens optical slices. (e) Upper left panel shows optical section of the adult lens equatorial region from a mCherry-GFP-LC3 mouse, below is magnified area of lens epithelium with examples of autolysosomes marked by arrows and autophagosomes by arrowheads. Panel on right shows Z-projection of lens optical slices. (f) Isosurface render detailing mitochondrial network in mito-QC with lens epithelium on the left side of the panel (lateral to medial = left to right). Arrows denote examples of elongated mitochondria and arrowheads that of smaller solitary mitochondria. (g) Optical sections from E16.5 eyes detailing equatorial region (Eq), hyaloid vessels (HV) are also marked. Magnified epithelium sections are shown on the right, with arrows showing examples of mitolysosomes (top panel) and autolysosomes (bottom panel). Arrowheads mark autophagosomes. (h) Quantification of mCherry-only puncta from mito-QC (mitophagy) or mCherry-GFP-LC3 (autophagy) E16.5 lens sections. Data points represent means from individual animals ±SEM (***P < 0.0001). Scale bars (panels D-G): 10 μm.
In contrast, we did observe a high degree of mitophagy in the associated hyaloid vasculature proximal to the developing lens (Figure S1). Blood supply in the developing eye is sustained in utero by the formation of a transient intraocular circulatory system, known as the hyaloid vasculature. This dense vascular network irrigates the developing eye prior to the formation of the mature intraretinal vascular network [31]. The hyaloid network is characterised by the absence of a venous system, thus all hyaloid vessels are regarded as arterial in nature. The hyaloid network breaks down or regresses during mammalian development (postnatal period in mice, and during month 5 of human gestation – second trimester). Both WNT7B (Wnt family member 7B) paracrine signalling by macrophages and KDR/VEGFR2 (kinase insert domain receptor)-signalling by retinal neurons are known to contribute to hyaloid vessel regression in mammals [32–34]. The death of the hyaloid network correlates with the reciprocal maturation of the retina and lens, upon which the homeostatic support of the retina becomes fulfilled by its developing vascular network. Although general autophagy has been reported in this structure and previously suggested to regulate hyaloid vessel regression during development [35], the occurrence of selective autophagy in this structure remains unclear. In sections of E16.5 eyes, we observed pronounced autophagy and specifically mitophagy in hyaloid vasculature, likely at the beginning stages of their regression (Figure S1B). Using volume imaging and 3D rendering software, we were also able to profile mitochondrial morphology and mitophagy in these structures (Figure S1C and D). To our knowledge, this is the first demonstration of in vivo mitophagy that precedes a defined phase of vertebrate developmental apoptosis in mammals. Future studies will be essential to determine the physiological relevance of mitophagy pre-empting developmental apoptosis in this tissue, by a more systematic investigation during actual hyaloid regression. It is of note that we did not detect the presence of cleaved caspase 3, a marker of apoptosis, at this or neonatal stages (results not shown). However, hyaloid regression is known to be a complex process, driven by paracrine WNT7B macrophage-dependent clearance [32,33], with a contribution from KDR-dependent signalling by retinal neurons [34]. Our demonstration of mitophagy here is the first evidence for selective autophagy in this tissue in vivo. Incomplete hyaloid regression is associated with severe ocular pathology in humans, called persistent hyperplastic primary vitreous that manifests with severe intraocular haemorrhage, retinal detachment and cataract [36]. It will be interesting to assess if defective mitophagy plays a role in these diseases.
Mitophagy in the ciliary body
The unique spherical nature of the mammalian eye is governed by the existence of intraocular hydrostatic pressure [37]. Such pressure sustains the spherical integrity of the eye, and arises from the continual secretion of transparent aqueous humour produced by the ciliary body into the interior cavity. This flow facilitates metabolite exchange between cells of the cornea and lens. The ciliary body is highly vascularised with a considerable surface area for fluid secretion, owing to its unique topology of ciliary ridges covered by a ciliary epithelium [37], and its anatomy is well described ([38] and Figure 3(a,b)). Autophagy has been previously described in the ciliary body, yet mitochondrial biology here remains unexplored [39]. We found that mitochondria in the ciliary body appeared small, spherical and tightly compacted (Figure 3(d)). Surprisingly, we observed almost no mitophagy in these cells, contrasting to the much higher rate of general macroautophagy where autophagosomes and autolysosomes are abundant (Figure 3(c–e)). These observations suggest that basal autophagy may be an important regulator of ciliary body homeostasis and its dysfunction may be detrimental to cellular health. The most common ocular cancer in adults, uveal melanoma, can arise in the ciliary body [40], but the exact role autophagy plays here remains to be determined [41].
Figure 3.
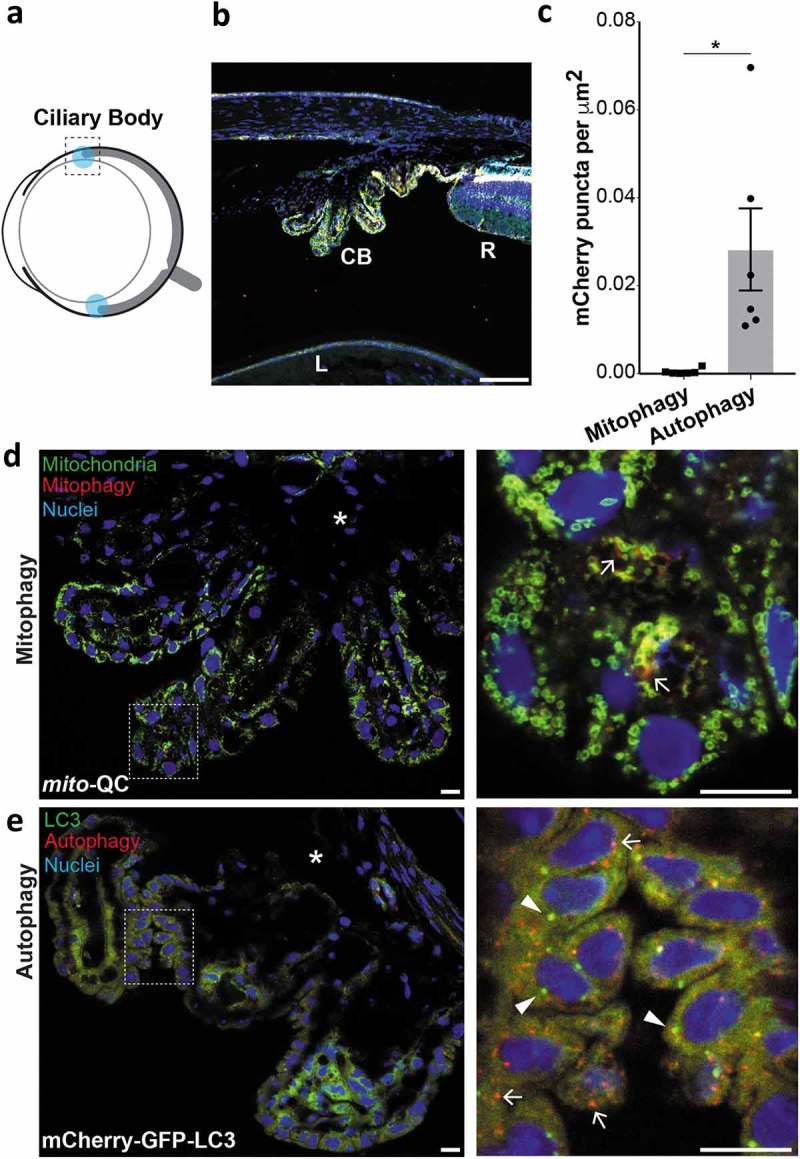
Mitophagy and macroautophagy in the ciliary body. (a) Schematic of the adult mouse eye depicting anatomical location of the ciliary bodies in light blue. (b) Optical section from mito-QC eye showing ciliary body (CB); peripheral retina (R); lens (L). Scale bar: 100 μm. (c) Quantification of mCherry-only puncta from mito-QC (mitophagy) or mCherry-GFP-LC3 (autophagy) ciliary body sections. Data points represent means from individual animals ±SEM (*P < 0.05 (0.031)). (d) Optical section from mito-QC eye detailing ciliary body. Boxed region is shown magnified on the right and arrows mark examples of mitolysosomes. Asterisk marks area of highly pigmented ciliary epithelium, with the pigment reducing the mCherry-GFP fluorescence. (e) Optical section from mCherry-GFP-LC3 eye detailing autophagy in the ciliary body. Boxed region is shown magnified on the right and arrows mark examples of autolysosomes and arrowheads autophagosomes. Asterisk marks area as in panel D. Scale bars: 10 μm.
Retinal mitophagy
The retina is a constituent of the central nervous system and regarded as one of the most metabolically active mammalian tissues [42,43] (Figure 4(a,b)). Its multi-layered structure facilitates photoreception and the conversion of light energy to neural information that is transduced via the optic nerve. For over 40 years, autophagy has been studied in the retina and has been implicated in its development, maintenance and degeneration [4]. Indeed, Atg5-dependent autophagy is essential for photoreceptor viability [44–47]. Furthermore, aberrant mitochondrial dysfunction has been suggested to contribute to retinal pathology [48,49]. In addition, autophagy is tightly regulated in the retina and follows circadian variation [50,51]. Moreover, dysfunctional autophagy is observed in several models of retinal dystrophies [52]. Thus, elucidating how this process is regulated here constitutes an important research area of translational significance. As mitochondria lie at the heart of metabolism, it is essential to understand how mitochondrial quality control is regulated in the retina. Though less work has been carried out in terms of retinal mitophagy, early electron microscopy studies clearly depicted evidence for mitochondria in autophagosomal structures, suggesting it is a relevant process [13,50]. Consistent with this, we previously demonstrated a striking enrichment of mitophagy in the retinal outer nuclear layer (ONL) [20]. To ascertain the degree of mitophagy compared to LC3-dependent macroautophagy, we compared retinal sections from mito-QC and mCherry-GFP-LC3 mice. Surprisingly, we observed a pronounced and very similar enrichment of both mitolysosomes and autolysosomes in the ONL of mito-QC and autophagy-reporter mice respectively (Figure 4(c–e)). This indicates that a significant amount of macroautophagy taking place in the ONL can be attributed to mitophagy, which makes this area by far the highest degree of mitophagy (relative to total macroautophagy) occurring in the eye. Notably, we cannot say this is exclusively mitophagy as lysosomal delivery of other autophagic cargo in conjunction with mitochondria may occur.
Figure 4.
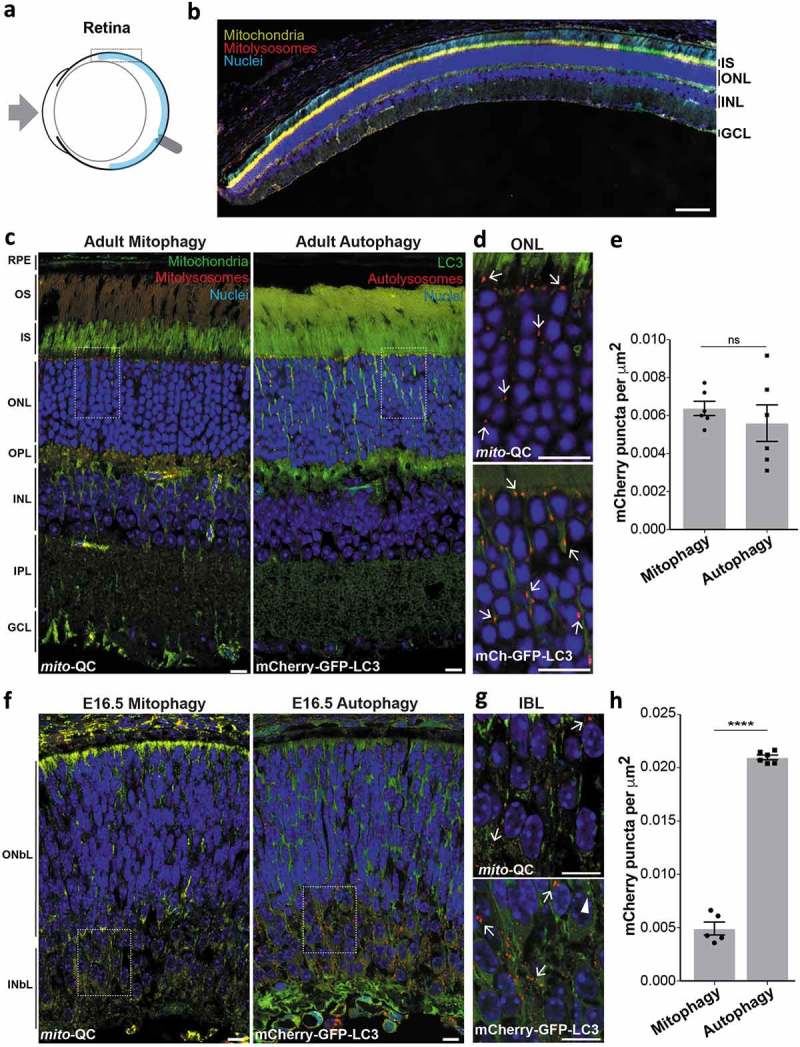
Mitophagy is highly localized to retinal photoreceptors. (a) Schematic of the mouse eye depicting anatomical location of the retina in light blue. Boxed region is shown in b. (b) Optical section from mito-QC retina: IS, inner segment; ONL, outer nuclear layer; INL; inner nuclear layer; GCL, ganglion cell layer. Scale bar: 100 μm. (c) Optical sections from mito-QC and mCherry-GFP-LC3 retina. Boxed regions are shown in panel D. RPE, retinal pigment epithelium; OS, outer segment; OPL, outer plexiform layer; IPL, inner plexiform layer. (d) Magnified section of ONL from mito-QC (top panel) or mCherry-GFP-LC3 adult retina (bottom panel). Arrows mark examples of mitophagosomes or autolysosomes. (e) Quantification of mCherry-only puncta from mito-QC (mitophagy) or mCherry-GFP-LC3 (autophagy) retinal sections, including all the layers shown in panel C. Data points represent means from individual animals ±SEM (ns = P > 0.05 (0.4772)). (f) Optical sections from mito-QC and mCherry-GFP-LC3 E16.5 retina. Boxed regions are shown in panel G. ONbL, outer neuroblast layer; INbL, inner neuroblast layer. (g) Magnified section of INbL from mito-QC (top panel) or mCherry-GFP-LC3 E16.5 retina (bottom panel). Arrows mark examples of mitophagosomes or autolysosomes and arrowhead indicates an autophagosome. (h) Quantification of mCherry-only puncta from mito-QC (mitophagy) or mCherry-GFP-LC3 (autophagy) E16.5 retinal sections. Data points represent means from individual animals ±SEM (***P < 0.0001). Scale bars (c-g): 10 μm.
To determine if retinal mitophagy is established during development we analyzed sections from E16.5 mito-QC eyes. In stark contrast to the adult eye, mitophagy at E16.5 appeared to be concentrated at a different level in the retina and was restricted to the inner neuroblast layer (Figure 4(f,g)). These data are consistent with recent findings that implicate programmed mitophagy as a developmental requirement of retinal ganglion cells, which are present within this region at this stage [25,53]. Also, in agreement with this study [25], there was much more general autophagy in the developing retina (Figure 4(f–h)). The level of macroautophagy was greater in the inner neuroblast layer, however unlike mitophagy, autolysosomes were also present throughout the retina including the outer neuroblast layer. Our in vivo data provide compelling support for the growing body of evidence that underscores the physiological significance of mitophagy and macroautophagy in mammalian retinal development.
Given the high degree of mitophagy present in the adult retinal ONL, we decided to investigate this further. The ONL contains the cell bodies of the photoreceptor neurons, with rod cells being the dominant type compared to cone cells (97% vs 3% respectively in mice [54]). To determine if mitophagy is restricted to one of these cell types we immunolabelled mito-QC cryosections using either anti-ARR3 (arrestin 3, retinal) antibodies to detect cones or anti-SAG/s-antigen visual arrestin antibodies to detect rods (Figure 5). ARR3 staining allowed visualization of entire cone cells including outer and inner segments as well as somata, axons and their termini. Importantly, mCherry-only puncta colocalized with ARR3, indicating that cone photoreceptors undergo mitophagy (Figure 5(a)). Isosurface rendering allowed us to visualise the spatial nature of mitophagy in these cells and showed that mitophagy is largely restricted to the soma, as we have seen in other neuronal cell types [19,20]. However, we did observe a higher frequency of axonal mitophagy compared to other regions of the CNS that we have previously published (Figure 5(a) – lower panels). As expected, staining with anti-SAG to mark rods revealed that this cell type is present in in much larger numbers (Figure 5(b)) and we were clearly able to identify significant numbers of mitolysosomes present here (Figure 5(b), lower panels).
Figure 5.
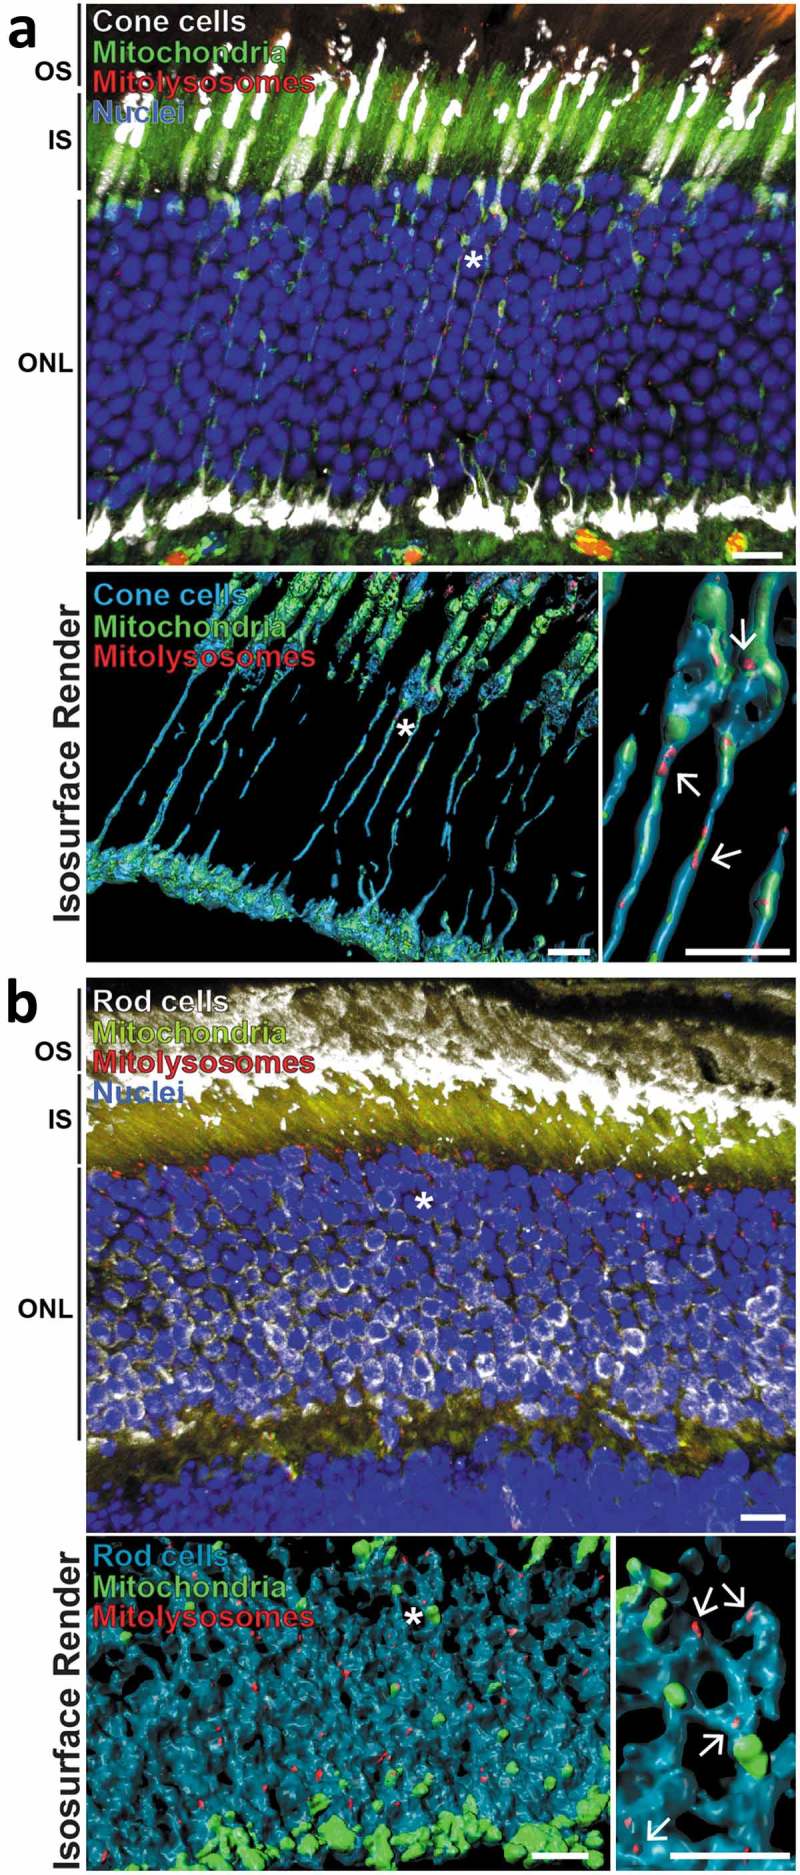
Mitophagy occurs in retinal photoreceptor neurons. (a) Z-projection showing adult mito-QC retinal outer nuclear layer (ONL) stained with antibodies against ARR3/cone arrestin (white, top panel). Inner segments (IS) and outer segments (OS) of the photoreceptor cells are also indicated. Lower left panel shows isosurface render of cone cells (cyan) from the above micrograph. Asterisk denotes cone projections magnified in lower right panel, arrows indicate mitolysosomes. Note presence of mitolysosomes in cone processes. (b) Z-projection of mito-QC retinal outer nuclear layer (ONL) and inner and outer photoreceptor cell segments (IS and OS respectively) stained with antibodies against SAG/visual arrestin to identify rod cells (white, top panel). Lower left panel shows isosurface render of rod somata (cyan) from the above micrograph. Asterisk denotes area of cells shown magnified in lower right panel and arrows mark mitolysosomes. Scale bars: 10 μm.
Mitophagy appears to be highly enriched in certain neuronal populations such as Purkinje cells [19] or dopaminergic neurons [20], as well as the photoreceptors shown here. The rich diversity of neuronal subtypes and connections in the retina facilitates parallel information processing. Bipolar and retinal amacrine cells transmit signals from the photoreceptor neurons to the retinal ganglion cells, which in turn transmit this information to the visual cortex via the optic nerve. The restrictive nature of mitophagy to the ONL suggests that these neurons do not undergo significant mitophagy and this was confirmed to be the case through immunolabelling of these retinal cells (Figure S2). It is not clear why these neuronal subtypes are markedly different in their rates of basal mitophagy to others, and future work will be vital to determine the cell-specific regulation of this process in the retina. It will be particularly interesting to determine if mitophagy is related to spectral sensitivity.
Autophagy is often thought of as an intracellular catabolic process; however, recent studies have provoked a reassessment of this assumption. In particular, mitophagy has been proposed to be enriched at the optic nerve head (ONH) in vivo, by a process known as axonal trans-mitophagy [2,55]. During this process, damaged neuronal mitochondria are extruded from axonal evulsions within the optic nerve head, and are degraded by neighboring glial cells in a lysosome-dependent fashion [55]. When we assessed mitophagy at the neuro-retinal interface in mito-QC animals, depicted in Figure 6(a), we did not observe a high level of mitophagy (Figure 6(b). To determine if there are glial cells here, we stained with anti-GFAP (glial fibrillary acidic protein), which marks the astrocytes present in this region. On the whole, little mitophagy was seen in these ONH astrocytes, though there was clear evidence for mitophagy occurring in some of the cells (Figure 6(b)). Whether this constitutes an example of transmitophagy, or conventional mitophagy remains to be determined.
Figure 6.
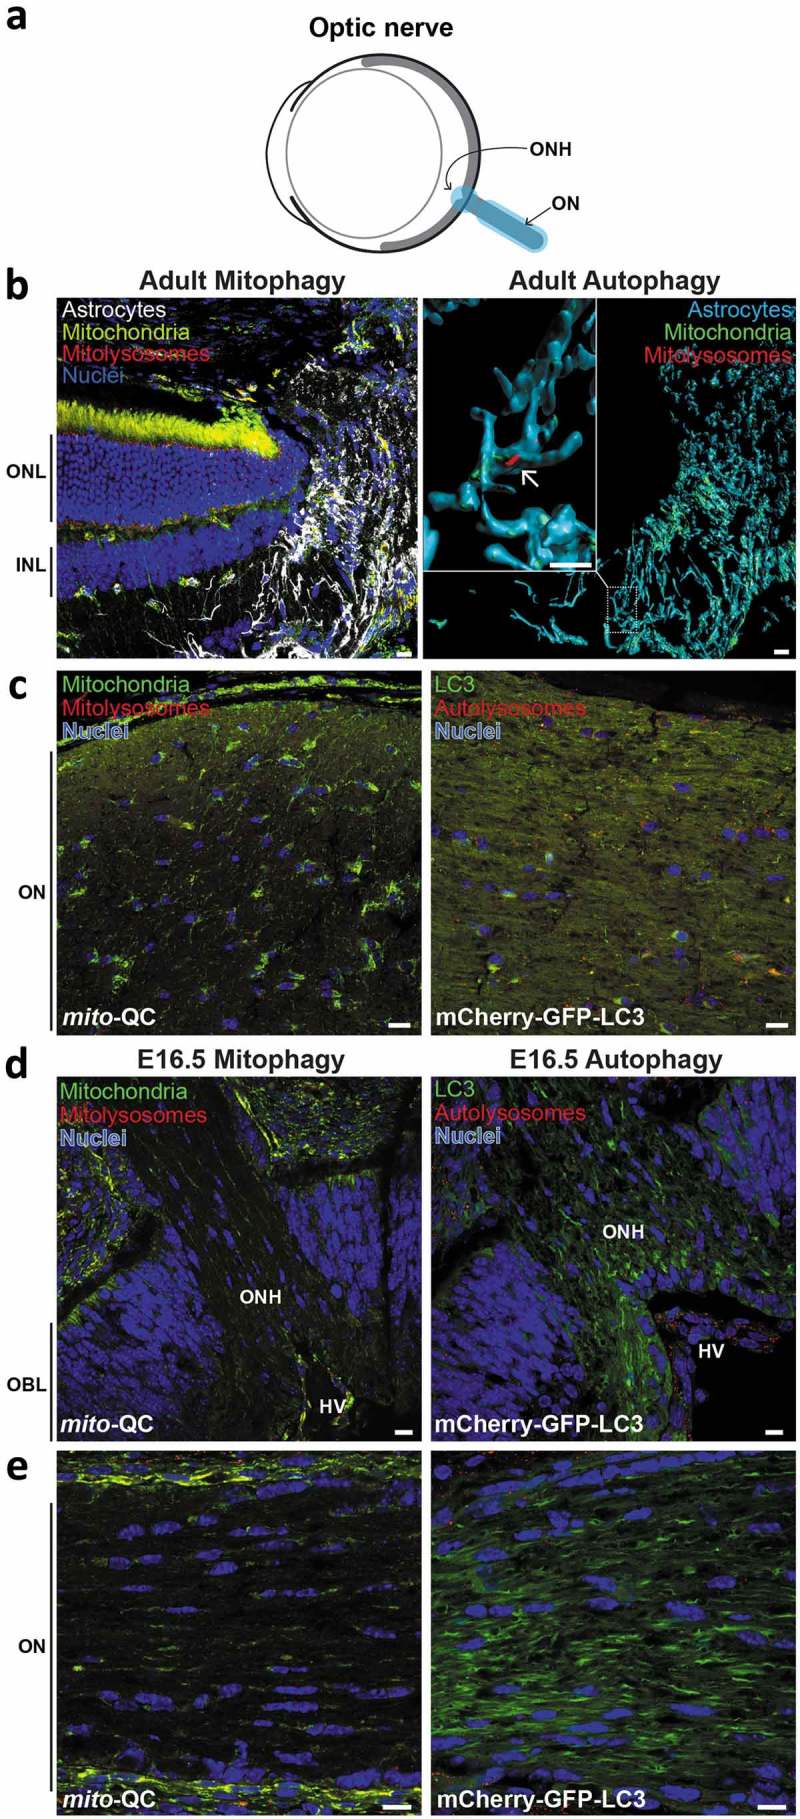
Minimal mitophagy and macroautophagy in the optic nerve. (a) Schematic of the mouse eye depicting anatomical location of the optic nerve in light blue. (b) Z-projection showing ONH of adult mito-QC eye, stained with anti-GFAP to mark astrocytes (white, left panel). Note retina on the left with outer nuclear layer (ONL) and inner nuclear layer (INL) marked. Right panel shows isosurface rendering of the ONH astrocytes (cyan) and boxed region is shown enlarged to the left. Mitolysosomes are sparse and the arrow indicates an example. (c) Optical section of ON from mito-QC (left panel) or mCherry-GFP-LC3 (right panel) eye. (d) Optical section of ONH from mito-QC (left panel) or mCherry-GFP-LC3 (right panel) E16.5 eyes. Outer neuroblast layer (OBL) of the developing retina is indicated. (e) Optical section of ON from mito-QC (left panel) or mCherry-GFP-LC3 (right panel) E15.5 eyes. Scale bars: 10 μm.
We also examined the optic nerve itself for mitophagy and general macroautophagy (Figure 6(c)). We observed almost no mitophagy and very little general autophagy here, but perhaps this is unsurprising given the axon-rich nature of this region and our previous observations of low axonal mitophagy [20]. This paucity of mitophagy and autophagy at the ONH and optic nerve was also present in E16.5 eyes (Figure 6(d,e)).
We also assessed mitophagy in the retinal pigment epithelium (RPE) in mito-QC mice. The RPE is the outermost layer of the retina and interfaces with the choroid membrane (Figure S3A). The RPE performs multiple critical functions that are essential for the visual cycle [56], and loss of autophagy in these cells leads to their degeneration [57]. Autophagy in the RPE has also been linked to age-related macular degeneration, highlighting its potential pathological importance in this region [58–60]. The RPE consists of a single layer of binucleated cells and by generating a 3D image from confocal sections, we were able to observe their unique hexagonal shape. These cells are rich in mitochondria, with a particular sub-plasmalemmal enrichment, and display a robust level of mitophagy in vivo, which can be clearly seen in isolated RPE (Figure S3C). It is interesting to note that these cells have been reported to undergo varying amounts of autophagy dependent on the day/night cycle and in particular undergo LC3-associated phagocytosis of shed photoreceptor outer segments [61]. While we previously detected no significant changes in retinal mitophagy at the end of the daily light or dark cycle [20], we were unable to reliable determine autophagy or mitophagy in the RPE in situ during this time course. We anticipate that future studies will address this.
Discussion
To our knowledge, this exploratory study constitutes the first comparative in vivo landscape of basal mitophagy and macroautophagy in a mammalian organ system. Here we have focussed on the mammalian eye because numerous studies have linked aberrant mitophagy and autophagy to ocular pathology, yet little is known about the spatiotemporal nature of these processes within this organ. Additionally, we could not find any study that assessed the basal status of mitophagy with respect to the levels of total macroautophagy. Our work has demonstrated that macroautophagy is a significant process within the eye, occurring to varying degrees within all regions analyzed. In contrast in the adult, the level of mitophagy varied to a greater degree, and in comparing both models, mitophagy accounted for a much smaller fraction of the macroautophagy in the ciliary body and the lens in contrast to the cornea and especially the retina. Of course, the mito-QC model only measures the endpointof mitophagy, i.e. selective delivery of mitochondria to lysosomes, and the precise pathways at play that mark mitochondria for destruction across the various tissues of the eye remain to be elucidated. It is thus possible that some of the mitophagy observed occurs via a non-classical LC3-independent route. Regardless, in using mito-QC to monitor mitophagy and mCherry-GFP-LC3 mice to monitor macroautophagy, these data support the emerging notion that mitophagy is a highly context-dependent process in vivo, and not merely a consequence of stress or non-selective general autophagy.
Although beyond the scope of this resource paper, several interesting questions arise from our exploratory observations, relating both to selective autophagy and mitochondrial homeostasis. Notably, why does mitophagy occur at such a low rate in the lens or ciliary body, despite pronounced levels of general autophagy? These data highlight the selectivity of LC3-dependent macroautophagy, as while organellophagy may occur, mitochondria are seemingly spared. Other questions relate to the fundamental metabolic nature of tissues within the same organ. For example, why is there a high turnover of mitochondria specifically in the retinal ONL? Could the heightened cellular activity and neural nature of photoreception confer a greater metabolic stress or demand, which in turn accounts for differences in mitophagy between the ONL compared to other retinal cell types? Further questions also abound, especially with respect to selective autophagy in vivo. Does the enrichment of LC3-dependent macroautophagy in some tissues, and reciprocal lack of mitophagy in others, imply that autophagy in these structures is non-selective? Our discovery of hyaloid vascular mitophagy in vivo also extends our knowledge of mitochondrial turnover in endothelial networks and of general mammalian development. Future studies will be vital to determine the sequence of events pertaining to mitophagy and programmed cell death in these structures, and other vasculature in the eye.
In summary, this exploratory study constitutes the first comparative landscape of mammalian mitophagy and macroautophagy in the developing and mature eye in vivo. We anticipate our data will provide a fruitful resource for discovery-based and translational researchers to pursue much needed in-depth studies on ocular autophagy and its relationship to health and disease in vivo.
Materials and methods
Animals
mito-QC mice were generated as previously described [19]. Autophagy reporter mice (mCherry-GFP-MAP1LC3B, referred to as mCherry-GFP-LC3) were generated in the same way as mito-QC using targeted transgenesis by TaconicArtemis GmbH as described [20]. Mice were maintained on a C57BL6/J background. Genotyping was performed by diagnostic end-point PCR using genomic DNA isolated from tissue biopsy specimens. WT and KO alleles were detected using KOD Hot Start DNA polymerase (EMD Millipore, 71086) and manufacturer-recommended conditions. All animal studies and breeding were approved by the University of Dundee ethical review committee, and further subjected to approved study plans by the Named Veterinary Surgeon and Compliance Officer (Dr. Ngaire Dennison) and performed under a UK Home Office project license in accordance with the Animal Scientific Procedures Act of 1986.
Histology & microscopy
Histology and microscopy were performed as previously described [19,20,45]. Briefly, mice were transcardially perfused with PBS (Gibco, 14190-094) and tissues were processed by immersion fixation in freshly prepared 3.7% formaldehyde (Sigma-Aldrich, P6148) at pH 7.0 in 0.2 M HEPES. For cryosectioning, eyes were cryoprotected in 30% (w:v) sucrose (VWR Chemicals, 27480.360) in PBS at 4°C before sectioning on a cryostat and counterstained with 1 µg/ml Hoechst (ThermoFisher Scientific, 62249).
For RPE isolation, the eyes were removed from the animal, and then the anterior eye portion was removed. The posterior eyecup was flattened after performing 4 incisions. The neural retina was separated from the RPE and the whole mount RPE was fixed for 16 h at 4ºC. DAPI (ThermoFisher Scientific, D1306) was used to counterstain the nuclei.
Vectashield (Vector Laboratories, H-1000) was used to mount tissue sections on slides before sealing with nail polish and a 1.5 glass coverslip.
Images were acquired using an LSM710 Multiphoton (Plan-Neofuar ×40 objective, NA 1.30; Plan Apochromat ×63 objective NA 1.4; Plan Apochromat ×20 objective, NA 0.8), or a LSM880 Airyscan microscope (ZEISS; Plan Apochromat ×63 objective, NA 1.4) and processed using ZEISS Zen Software/Adobe Photoshop or Imaris (Bitplane) for 3D Isosurface Rendering. Images were digitally altered within linear parameters, with minimal adjustments to levels and linear contrast applied to all images.
Immunohistochemistry
Eye cryosections were re-fixed with formaldehyde 3.7% (w:v) in 200 mM HEPES buffer, pH 7.0 for 15 min, followed by 3 5-min PBS washes with agitation at room temperature. Retinal sections were permeabilized with 1% (v:v) Triton X-100 (Sigma-Aldrich, T8787), in PBS and then blocked for 1 h with BGT (3 mg/mL BSA [Roche, 10735108001], 0.25% Triton X-100, 100 mM Glycine [VWR Chemicals, 0167] in PBS). Primary antibodies were incubated in BGT overnight at 4ºC. Secondary antibodies were incubated for 1 h at room-temperature in BGT and darkness. Nuclei were stained with DAPI (1 μg/mL) and cryosections were mounted with Vectashield. Antibodies used were: CALB1 (Sigma-Aldrich, C2724), PRKCA (Sigma-Aldrich, P4334), SNCG (Abnova, H00006623-M01), AIF1 (Wako, 019-19741), ARR3 (EMD Millipore, AB15282), GLUL (EMD Millipore, MAB302), SAG (Santa Cruz Biotechnology, sc-166383,), and GFAP (Dako, Z0334).
Data quantification
Data were quantified with Volocity 6.3 Image Analysis Software (PerkinElmer) using algorithms developed to analyze object overlap and count individual structures. For all analyses, we obtained images using uniform random sampling by an experimenter blind to all conditions. All images in each experimental group were processed as a batch using identical protocols. Images were first filtered to suppress noise (3x3 median filter) and a red/green intensity ratio channel was calculated. Similar analysis protocols were used for all eye regions. 1) The tissue was segmented using a fixed intensity threshold on the DAPI or green channel, followed by a fill holes operation and minimum size criterion. 2) To assess autophagy/mitophagy, objects were found in the red channel using mean intensity +n standard deviations (3 standard deviations for all tissues except the cornea, where the threshold was set at 2 standard deviations). Touching objects were separated using a guide size of 0.1 µm2. These objects were filtered according to a minimum red/green ratio value: 0.7 for all tissues except lens (1.0) and ciliary body (3.0). Differences in threshold values reflect the fact that expression levels and imaging settings were different between these eye regions. Finally, objects not overlapping with the tissue were excluded.
Statistical analyses
For pairwise statistical analyses of mitophagy vs. macroautophagy comparisons, unpaired, two-tailed t tests with Welch’s correction were carried out. Statistics and graphs were generated using Prism 7 (GraphPad Software Inc.). All graphs are depicted as scatter plots with the number of data points representing an individual animal subject.
Supplementary Material
Funding Statement
This work was funded by grants from the Medical Research Council, UK (IGG; MC_UU_12016/4) and the Ministerio de Ciencia, Innovación y Universidades (PB; PGC2018-098557-B-100). BVZ is supported by a fellowship from the Fundación Tatiana Pérez de Guzmán el Bueno. The Dundee Imaging Facility is supported by the ‘Wellcome Trust Technology Platform’ award (097945/B/11/Z).
Acknowledgments
We thank the support teams from biological resources and genotyping for husbandry and maintenance of mouse colonies
Disclosure statement
No potential conflict of interest was reported by the authors.
References
- [1].Rodger CE, McWilliams TG, Ganley IG.. Mammalian mitophagy: from in vitro molecules to in vivo models. FEBS J. 2018;285(7):1185–1202. [DOI] [PMC free article] [PubMed] [Google Scholar]
- [2].McWilliams TG, Muqit MM. PINK1 and parkin: emerging themes in mitochondrial homeostasis. Curr Opin Cell Biol. 2017;45:83–91. [DOI] [PubMed] [Google Scholar]
- [3].Kuma A, Komatsu M, Mizushima N. Autophagy-monitoring and autophagy-deficient mice. Autophagy. 2017;13(10):1619–1628. [DOI] [PMC free article] [PubMed] [Google Scholar]
- [4].Boya P, Esteban-Martínez L, Serrano-Puebla A, et al. Autophagy in the eye: development, degeneration, and aging. Prog Retin Eye Res. 2016;55:206–245. [DOI] [PubMed] [Google Scholar]
- [5].Burte F, Carelli V, Chinnery PF, et al. Disturbed mitochondrial dynamics and neurodegenerative disorders. Nat Rev Neurol. 2015;11(1):11–24. [DOI] [PubMed] [Google Scholar]
- [6].Kowluru RA, Mishra M. Oxidative stress, mitochondrial damage and diabetic retinopathy. Biochim Biophys Acta. 2015;1852(11):2474–2483. [DOI] [PubMed] [Google Scholar]
- [7].Kamel K, Farrell M, O’Brien C. Mitochondrial dysfunction in ocular disease: focus on glaucoma. Mitochondrion. 2017;35:44–53. [DOI] [PubMed] [Google Scholar]
- [8].Gill JS, Hardy SA, Blakely EL, et al. Pigmentary retinopathy, rod-cone dysfunction and sensorineural deafness associated with a rare mitochondrial tRNALys (m.8340G>A) gene variant. Br J Ophthalmol. 2017;101(9):1298–1302. [DOI] [PMC free article] [PubMed] [Google Scholar]
- [9].Al-Enezi M, Al-Saleh H, Nasser M. Mitochondrial disorders with significant ophthalmic manifestations. Middle East Afr J Ophthalmol. 2008;15(2):81–86. [DOI] [PMC free article] [PubMed] [Google Scholar]
- [10].Dombi E, Diot A, Morten K, et al. The m.13051G>A mitochondrial DNA mutation results in variable neurology and activated mitophagy. Neurology. 2016;86(20):1921–1923. [DOI] [PMC free article] [PubMed] [Google Scholar]
- [11].Liao C, Ashley N, Diot A, et al. Dysregulated mitophagy and mitochondrial organization in optic atrophy due to OPA1 mutations. Neurology. 2017;88(2):131–142. [DOI] [PMC free article] [PubMed] [Google Scholar]
- [12].Majander A, Bowman R, Poulton J, et al. Childhood-onset leber hereditary optic neuropathy. Br J Ophthalmol. 2017;101(11):1505–1509. [DOI] [PubMed] [Google Scholar]
- [13].Reme CE, Young RW. The effects of hibernation on cone visual cells in the ground squirrel. Invest Ophthalmol Vis Sci. 1977;16(9):815–840. [PubMed] [Google Scholar]
- [14].Meng H, Matthaei M, Ramanan N, et al. L450W and Q455K Col8a2 knock-in mouse models of Fuchs endothelial corneal dystrophy show distinct phenotypes and evidence for altered autophagy. Invest Ophthalmol Vis Sci. 2013;54(3):1887–1897. [DOI] [PMC free article] [PubMed] [Google Scholar]
- [15].Choi SI, Dadakhujaev S, Maeng Y-S, et al. Disrupted cell cycle arrest and reduced proliferation in corneal fibroblasts from GCD2 patients: a potential role for altered autophagy flux. Biochem Biophys Res Commun. 2015;456(1):288–293. [DOI] [PubMed] [Google Scholar]
- [16].Shetty R, Sharma A, Pahuja N, et al. Oxidative stress induces dysregulated autophagy in corneal epithelium of keratoconus patients. PLoS One. 2017;12(9):e0184628. [DOI] [PMC free article] [PubMed] [Google Scholar]
- [17].Morishita H, Mizushima N. Autophagy in the lens. Exp Eye Res. 2016;144:22–28. [DOI] [PubMed] [Google Scholar]
- [18].Costello MJ, Brennan LA, Basu S, et al. Autophagy and mitophagy participate in ocular lens organelle degradation. Exp Eye Res. 2013;116:141–150. [DOI] [PMC free article] [PubMed] [Google Scholar]
- [19].McWilliams TG, Prescott AR, Allen GFG, et al. mito-QC illuminates mitophagy and mitochondrial architecture in vivo. J Cell Biol. 2016;214(3):333–345. [DOI] [PMC free article] [PubMed] [Google Scholar]
- [20].McWilliams TG, Prescott AR, Montava-Garriga L, et al. Basal mitophagy occurs independently of PINK1 in mouse tissues of high metabolic demand. Cell Metab. 2018;27(2):439–449 e5. [DOI] [PMC free article] [PubMed] [Google Scholar]
- [21].Choi SI, Kim EK. Autophagy in granular corneal dystrophy type 2. Exp Eye Res. 2016;144:14–21. [DOI] [PubMed] [Google Scholar]
- [22].Kim EC, Meng H, Jun AS. Lithium treatment increases endothelial cell survival and autophagy in a mouse model of fuchs endothelial corneal dystrophy. Br J Ophthalmol. 2013;97(8):1068–1073. [DOI] [PMC free article] [PubMed] [Google Scholar]
- [23].Sansanwal P, Sarwal MM. Abnormal mitochondrial autophagy in nephropathic cystinosis. Autophagy. 2010;6(7):971–973. [DOI] [PMC free article] [PubMed] [Google Scholar]
- [24].Aldrich BT, Schlötzer-Schrehardt U, Skeie JM, et al. Mitochondrial and morphologic alterations in native human corneal endothelial cells associated with diabetes mellitus. Invest Ophthalmol Vis Sci. 2017;58(4):2130–2138. [DOI] [PubMed] [Google Scholar]
- [25].Esteban-Martinez L, Sierra-Filardi E, McGreal RS, et al. Programmed mitophagy is essential for the glycolytic switch during cell differentiation. Embo J. 2017;36(12):1688–1706. [DOI] [PMC free article] [PubMed] [Google Scholar]
- [26].Swamynathan SK. Ocular surface development and gene expression. J Ophthalmol. 2013;2013:103947. [DOI] [PMC free article] [PubMed] [Google Scholar]
- [27].Kuszak JR, Zoltoski RK, Sivertson C. Fibre cell organization in crystalline lenses. Exp Eye Res. 2004;78(3):673–687. [DOI] [PubMed] [Google Scholar]
- [28].Dahm R, van Marle J, Quinlan RA, et al. Homeostasis in the vertebrate lens: mechanisms of solute exchange. Philos Trans R Soc Lond B Biol Sci. 2011;366(1568):1265–1277. [DOI] [PMC free article] [PubMed] [Google Scholar]
- [29].Prokofyeva E, Wegener A, Zrenner E. Cataract prevalence and prevention in Europe: a literature review. Acta Ophthalmol. 2013;91(5):395–405. [DOI] [PubMed] [Google Scholar]
- [30].Matsui M, Yamamoto A, Kuma A, et al. Organelle degradation during the lens and erythroid differentiation is independent of autophagy. Biochem Biophys Res Commun. 2006;339(2):485–489. [DOI] [PubMed] [Google Scholar]
- [31].Saint-Geniez M, D’Amore PA. Development and pathology of the hyaloid, choroidal and retinal vasculature. Int J Dev Biol. 2004;48(8–9):1045–1058. [DOI] [PubMed] [Google Scholar]
- [32].Lang RA, Bishop JM. Macrophages are required for cell death and tissue remodeling in the developing mouse eye. Cell. 1993;74(3):453–462. [DOI] [PubMed] [Google Scholar]
- [33].Lobov IB, Rao S, Carroll TJ, et al. WNT7b mediates macrophage-induced programmed cell death in patterning of the vasculature. Nature. 2005;437(7057):417–421. [DOI] [PMC free article] [PubMed] [Google Scholar]
- [34].Yoshikawa Y, Yamada T, Tai-Nagara I, et al. Developmental regression of hyaloid vasculature is triggered by neurons. J Exp Med. 2016;213(7):1175–1183. [DOI] [PMC free article] [PubMed] [Google Scholar]
- [35].Kim JH, Kim JH, Yu YS, et al. Autophagy-induced regression of hyaloid vessels in early ocular development. Autophagy. 2010;6(7):922–928. [DOI] [PubMed] [Google Scholar]
- [36].Silbert M, Gurwood AS. Persistent hyperplastic primary vitreous. Clin Eye Vis Care. 2000;12(3–4):131–137. [DOI] [PubMed] [Google Scholar]
- [37].Delamere NA. Ciliary body and ciliary epithelium. Adv Organ Biol. 2005;10:127–148. [DOI] [PMC free article] [PubMed] [Google Scholar]
- [38].Tamm ER, Lutjen-Drecoll E. Ciliary body. Microsc Res Tech. 1996;33(5):390–439. [DOI] [PubMed] [Google Scholar]
- [39].Giatromanolaki AN, Charitoudis GS, Bechrakis NE, et al. Autophagy patterns and prognosis in uveal melanomas. Mod Pathol. 2011;24(8):1036–1045. [DOI] [PubMed] [Google Scholar]
- [40].Virgili G, Gatta G, Ciccolallo L, et al. Incidence of uveal melanoma in Europe. Ophthalmology. 2007;114(12):2309–2315. [DOI] [PubMed] [Google Scholar]
- [41].Chai P, Ni H, Zhang H, et al. The evolving functions of autophagy in ocular health: a double-edged sword. Int J Biol Sci. 2016;12(11):1332–1340. [DOI] [PMC free article] [PubMed] [Google Scholar]
- [42].Ames A 3rd, Li YY, Heher EC, et al. Energy metabolism of rabbit retina as related to function: high cost of Na+ transport. J Neurosci. 1992;12(3):840–853. [DOI] [PMC free article] [PubMed] [Google Scholar]
- [43].Wong-Riley MTT. Energy metabolism of the visual system. Eye Brain. 2010;2:99–116. [DOI] [PMC free article] [PubMed] [Google Scholar]
- [44].Gomez-Sintes R., Villarejo-Zori B., Serrano-Puebla A., et al. Standard assays for the study of autophagy in the ex vivo retina. Cells. 2017;6(4):37. [DOI] [PMC free article] [PubMed] [Google Scholar]
- [45].Rodriguez-Muela N, Koga H, García-Ledo L, et al. Balance between autophagic pathways preserves retinal homeostasis. Aging Cell. 2013;12(3):478–488. [DOI] [PMC free article] [PubMed] [Google Scholar]
- [46].Zhou Z, Doggett TA, Sene A, et al. Autophagy supports survival and phototransduction protein levels in rod photoreceptors. Cell Death Differ. 2015;22(3):488–498. [DOI] [PMC free article] [PubMed] [Google Scholar]
- [47].Zhou Z, Vinberg F, Schottler F, et al. Autophagy supports color vision. Autophagy. 2015;11(10):1821–1832. [DOI] [PMC free article] [PubMed] [Google Scholar]
- [48].Barot M, Gokulgandhi MR, Mitra AK. Mitochondrial dysfunction in retinal diseases. Curr Eye Res. 2011;36(12):1069–1077. [DOI] [PMC free article] [PubMed] [Google Scholar]
- [49].Giordano C, Iommarini L, Giordano L, et al. Efficient mitochondrial biogenesis drives incomplete penetrance in Leber’s hereditary optic neuropathy. Brain. 2014;137(Pt 2):335–353. [DOI] [PMC free article] [PubMed] [Google Scholar]
- [50].Reme CE, Sulser M. Diurnal variation of autophagy in rod visual cells in the rat. Albrecht Von Graefes Arch Klin Exp Ophthalmol. 1977;203(3–4):261–270. [DOI] [PubMed] [Google Scholar]
- [51].Yao J, Jia L, Shelby SJ, et al. Circadian and noncircadian modulation of autophagy in photoreceptors and retinal pigment epithelium. Invest Ophthalmol Vis Sci. 2014;55(5):3237–3246. [DOI] [PMC free article] [PubMed] [Google Scholar]
- [52].Rodríguez-Muela N, Hernández-Pinto AM, Serrano-Puebla A, et al. Lysosomal membrane permeabilization and autophagy blockade contribute to photoreceptor cell death in a mouse model of retinitis pigmentosa. Cell Death Differ. 2015;22(3):476–487. [DOI] [PMC free article] [PubMed] [Google Scholar]
- [53].Esteban-Martinez L, Boya P. BNIP3L/NIX-dependent mitophagy regulates cell differentiation via metabolic reprogramming. Autophagy. 2018;14(5):915–917. [DOI] [PMC free article] [PubMed] [Google Scholar]
- [54].Carter-Dawson LD, LaVail MM. Rods and cones in the mouse retina. I. Structural analysis using light and electron microscopy. J Comp Neurol. 1979;188(2):245–262. [DOI] [PubMed] [Google Scholar]
- [55].Davis CH, Kim K-Y, Bushong EA, et al. Transcellular degradation of axonal mitochondria. Proc Natl Acad Sci U S A. 2014;111(26):9633–9638. [DOI] [PMC free article] [PubMed] [Google Scholar]
- [56].Strauss O. The retinal pigment epithelium in visual function. Physiol Rev. 2005;85(3):845–881. [DOI] [PubMed] [Google Scholar]
- [57].Yao J, Jia L, Khan N, et al. Deletion of autophagy inducer RB1CC1 results in degeneration of the retinal pigment epithelium. Autophagy. 2015;11(6):939–953. [DOI] [PMC free article] [PubMed] [Google Scholar]
- [58].Felszeghy S, Viiri J, Paterno JJ, et al. Loss of NRF-2 and PGC-1alpha genes leads to retinal pigment epithelium damage resembling dry age-related macular degeneration. Redox Biol. 2018;20:1–12. [DOI] [PMC free article] [PubMed] [Google Scholar]
- [59].Golestaneh N, Nikolic A, Kentish SJ, et al. Dysfunctional autophagy in RPE, a contributing factor in age-related macular degeneration. Cell Death Dis. 2017;8(1):e2537. [DOI] [PMC free article] [PubMed] [Google Scholar]
- [60].Mitter SK, Song C, Qi X, et al. Dysregulated autophagy in the RPE is associated with increased susceptibility to oxidative stress and AMD. Autophagy. 2014;10(11):1989–2005. [DOI] [PMC free article] [PubMed] [Google Scholar]
- [61].Kim J-Y, Zhao H, Martinez J, et al. Noncanonical autophagy promotes the visual cycle. Cell. 2013;154(2):365–376. [DOI] [PMC free article] [PubMed] [Google Scholar]
Associated Data
This section collects any data citations, data availability statements, or supplementary materials included in this article.