INTRODUCTION:
“Resect and discard” paradigm is one of the main strategies to deal with colorectal diminutive polyps after optical diagnosis. However, there are risks that unrecognized potentially malignant lesions are discarded without accurate diagnosis. The purpose of this study is to validate the potential of micro-optical coherence tomography (μOCT) to improve the diagnostic accuracy of colorectal lesions and help endoscopists make better clinical decision without additional pathology costs.
METHODS:
Fresh tissue samples were obtained from patients with colorectal polyps or colorectal cancer who received endoscopic therapy or laparoscopic surgery. These samples were instantly imaged by μOCT and then sent to pathological evaluation. Then, μOCT images were compared with corresponding HE sections. We created consensus μOCT image criteria and then tested to determine sensitivity, specificity, and accuracy of our system to discriminate neoplastic polyps from non-neoplastic polyps.
RESULTS:
Our μOCT system achieved a resolution of 2.0 μm in both axial and lateral directions, clearly illustrated both cross-sectional and en face subcellular-level microstructures of colorectal lesions ex vivo, demonstrating distinctive patterns for inflammatory granulation tissue, hyperplastic polyp, adenoma, and cancerous tissue. For the 58 cases of polyps, the accuracy of the model was 94.83% (95% confidence interval [CI], 85.30%–98.79%), the sensitivity for identification of adenomas was 96.88% (95% CI, 82.89%–99.99%), and the specificity was 92.31% (95% CI, 74.74%–98.98%). Our diagnostic criteria could help both expert endoscopists and nonexpert endoscopists to identify neoplastic from non-neoplastic polyps with satisfactory accuracy and good interobserver agreement.
DISCUSSION:
We propose a new strategy using μOCT to differentiate benign polyps and adenomas after the lesions are resected. The application of μOCT can potentially reduce the cost of pathological examination and minimize the risk of discarding malignant lesions during colonosocpy examination.
INTRODUCTION
Colorectal cancer (CRC) is one of the most common cancers and a leading cause of cancer-related death worldwide (1,2). The US Preventive Services Task Force gives a grade A level recommendation for CRC screening in adults beginning at an age of 50 years and continuing until 75 years (3). Colonoscopies have become increasingly favored for CRC screening, with the American College of Gastroenterology considering colonoscopy to be the “preferred” screening method when available (3,4).
The wide application of colonoscopy screening has led to a rising number of diminutive polyps (<5 mm) detected (5). Adenomatous polyps have potential to become malignant, whereas the risk of diminutive benign polyps (inflammatory or hyperplastic polyps) is low (6). Compared with patients with inflammatory or hyperplastic polyps, those with adenomatous polyps are at a higher risk of developing metachronous adenomas or cancer, and this is supported by that after colonoscopy and polypectomy, some patients may develop interval cancers before next colonoscopy (7,8). Given this fact, a differential diagnosis of diminutive polyps into benign polys or adenomas is of great significance, which indicates patient outcomes and affects the colonoscopy surveillance interval (7–9).
The conventional paradigm for polyps treatment is to remove all the visible polyps and subsequent pathological assessment, regardless of the size or appearance (10). A survey shows that at least 67.2% patients would pay $150 per polyp for pathological assessment of a diminutive lesion, while of all detected polyps, 70%–80% are diminutive, and most of which are non-neoplastic (5,11,12). In recent years, advanced optical diagnostic tool or novel methods, such as chromocolonoscopy, narrow-band imaging (NBI), and blue laser imaging, have prompted the notion of optical diagnosis, which arouse a debate of a new paradigm “resect and discard” (13,14). Optical diagnosis during colonoscopy examination can predict the histology of diminutive polyps so that these diminutive lesions could be resected and discarded without pathological assessment (14). The most convincing benefit of optical diagnosis is the substantial estimated reduction in global health care costs, mainly because of savings in pathology costs.
However, the widespread implementation of optical diagnosis in clinical practice encountered resistance and difficulty. Optical diagnosis during routine colonoscopy to predict histology is subject to operator dependence, still with the risk of discarding lesions with advanced histology or small invasive cancer. A systematic review and meta-analysis of optical diagnosis for diminutive polyps suggested that accuracy was much higher in academic centers when performed by experienced endoscopists (15). Another multicenter study indicates that optical diagnosis with NBI in the hands of nonexperts is not accurate enough to replace histology in determining surveillance for patients with colorectal polyps, indicating that optical diagnosis cannot currently be recommended for application in routine clinical practice (16). Pit pattern analysis developed by Kudo et al. was reported to be reliable to obtain histologic details to differentiate neoplastic from non-neoplastic colorectal polyps, and additional use of chromoendoscopy may improve the diagnostic accuracy of NBI (17–19). However, chromoendoscopy also has several disadvantages: spraying dyes such as indigo carmine and crystal violet requires troublesome preparation and implementation, interference with lesion resection, and postspraying visualization of surrounding structures. Because of these difficulties, chromoendoscopy is not widely used in most countries. Importantly, based on a survey to explore the patient acceptance of optical diagnosis, it is reported that the number of patients supporting for optical diagnosis is limited, and those who are not supporters are more likely to seek for financial compensation if errors occur (20).
Thus, strategies, which can differentiate adenomas and benign polyps with safety, high accuracy, low cost, and short learning curve, are imperative to solve these problems. High-resolution imaging modality that is able to provide “optical biopsy” images, which is similar to those seen in histology, is a promising way to get histologic information without conventional pathological assessment because it can help visualize the subtle tissue morphological changes directly during the progression of malignancies (3,21). Micro-optical coherence tomography (μOCT) developed by our group is an interferometric imaging modality that uses spatially incoherent illumination and array detection to provide ex vivo and in vivo microstructure images of the biological tissues noninvasively (22). Our previous studies have proven that μOCT is capable of visualizing cellular and subcellular structures in the cornea, coronary artery, and pulmonary tracts (22–24). Recently, we demonstrated that it was capable of visualizing subcellular-level microstructures of the rat and swine colon in forms of 3-dimensional (3D) images at a resolution of 2.0 μm (25,26). A comparison with histology images shows identical structure, which hints that μOCT could be a powerful tool to “histologically” diagnose colorectal polyps (25,26). In this article, we made a comparison between μOCT images and histopathology images of colorectal lesions and evaluated the feasibility and efficacy of μOCT to distinguish between adenomas and benign polyps in resected lesions. We also tried to establish the diagnostic criteria for μOCT images to make our system more practical.
METHODS
Setup of the μOCT system
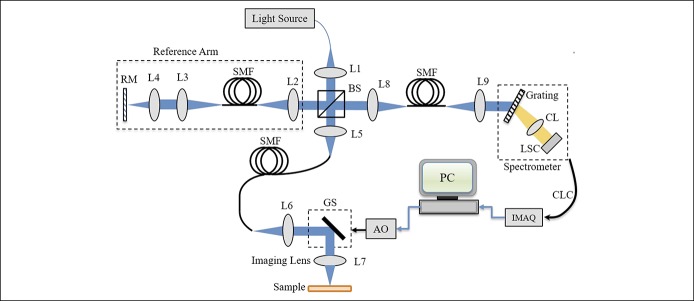
Figure 1 depicts the μOCT system constructed for imaging purpose. The laser source was a supercontinuum laser source (SC-5; Yangtze Soton Laser, Wuhan, China) with a spectrum ranging from 480 to 2,200 nm and a repetition rate of 5 MHz. The full width at half-maximum bandwidth of such a source is Δλ = 180 nm with a center wavelength of λc = 810 nm. With the power ratio tuned to 100%, the laser power output was measured to be 100.5 mW. The laser output was coupled into a single-mode fiber (630-HP; Thorlabs, Newtown, NJ) and directed to a nonpolarizing cube 50:50 broadband beamsplitter (BS008; Thorlabs) with one portion directed to the reference arm and the other to the sample arm. The reference arm consists of a lens L2 (AC050-010-B-ML; Thorlabs), single-mode fiber (630-HP; Thorlabs), L3 (AC050-015-B-ML; Thorlabs), L4 (M Plan Apo NIR 20×; Mitutoyo, Tokyo, Japan), and a reference mirror. While the sample arm optics followed the same path length as the reference arm with a galvo scanner (GVSM002/M; Thorlabs) inserted in between the collimation lens L6 (identical to L2) and the objective lens L7 (identical to L2) for sample scanning. The illumination power on the sample was measured to be 10.68 mW in the experiments. To compensate the dispersion effects caused by the fiber length difference between the 2-arm optics, the method proposed in was adopted for system calibration (27).
Figure 1.
Schematic of the free-spaced μOCT system constructed. Typical free-spaced μOCT system constructed for imaging. AO, analog output; BS, beam splitter; CL, camera lens; CLC, camera link cable; GS, galvo scanner; IMAQ, image acquisition; L1–L9, all are achromatic lens; LSC, line scan camera; PC, polarization controller; RM, reference mirror; SMF, single-mode fiber; μOCT, micro-optical coherence tomography.
The light signals backscattered from the sample arm and those backreflected from the reference arm optics were recombined by the beamsplitter to generate interferometric signals, which finally were collected by a spectrometer. Such a spectrometer consisted of a collimation lens L5 (AC127-030-B-ML; Thorlabs), a diffraction grating (960 L/mm @ 830 nm; Wasatch Photonics, Logan, UT), a camera lens (Nikon AF Nikkor 85mm f/1.8D), and a line scan charge coupled device array (E2V, AViiVA EM4). The spectrometer efficiency, including the grating efficiency and the overall losses of optical components and spectrometer geometry, was measured to be 0.421. The detected signal was transferred to a workstation through camera link cables and an image acquisition card (KBN-PCE-CL4-F; Bitflow, Boston, MA) at 12-bit digital resolution. In the experiments, both the camera and the galvo scanners were synchronized by a triggering signal generated by the workstation. The effective camera pixel number covered by the laser spectrum was measured to be 1,467 at full width at half-maximum.
μOCT system characterization
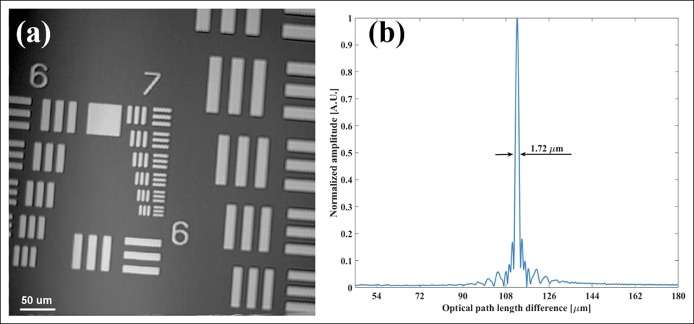
We characterized the μOCT system performance by measuring its spatial resolution in transverse and axial directions, respectively. En face image of the 1951 United States Air Force resolution chart was extracted from an acquired 3D volumetric image for system's lateral resolution measurement. Figure 2a depicts the en face image acquired, which consists of 1,024 × 1,024 pixels, covering an area of 0.436 × 0.436 mm. Because the line pattern of group 7 element 6 can be clearly resolved, the system transverse resolution is estimated to be <2.0 μm. To measure the system axial resolution, we inserted an actuated iris diaphragm (SM05D5; Thorlabs) with total attenuation of 33.9 dB into the sample arm optics and measured an A-line profile by placing a BK7 prism (with attenuation of 14 dB) at the focal plane of the sample arm optics. The obtained axial point spread functions at different optical path length differences are shown in Figure 2b. Results show that an axial resolution of ∼1.72 μm was achieved in air, which is slightly larger than the theoretical value of Δz = 1.60 μm. Furthermore, as the signal-to-noise ratio was measured to be 53.2 dB at a path length difference of ∼110 μm, the μOCT system sensitivity was estimated to be ∼101.1 dB. Such a value was slightly lower than the theoretical value of 104.2 dB because of the imperfect spectrum responses of the optical components. In addition, the 6-dB falling-off happens around 710 μm.
Figure 2.
Measured spatial resolution of the micro-optical coherence tomography system. (a) En face image (1,024 × 1,024 pixels, 0.436 × 0.436 mm) of the 1951 resolution chart, demonstrating the system transverse resolution to be <2.0 μm. (b) The axial resolution was measured to be 1.72 μm in air.
Samples from patients
The present study included 85 samples from 83 patients (20 samples for training and 65 samples for testing) diagnosed with colorectal polyps with white light endoscopy in the Endoscopy Center of Remin Hospital of Wuhan University. We obtained these polyp specimens via electrocoagulation or endoscopic submucosal dissection. In addition, we obtained 2 colorectal adenocarcinoma specimens from the Department of Gastrointestinal Surgery, Renmin Hospital of Wuhan University. This study was approved by the hospital ethics committee.
μOCT imaging
Freshly excised specimens were used to conduct μOCT imaging ex vivo immediately after being excised. Each specimen was flushed by normal saline solution to remove the fecal debris and mucus before imaging. In the imaging process, a small amount of saline solution was added onto the tissue surface to provide index matching. Ex vivo images were acquired from the luminal side at 30 frames per second with an acquisition rate of 30, 720 A-lines per second. The time of μOCT imaging for every sample is limited in 3 min and then sent to routine pathological evaluation.
Statistical analysis
Interobserver variability among all endoscopists and within subgroups was evaluated with the unweighted kappa statistic. The kappa values were interpreted as follows: perfect agreement: value of 1.00; almost perfect agreement: value of 0.81–0.99; substantial agreement: value of 0.61–0.80; moderate agreement: value of 0.41–0.60; fair agreement: value of 0.21–0.40; slight agreement: value of 0.10–0.20; and less than chance agreement: <0.10 (28,29). A 2-sided P value <0.05 was considered to indicate a statistically significant difference, using the normal z test.
RESULTS
Three-dimensional visualization of colorectal polyps by μOCT
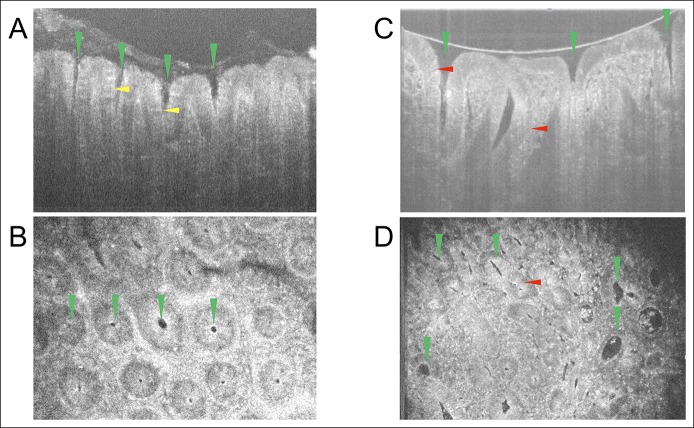
As shown in Figure 3a,b, the detailed microstructures of a hyperplastic polyp and an adenoma, such as the crypt lumens and the individual goblet cells, were clearly resolved, respectively. In cross-sectional images, for the crypt lumens, it could be observed that they have very good contrast relative to the epithelium; we can also clearly observe goblet cells distributed around the crypt lumens in the hyperplastic polyp (Figure 3a). The number of goblet cells was significantly reduced in the adenoma (Figure 3b), which is a common but not standard characteristic of adenoma in histology. In addition, in some parts of the cross-sectional image, we could observe the nuclei (Figure 3b). The detailed structures of the samples could be further identified within rapidly 3D reconstructed en face images. As can be seen from both images (Figure 3c, d; see Figure 1, Supplementary Digital Content 1, http://links.lww.com/CTG/A48), the tissue structures, e.g., crypt lumen and goblet cells, could be clearly identified, and nuclei could be identified in some parts of the images.
Figure 3.
Cross-sectional and en face images of polyps. (a) Representative cross-sectional micro-optical coherence tomography image of a hyperplastic polyp. (b) Representative en face image of the hyperplastic polyp shown in a. (c) Representative cross-sectional optical coherence tomography image of an adenoma. (d) Representative en face image of the adenoma shown in c. Green triangle: crypt lumen structure. Yellow triangle: goblet cells. Red triangle: nuclei.
μOCT images mimic pathological section of colorectal lesions
As shown above, μOCT images clearly illustrated the microstructures of colorectal samples; herein, we examined whether it had high consistency with conventional histology. We compared μOCT en face images with tangential pathological section in 20 cases of different colorectal lesions. We found that μOCT could show crucial clues for diagnosis of different diseases.
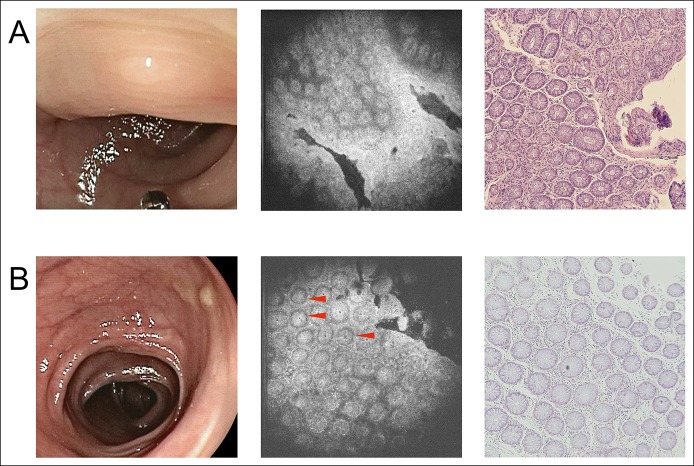
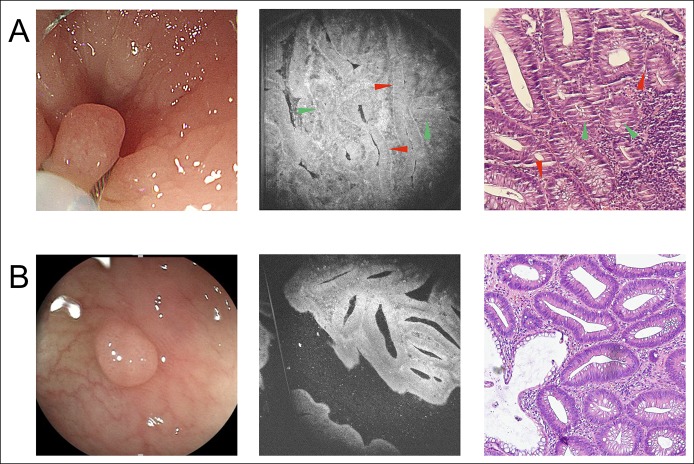
For non-neoplastic polyps (Figure 4), in both the pathological section and the μOCT image, the following information can be obtained: the size of the glands was usually uniform; the shape of the glands was usually round or oval; and luminal caliber did not display a marked difference. In some μOCT images (Figure 4b), with good contrast, we could also observe that the nuclei were basally oriented with no significant elongation. For adenoma (Figure 5), in both the pathological section and the μOCT image, the following information can be obtained: the appearance of glands was irregular; more enlarged or tube-like glands and linear, wide, distorted crypts could be observed clearly, which were obviously different from relatively regular round structures of non-neoplastic polyps; and in some glands, increased epithelium to crypt ratio can be observed, which is resulted from crypt lumen narrowing and thickening of the epithelium. In some cases, with good contrast, elongated nuclei were occasionally visible and aligned in parallel, which indicated that the glands contain at least low-grade dysplasia.
Figure 4.
The appearance of 2 hyperplastic polyps under WLE, μOCT imaging, and pathological examination. (a) Case 1 of hyperplastic polyp. (b) Case 2 of hyperplastic polyp. From left to right: WLE images, μOCT images, and pathological images, respectively. Red triangle: nuclei. Red triangle: area of nuclei. μOCT, micro-optical coherence tomography; WLE, white light endoscopy.
Figure 5.
The appearance of 2 adenomas under WLE, μOCT imaging, and pathological examination. (a) Case 1 of adenoma. (b) Case 2 of adenoma. From left to right: WLE images, μOCT images, and pathological images, respectively. Red triangle: elongated nuclei. Green triangle: crypt lumen narrowing and thickening of the epithelium. Red triangle: area of nuclei. μOCT, micro-optical coherence tomography; WLE, white light endoscopy.
The collected samples included a juvenile polyp (Figure 6). In both the μOCT image and the pathological section, we could observe that this polyp was composed of mass granulation tissue, and the sparse glands could also be observed. For inflammatory granuloma, both the pathological section and the μOCT image only presented mass granulation tissue, and no glandular structure could be observed (see Figure 2, Supplementary Digital Content 2, http://links.lww.com/CTG/A49). For adenocarcinoma, in both the μOCT image and the pathological section, normal crypt architecture was lost, and we could observe that the enlarged nuclei lost their polarity (Figure 7).
Figure 6.
The appearance of a juvenile polyp under WLE, μOCT imaging, and pathological examination. From left to right: WLE images, μOCT images, and pathological images, respectively. Yellow triangle: sparse glands. μOCT, micro-optical coherence tomography; WLE, white light endoscopy.
Figure 7.
The appearance of colorectal adenocarcinoma under WLE, μOCT imaging, and pathological examination. From left to right: WLE images, μOCT images, and pathological images, respectively. Red triangle: enlarged nuclei without polarity. μOCT, micro-optical coherence tomography; WLE, white light endoscopy.
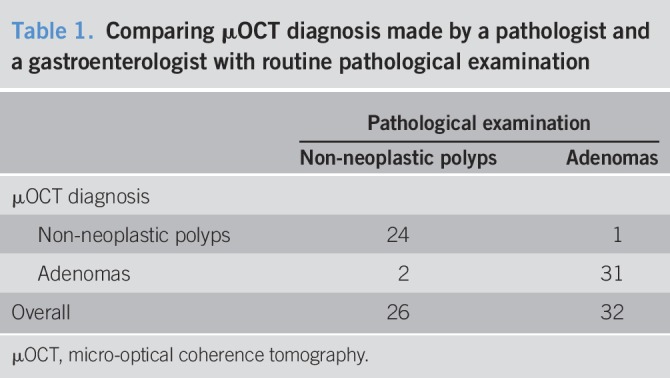
To test whether μOCT can distinguish adenomas from benign polyps, 1 gastrointestinal pathologist (Z.Z.) and 1 gastroenterologist (D.Q.) analyzed μOCT images of 65 freshly excised colorectal polyp specimens. Among these 65 specimens, images of 5 cases were with low quality and excluded; images of 2 cases were diagnosed as granuloma and excluded (which were also validated by later pathological examination). Then, the 2 doctors reviewed the images of the remaining 58 samples made diagnosis before pathological examination. If a disagreement arose, another pathologist (Y.J.) would make a final diagnosis. We demonstrated that μOCT was able to identify adenomatous polyps with a sensitivity of 96.88% (95% confidence interval [CI], 82.89%–99.99%), a specificity of 92.31% (95% CI, 74.74%–98.98%), and an overall accuracy of 94.83% (95% CI, 85.30%–98.79%). The positive predictive value (PPV) was 93.94%, and the negative predictive value (NPV) was 96% (Table 1).
Table 1.
Comparing μOCT diagnosis made by a pathologist and a gastroenterologist with routine pathological examination
The establishment of the μOCT diagnostic criteria for endoscopists to make rapid optical diagnosis
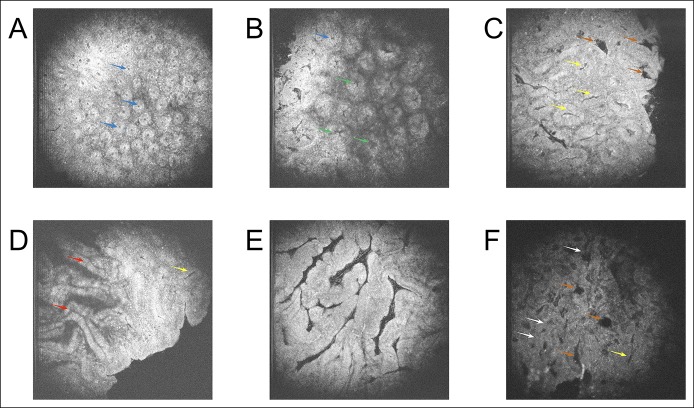
As shown above, because of tissue scattering and optical aberration, not all images could present the nuclei clearly. The size and structure of glands and crypts are crucial factors affecting the diagnosis made by pathologists. Thus, in this study, we (Y.H., D.Q., and Z.Z.) tried to establish diagnostic criteria of en face μOCT images based on the morphology of glands and crypts, which would make the diagnosis more intelligible and compatible for all images. Our criteria have some resemblances with Kudo pit pattern analysis (17–19). Based on the 20 training samples, we classified the glands and crypts into 7 groups: small round pit, small asteroid pit, large asteroid pit, oval pit, branched pit, gyrus-like pit, and atypical pit (Figure 8a–f). Non-neoplastic polyps (including inflammatory polyps and hyperplastic polyps) exhibit small round pit or small asteroid pit. The images of adenomas are much more variable than benign polyps: the glands are usually larger and irregular arranged, and the crypts were extended, or distorted, or branched, exhibiting patterns of large asteroid pit, oval pit, branched pit, or gyrus-like pit (Figure 8e). For atypical pit, it indicates that in some adenomas, the glands and crypts show architectural complexity such as cribriform gland and multiple pit patterns (Figure 8f).
Figure 8.
Seven pit patterns of micro-optical coherence tomography images, which are used to establish the diagnostic criteria. (a, b) Representative en face optical coherence tomography images of hyperplastic polpys. (c–f) Representative en face images of adenomas. Blue arrow: small round pit. Green arrow: small asteroid pit. Brown arrow: large asteroid pit. Yellow arrow: oval pit. Red arrow: branched pit. White arrow: cribriform gland.
All expert endoscopists, nonexpert endoscopists, and medical students can master the criteria well
Figure 8 was used to train expert endoscopists (W.X. and Z.J.), nonexpert endoscopists (Z.W. and M.G.), and medical students (D.Y., H.L., Y.L.) without experience of colonoscopy, respectively. The training time was limited in 10 minutes for every observer. Then, the 7 observers were tested to distinguish adenomas from non-neoplastic polyps in the 58 testing samples mentioned above. Expert endoscopists (n = 2) were able to identify adenomas with average sensitivity of 92.19%, average specificity of 90.39%, and average accuracy of 91.38%; the average PPV was 92.19%, and the average NPV was 90.39% (Figure 9). Nonexpert endoscopists (n = 2) achieved average sensitivity of 93.75%, average specificity of 90.39%, and average accuracy of 92.24%; the average PPV and NPV were 92.37% and 92.23%, respectively (Figure 9). Medical students (n = 3) achieved average sensitivity of 86.46%, average specificity of 92.31%, and average accuracy of 89.08%; the average PPV was 93.25%, and the average NPV was 84.80% (Figure 9). The kappa value for experts, nonexperts, and students all indicated substantial agreement (κ = 0.651, 0.895, and 0.793, respectively). The kappa value for overall participants agreement also showed substantial agreement (κ = 0.769).
Figure 9.
Diagnostic performance measures of micro-optical coherence tomography for differentiating non-neoplastic polyps vs adenomatous polyps. NPV, negative predictive value; PPV, negative predictive value.
DISCUSSION
Novel imaging modalities have shown the ability to predict neoplastic polyps with high accuracy and thus help endoscopists determine the interval for the subsequent surveillance colonoscopy (30). In this proof-of-concept study, we demonstrated that μOCT is capable of visualizing subcellular-level characteristics in colorectal lesions with a resolution of 2 μm and can be used to avoid misdiagnosis before the polyps discarded, thereby helping the endoscopist make more accurate decision of subsequent treatment or colonoscopy surveillance interval. Compared with routine pathological assessment, μOCT is not only cost efficient but also time efficient. Routine pathological assessment requires 1–3 days to make paraffin sections from resected tissue, yet the slice processing may still influence pathological diagnosis because of rather thin sections (∼5 μm) (31). While with μOCT, the detection can be conducted after the resection immediately, and every detection with μOCT and images evaluation could be finished in approximately 5 minutes, and the doctors can provide patients with immediate surveillance recommendations. Furthermore, the capability of 3D imaging with μOCT also enables volumetric rendering of the tissue, which is important for identifying characteristic features in various lesions and allows tracking features from different layers to identify 3D architecture that is difficult to appreciate from single section. Importantly, because μOCT is a noninvasive and nondestructive means to detect microstructure of the polyps, if the endoscopists observe lesions that raise a suspicion of adenoma or minimal cancer, these samples could then be analyzed further using routine pathological assessment when necessary.
Several studies reported that some other high-resolution imaging modalities, such as confocal laser endomicroscopy (CLE) and high-resolution microendoscopy (HRME), have similar resolution with our system (3,21,32–37). In this prospective study, μOCT obtained similar performance characteristics to differentiate colorectal adenomas and hyperplastic polyps compared with these 2 modalities. CLE is a powerful diagnostic and surveillance tool, whose widespread use has been limited by their high cost, need for intravenous contrast, and relatively high learning curve (3). HRME is another new imaging method for cytology imaging, but its lack of contrast agents and small field of view (∼750 μm) are major problems, and it can only image the superficial epithelium (3). Compared with these 2 modalities, μOCT has certain advantages such as simple operation, natural contrast, large scanning area (in our system, the field of view is ∼2 mm), 3D imaging, and low cost. Full-field OCT is another potent technique for evaluation of tissue architecture, providing en face images directly with a higher resolution (∼1 μm) (31,38), which has not been applied to differentiate adenomas and non-neoplastic polyps yet. However full-field OCT imaging acquisition often takes more than 10 minutes (31,38). Long imaging acquisition may reduce work efficiency and increase the risk of the sample property changes (especially for RNA, which is degraded fast under room temperature). From this point of view, short processing time may make our μOCT more practical.
In this research, the accuracy of diagnosis is good. It is worth emphasizing that because μOCT can focus on not only the superficial epithelium but also the subsurface region of the lesions, which possibly makes our diagnostic criteria (μOCT “pit pattern”) more comprehensive compared with Kudo “pit pattern.” It may be meaningful to note that flat lesions such as sessile serrated adenomas and polyps can be easily mistaken as non-neoplastic polyps because similar surface structure (39,40). Taking this into consideration, although we did not study whether μOCT can distinguish sessile serrated adenomas and polyps better than other modalities or methods, its 3D imaging ability gives it more potential, and we are also planning on such studies. What is more, predictably, in most cases, when the information of nuclei is clear, the endoscopists can make diagnosis with our criteria more confidently and the diagnostic accuracy may further be improved.
Imaging techniques including NBI, digital chromoendoscopy, endocytoscopy, CLE, and HRME require a relatively long learning curve (14,18,19) and are thus dependent on the experience of the endoscopists. In this research, we demonstrate that the interobserver variability is low; with μOCT images and our diagnostic criteria, even medical students without experience of endoscopy examination can make accurate diagnosis after a short training. These results suggest that novice endoscopists are able to make diagnosis using μOCT images with results similar to those of experts. This is especially important for optical diagnosis of colorectal polyps, due to that only easily learned method is suitable for colonoscopy screening in a large scale.
Although in most of our images, the location and size of nuclei are displayed directly or surmisable, we think that the definition is still not high enough to evaluate nuclear atypia of every part of the raw images. We can get more comprehensive information about the nuclei via image processing; this will significantly extend analysis time and increase the learning curve, so we have to weigh pros and cons. We established the diagnostic criteria for μOCT imaging mainly according to the size and morphology of the glands and crypts in different depths. Only with information about the size and morphology of the glands and crypts, it is not sufficient to make a more precise diagnosis of dysplasia of whether low- or high-grade intraepithelial neoplasia exits. This is the main limitation of our study. Nevertheless, with the rapid advances in the fields of optical imaging and image processing, we believe that μOCT is promising to provide more complimentary information of the nuclei to help endoscopists make accurate clinical judgment in the near future.
It is worth noting that there is an even more radical paradigm to deal with the diminutive polyps, called “diagnosis and leave,” namely to defer resection of diminutive polyps after optical diagnosis and only remove those that have grown to higher-risk polyps during the surveillance interval (41,42). This paradigm is also causing controversy because it may leave the adenomas with high possibility of malignant transformation, increasing the risk of interval cancers (41,42). Our group has developed a μOCT microendoscope to clearly visualize the subcellular-level details of animal colonic structures (25). Device improvement and clinical tests are undergoing, and we hope our following research can help endoscopists evaluate the lesions in situ and make “diagnosis and leave” paradigm safer and more practicable. The current study is a solid foundation for the following work.
To the best of our knowledge, our study is the first on subcellular structure imaging in human colorectal lesions using spectral domain OCT. Our results indicate that high-resolution OCT functions well in differentiating adenomas from inflammatory polyps and hyperplastic polyps and can be a useful tool to perform “optical biopsy” after polyp resection, which thus help doctors give the patients more accurate advice on colonoscopy surveillance interval. Our results also lay the foundation for future in vivo optical diagnosis of colorectal polyps using μOCT microendoscopy. Although μOCT shows good prospects for clinical application, evaluation of the diagnostic utility of μOCT is still at the preclinical stage. The practicability and diagnostic accuracy of μOCT need to be validated with larger numbers of samples and in more centers before it could be applied clinically extensively, and a standard guide to train endoscopists to use this equipment is also needed.
CONFLICTS OF INTEREST
Guarantor of the article: Honggang Yu, MD, PhD.
Authors' contributions: D.Q., D.Y., and Y.X. contributed equally to this work. D.Q., L.L., and, Y.H. conceived and designed the experiments. Y.X. and L.L. constructed the μOCT system. C.M., and Z.X., and Y.H. performed the colonoscopy examination and surgery. D.Q. and D.Y. detected samples with the μOCT system. D.Q., Y.J., and Z.Z. made diagnosis with μOCT images. D.Q., Z.Z., and Y.H. established μOCT diagnostic criteria. D.Y., M.G, W.X., Z.J., Z.W., H.L., and Y.L. validated μOCT diagnostic criteria. Y.X., L.L., and Y.H. contributed funds/reagents/materials. D.Q., D.Y., Y.X., and G.D. wrote the article. All authors read and approved the final manuscript.
Financial support: This study was supported by the Grant from the National Research Foundation Singapore (No. NRF-CRP13-2014-05), the National Medical Research Council Singapore (No. NMRC/CBRG/0036/2013), the Ministry of Education Singapore (No. MOE2013-T2-2-107), NTU-AIT-MUV Program in Advanced Biomedical Imaging (No. NAM/15005), the National Natural Science Foundation of China (No. 61705184), the Natural Science Basic Research Plan in Shaanxi Province of China (No. 2018JQ6014), and the Research Funds for Key Laboratory of Hubei Province of China (No. 2016CFA066).
Potential competing interests: The authors declare that they have no competing interest.
Ethics approval: The study was approved by Renmin Hospital of Wuhan University (Approval Number: 2017K-C053).
Study Highlights.
WHAT IS KNOWN
✓ The wide application of colonoscopy screening has led to a rising number of polyps detected, and the pathological cost is high.
✓ Optical diagnosis during colonoscopy examination can predict the histology of diminutive polyps so that these diminutive lesions could be resected and discarded without pathological assessment, but optical diagnosis is not accurate enough in clinical practice.
WHAT IS NEW HERE
✓ μOCT is capable of visualizing cellular and subcellular structures of colorectal polyps with high-resolution, label-free and 3D imaging.
✓ μOCT image is highly similar with the pathological section of colorectal polyps.
✓ μOCT is able to help endoscopists differentiate colorectal adenomas and non-neoplastic polyps with high accuracy.
✓ The learning curve for μOCT diagnostic criteria is short, and our method may be easily adopt for doctors.
TRANSLATIONAL IMPACT
✓ The application of μOCT during colonoscopy screening may reduce pathological cost.
Supplementary Material
ACKNOWLEDGEMENT
We thank all the members from the Department of Gastroenterology and the Department of Pathology, Renmin Hospital of Wuhan University, for their support.
Footnotes
SUPPLEMENTARY MATERIAL accompanies this paper at http://links.lww.com/CTG/A48 and http://links.lww.com/CTG/A49
REFERENCES
- 1.Siegel RL, Miller KD, Jemal A. Cancer statistics, 2017. CA Cancer J Clin 2017;67(1):7–30. [DOI] [PubMed] [Google Scholar]
- 2.Chen W, Zheng R, Baade PD, et al. Cancer statistics in China, 2015. CA Cancer J Clin 2016;66(2):115–32. [DOI] [PubMed] [Google Scholar]
- 3.Louie JS, Shukla R, Richards-Kortum R, et al. High-resolution microendoscopy in differentiating neoplastic from non-neoplastic colorectal polyps. Best Pract Res Clin Gastroenterol 2015;29(4):663–73. [DOI] [PMC free article] [PubMed] [Google Scholar]
- 4.Rex DK, Johnson DA, Anderson JC, et al. American College of Gastroenterology guidelines for colorectal cancer screening 2009 [corrected]. Am J Gastroenterol 2009;104(3):739–50. [DOI] [PubMed] [Google Scholar]
- 5.von Renteln D, Pohl H. Polyp resection: controversial practices and unanswered questions. Clin Transl Gastroenterol 2017;8(3):e76. [DOI] [PMC free article] [PubMed] [Google Scholar]
- 6.Butterly LF, Chase MP, Pohl H, et al. Prevalence of clinically important histology in small adenomas. Clin Gastroenterol Hepatol 2006;4(3):343–8. [DOI] [PubMed] [Google Scholar]
- 7.Kaminski MF, Wieszczy P, Rupinski M, et al. Increased rate of adenoma detection associates with reduced risk of colorectal cancer and death. Gastroenterology 2017;153(1):98–105. [DOI] [PubMed] [Google Scholar]
- 8.Sullivan JF, Dumot JA. Maximizing the effectiveness of colonoscopy in the prevention of colorectal cancer. Surg Oncol Clin N Am 2018;27(2):367–76. [DOI] [PubMed] [Google Scholar]
- 9.Lieberman DA, Rex DK, Winawer SJ, Giardiello DA, Levin TR. Guidelines for colonoscopy surveillance after screening and polypectomy: A consensus update by the US multi-Society Task Force on colorectal cancer. Gastroenterology 2012;143:844–57. [DOI] [PubMed] [Google Scholar]
- 10.Sakata S, Kheir AO, Hewett DG. Hewett, optical diagnosis of colorectal neoplasia: A Western perspective. Dig Endosc 2016;28(3):281–8. [DOI] [PubMed] [Google Scholar]
- 11.Rex DK, Patel NJ, Vemulapalli KC. A survey of patient acceptance of resect and discard for diminutive polyps. Gastrointest Endosc 2015;82(2):376–80.e1. [DOI] [PubMed] [Google Scholar]
- 12.Patel SG, Schoenfeld P, Kim HM, et al. Real-time characterization of diminutive colorectal polyp histology using narrow-band imaging: Implications for the resect and discard strategy. Gastroenterology 2016;150(2):406–18. [DOI] [PMC free article] [PubMed] [Google Scholar]
- 13.Ignjatovic A, East JE, Suzuki N, et al. Optical diagnosis of small colorectal polyps at routine colonoscopy (detect InSpect ChAracterise resect and discard; DISCARD trial): A prospective cohort study. Lancet Oncol 2009;10(12):1171–8. [DOI] [PubMed] [Google Scholar]
- 14.von Renteln D, Kaltenbach T, Rastogi A, et al. Simplifying resect and discard strategies for real-time assessment of diminutive colorectal polyps. Clin Gastroenterol Hepatol 2018;16(5):706–14. [DOI] [PubMed] [Google Scholar]
- 15.ASGE Technology Committee; Abu Dayyeh BK, Thosani N, Konda V, et al. ASGE Technology Committee systematic review and meta-analysis assessing the ASGE PIVI thresholds for adopting real-time endoscopic assessment of the histology of diminutive colorectal polyps. Gastrointest Endosc 2015;81(3):502.e1–16. [DOI] [PubMed] [Google Scholar]
- 16.Rees CJ, Rajasekhar PT, Wilson A, et al. Narrow band imaging optical diagnosis of small colorectal polyps in routine clinical practice: The detect inspect characterise resect and discard 2 (DISCARD 2) study. Gut 2017;66(5):887–95. [DOI] [PMC free article] [PubMed] [Google Scholar]
- 17.Kudo S, Hirota S, Nakajima T, et al. Colorectal tumours and pit pattern. J Clin Pathol 1994;47(10):880–5. [DOI] [PMC free article] [PubMed] [Google Scholar]
- 18.Kudo S, Tamura S, Nakajima T, et al. Diagnosis of colorectal tumorous lesions by magnifying endoscopy. Gastrointest Endosc 1996;44(1):8–14. [DOI] [PubMed] [Google Scholar]
- 19.Chang LC, Tu CH, Lin BR, et al. Adjunctive use of chromoendoscopy may improve the diagnostic performance of narrow-band imaging for small sessile serrated adenoma/polyp. J Gastroenterol Hepatol 2018;33(2):466–74. [DOI] [PubMed] [Google Scholar]
- 20.Sakata S, Lee AHS, Kheir AO, et al. Patient acceptance of the optical diagnosis and misdiagnosis of diminutive colorectal polyps. Gastrointest Endosc 2017;86(2):372–5.e2. [DOI] [PubMed] [Google Scholar]
- 21.Tan T, Qu YW, Shu J, et al. Diagnostic value of high-resolution micro-endoscopy for the classification of colon polyps. World J Gastroenterol 2016;22(5):1869–76. [DOI] [PMC free article] [PubMed] [Google Scholar]
- 22.Liu L, Gardecki JA, Nadkarni SK, et al. Imaging the subcellular structure of human coronary atherosclerosis using micro-optical coherence tomography. Nat Med 2011;17(8):1010–4. [DOI] [PMC free article] [PubMed] [Google Scholar]
- 23.Chen S, Liu X, Wang N, et al. Visualizing micro-anatomical structures of the posterior cornea with micro-optical coherence tomography. Sci Rep 2017;7(1):10752. [DOI] [PMC free article] [PubMed] [Google Scholar]
- 24.Cui D, Chu KK, Yin B, et al. Flexible, high-resolution micro-optical coherence tomography endobronchial probe toward in vivo imaging of cilia. Opt Lett 2017;42(4):867–70. [DOI] [PMC free article] [PubMed] [Google Scholar]
- 25.Luo Y, Cui D, Yu X, et al. Endomicroscopic optical coherence tomography for cellular resolution imaging of gastrointestinal tracts. J Biophotonics 2018;11(4):e201700141. [DOI] [PubMed] [Google Scholar]
- 26.Yu X, Luo Y, Liu X, et al. Toward high-Speed imaging of cellular structures in rat colon using micro-optical coherence tomography. IEEE Photon J 2016;8(4):1–8. [Google Scholar]
- 27.Yu X, Liu X, Chen S, et al. High-resolution extended source optical coherence tomography. Opt Express 2015;23(20):26399–413. [DOI] [PubMed] [Google Scholar]
- 28.Posner KL, Sampson PD, Caplan RA, et al. Measuring interrater reliability among multiple raters: An example of methods for nominal data. Stat Med 1990;9(9):1103–15. [DOI] [PubMed] [Google Scholar]
- 29.Landis JR, Koch GG. The measurement of observer agreement for categorical data. Biometrics 1977;33(1):159–74. [PubMed] [Google Scholar]
- 30.Iwatate M, Ikumoto T, Hattori S, et al. NBI and NBI combined with magnifying colonoscopy. Diagn Ther Endosc 2012;2012:173269. [DOI] [PMC free article] [PubMed] [Google Scholar]
- 31.Zhu Y, Gao W, Zhou Y, et al. Rapid and high-resolution imaging of human liver specimens by full-field optical coherence tomography. J Biomed Opt 2015;20(11):116010. [DOI] [PubMed] [Google Scholar]
- 32.Kuiper T, van den Broek FJ, van Eeden S, et al. New classification for probe-based confocal laser endomicroscopy in the colon. Endoscopy 2011;43(12):1076–81. [DOI] [PubMed] [Google Scholar]
- 33.Buchner AM, Shahid MW, Heckman MG, et al. Comparison of probe-based confocal laser endomicroscopy with virtual chromoendoscopy for classification of colon polyps. Gastroenterology 2010;138(3):834–42. [DOI] [PubMed] [Google Scholar]
- 34.Kuiper T, Kiesslich R, Ponsioen C, et al. The learning curve, accuracy, and interobserver agreement of endoscope-based confocal laser endomicroscopy for the differentiation of colorectal lesions. Gastrointest Endosc 2012;75(6):1211–7. [DOI] [PubMed] [Google Scholar]
- 35.Chang SS, Shukla R, Polydorides AD, et al. High resolution microendoscopy for classification of colorectal polyps. Endoscopy 2013;45(7):553–9. [DOI] [PubMed] [Google Scholar]
- 36.Parikh ND, Perl D, Lee MH, et al. In vivo diagnostic accuracy of high-resolution microendoscopy in differentiating neoplastic from non-neoplastic colorectal polyps: A prospective study. Am J Gastroenterol 2014;109(1):68–75. [DOI] [PMC free article] [PubMed] [Google Scholar]
- 37.Parikh ND, Perl D, Lee MH, et al. In vivo classification of colorectal neoplasia using high-resolution microendoscopy: Improvement with experience. J Gastroenterol Hepatol 2015;30(7):1155–60. [DOI] [PMC free article] [PubMed] [Google Scholar]
- 38.Grieve K, Palazzo L, Dalimier E, et al. A feasibility study of full-field optical coherence tomography for rapid evaluation of EUS-guided microbiopsy specimens. Gastrointest Endosc 2015;81(2):342–50. [DOI] [PubMed] [Google Scholar]
- 39.Torlakovic E, Skovlund E, Snover DC, et al. Morphologic reappraisal of serrated colorectal polyps. Am J Surg Pathol 2003;27(1):65–81. [DOI] [PubMed] [Google Scholar]
- 40.Murakami T, Sakamoto N, Nagahara A. Endoscopic diagnosis of sessile serrated adenoma/polyp with and without dysplasia/carcinoma. World J Gastroenterol 2018;24(29):3250–9. [DOI] [PMC free article] [PubMed] [Google Scholar]
- 41.Murino A, Hassan C, Repici A. The diminutive colon polyp: Biopsy, snare, leave alone? Curr Opin Gastroenterol 2016;32(1):38–43. [DOI] [PubMed] [Google Scholar]
- 42.Wilson AI, Saunders BP. New paradigms in polypectomy: Resect and discard, diagnose and disregard. Gastrointest Endosc Clin N Am 2015;25(2):287–302. [DOI] [PubMed] [Google Scholar]
Associated Data
This section collects any data citations, data availability statements, or supplementary materials included in this article.


