

Abstract
Background:
Diagnosis of paradoxical tuberculosis-associated immune reconstitution inflammatory syndrome (TB-IRIS) is challenging and new tools are needed for early diagnosis as well as to understand the biochemical events that underlie the pathology in TB-IRIS.
Methods:
Plasma samples were obtained from participants from a randomized HIV/TB treatment strategy study (AIDS Clinical Trials Group [ACTG] A5221) with (n = 26) and without TB-IRIS (n = 22) for an untargeted metabolomics pilot study by liquid-chromatography mass spectrometry. The metabolic profile of these participants was compared at the study entry and as close to the diagnosis of TB-IRIS as possible (TB-IRIS window). Molecular features with p < 0.05 and log2 fold change ≥0.58 were submitted for pathway analysis through MetaboAnalyst. We also elucidated potential metabolic signatures for TB-IRIS using a LASSO regression model.
Results:
At the study entry, we showed that the arachidonic acid and glycerophospholipid metabolism were altered in the TB-IRIS group. Sphingolipid and linoleic acid metabolism were the most affected pathways during the TB-IRIS window. LASSO modeling selected a set of 8 and 7 molecular features with the potential to predict TB-IRIS at study entry and during the TB-IRIS window, respectively.
Conclusion:
This study suggests that the use of plasma metabolites may distinguish HIV-TB patients with and without TB-IRIS.
Keywords: AIDS, Tuberculosis, IRIS, Metabolomics, Biosignature features
Introduction
The human immunodeficiency virus (HIV) causes functional disruption of the immune response and impairs host ability to control infection by Mycobacterium tuberculosis (Walker et al., 2013) – the etiological agent of tuberculosis (TB). In 2017, there were 10 million cases of TB, of which 900,000 (9%) were co-infected with HIV (WHO, 2018). The World Health Organization recommends that all persons with HIV and active TB be promptly treated with antiretroviral therapy (ART) in order to reduce morbidity and mortality (WHO, 2017). New data demonstrates that treatment with corticosteroids is beneficial (Meintjes et al., 2018).
ART can rapidly restore the numbers of CD4+ T cells of HIV-TB co-infected patients; however, this rapid restoration of the immune system can trigger an immune reconstitution inflammatory syndrome, known as TB-IRIS (Barber et al., 2012). This syndrome is characterized by strong pathogen-specific immune responses to M. tuberculosis antigens [reviewed in Lai et al. (2016)], which paradoxically results in worsening symptoms of TB during ART. About 18% of HIV-TB co-infected patients exhibit this syndrome (Namale et al., 2015), which can lead to substantial morbidity, death, and added health care costs. Currently, there are no diagnostic tests for TB-IRIS and, therefore, diagnosis is based on clinical case definitions (Lai et al., 2016).
Immune-inflammatory mechanisms associated with TB-IRIS are incompletely defined and further investigations may allow the discovery of predictive markers for this pathology. This may also allow preemptive treatment to reduce morbidity and mortality associated with TB-IRIS. Most efforts to discover predictive markers have focused on immunological aspects of this disease (Chakrabarti et al., 2014; Esmail et al., 2018; George et al., 2017; Narendran et al., 2016; Rateni et al., 2018; Rohlwink et al., 2019; Tan et al., 2015) however, few studies have evaluated the possible metabolic alterations associated with TB-IRIS.
Metabolomics is a powerful tool to identify potential contributors to disease, as well as for the discovery of metabolic biosignatures within biofluids (e.g., sera and plasma samples), cells, and tissues (Klassen et al., 2017). The application of metabolomics has demonstrated that the metabolism of the human host is altered in mycobacterial diseases (Al-Mubarak et al., 2011; Isa et al., 2018; Mahapatra et al., 2014; Mayboroda et al., 2016; Silva et al., 2017; Weiner et al., 2012). Therefore, we hypothesized that patients who developed TB-IRIS (TB-IRIS group) would exhibit metabolic differences in comparison with patients that did not manifest TB-IRIS symptoms (non-IRIS group), and these differences would be detectable even before the onset of TB-IRIS. To test our hypothesis, a liquid chromatography-mass spectrometry (LC-MS) based untargeted metabolomics study was performed on stored plasma from the AIDS Clinical Trials Group (ACTG) A5221 study (Havlir et al., 2011). This study was designed primarily to determine the best time to begin anti-HIV treatment in individuals who have HIV and tuberculosis.
Materials and methods
Ethics
Institutional Review Boards approvals were obtained via the ACTG study A5221 (Havlir et al., 2011) and via the standard in-country approval process.
Study population
A5221 was a randomized trial of early antiretroviral therapy (ART) (within 2 weeks after TB treatment initiation) versus late ART (8-12 weeks after TB treatment) in 806 HIV-infected patients starting TB treatment for confirmed or probable TB; the study design and primary results were published elsewhere (Havlir et al., 2011, Luetkemeyer et al., 2014). Eight percent developed TB-IRIS. All participants received efavirenz, tenofovir, and emtricitabine, and 1-14 days of rifamycin-based TB treatment prior to entry. Participants were considered to have confirmed TB by acid-fast bacilli smear or culture typically of sputum or lymph node aspirates. The diagnosis of probable TB was based on expert clinician assessment of signs and symptoms that warranted empiric TB treatment (Havlir et al., 2011). TB-IRIS was defined as in Havlir et al. (2011) and Luetkemeyer et al. (2014) and based on the widely accepted INSHI definition (Meintjes et al., 2008).There were 61 TB-IRIS cases observed in A5221. Participants were eligible for the study if there was both a sample at study entry and one collected within 4 weeks before or after TB-IRIS diagnosis. Each TB-IRIS case was retrospectively matched to one control by baseline HIV viral load (within 0.5 log10 copies/mL) and baseline CD4 cell count (within 2 cells when CD4 < 10 cells/mm3, within 5 cells when CD4 < 100 cells/mm3, and within 10 cells if CD4 <250 cells/mm3). The control also had samples at study entry and matched to the case’s sample based on the timing of TB-IRIS. Due to sample unavailability, 26 TB-IRIS cases were included.
Sample collection
EDTA-plasma samples from TB-IRIS (n = 26) and non-IRIS (n = 22) groups were collected at study entry (red circles in Figure 1) and as close to the diagnosis of TB-IRIS as possible (TB-IRIS window; blue circles in Figure 1). Black circles in Figure 1B represent the time of TB-IRIS diagnosis in the participants (“onset” of TB-IRIS) relative to start of study-provided ART (week 0). The number of plasma samples for the non-IRIS and TB-IRIS groups at each time point was slightly different from the total numbers of individuals enrolled in the study since some samples were absent in the biobank (Figure 1 and Table 1). For the TB-IRIS group, 25 samples were collected at the study entry and 22 were from the TB-IRIS window (participants were eligible for the study, but not all samples were available from the biobank). For the non-IRIS group, 20 samples were used at study entry and 18 at a second time point matched to the TB-IRIS window for participants developing TB-IRIS.
Figure 1.
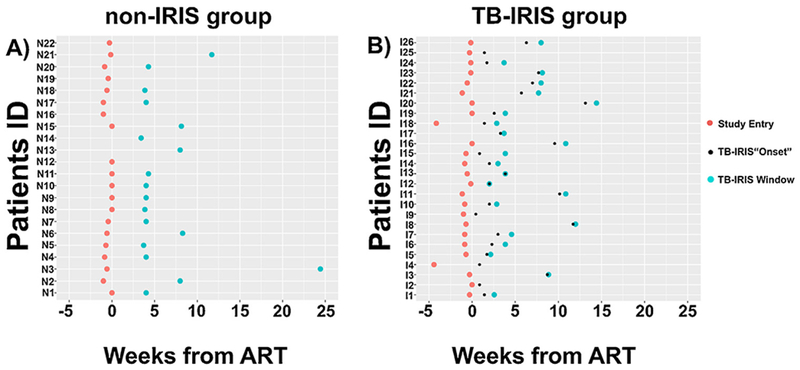
Time distribution of TB-IRIS and non-IRIS samples used. The time points (in weeks) that the plasma samples from the non-IRIS (A) and TB-IRIS (B) groups were collected with respect to the beginning of antiretroviral therapy (ART). Time point zero represents the beginning of ART. Red circles represent the first time in which the plasma samples were collected (Study Entry). None of the participants from the non-IRIS and TB-IRIS groups exhibited clinical symptoms of TB-IRIS at study entry. Small black circles represent the time points that participants from the TB-IRIS group were diagnosed with TB-IRIS (TB-IRIS “Onset”). Blue circles denote the time point for plasma collection within the TB-IRIS window (the time when TB-IRIS was diagnosed, with timing for the non-IRIS controls matched at the same time point). None of the participants from the non-IRIS group exhibited clinical symptoms of TB-IRIS.
Table 1.
Summary of Participant Clinical and Demographic Characteristics.
| Characteristic | non-IRIS (n = 22) |
TB-IRIS (n = 26) |
||
|---|---|---|---|---|
| Study Entry 20a |
TB-IRIS Window 18a |
Study Entry 25a |
TB-IRIS Window 22a |
|
| Female sex (%) | 50 | 61 | 36 | 41 |
| Probable tuberculosis (%) | 55 | 61 | 12 | 9 |
| Weight (kg; median) | 56.4 | 52.0 | 57.3 | 53.2 |
| Age (median) | 35 | 36 | 31 | 34 |
| Plasma hemoglobin (g/dL; median) | 11.1 | 10.8 | 9.3 | 9.0 |
| Albumin, (g/dL; median) | 26.5 | 24.0 | 25.0 | 24.0 |
| Absolute CD4+ cells count (cells/mm3; median) | 37 | 36 | 29 | 28 |
| HIV viral load (log10 copies/mL; median) | 5.57 | 5.64 | 5.64 | 5.62 |
| Country | ||||
| Botswana | 0 | 0 | 1 | 1 |
| Brazil | 2 | 3 | 4 | 5 |
| Haiti | 2 | 2 | 0 | 0 |
| Malawi | 4 | 4 | 0 | 0 |
| South Africa | 12 | 9 | 16 | 13 |
| United States | 0 | 0 | 3 | 2 |
| Uganda | 0 | 0 | 1 | 1 |
Plasma samples from participants that developed (TB-IRIS; n = 26) and did not develop TB-IRIS (non-IRIS; n = 22) were collected at the time that the participant was enrolled in the study (Study Entry) and as close to the diagnosis of TB-IRIS as possible (TB-IRIS Window).
Represents the numbers of plasma samples that were used in the study.
Metabolite extraction and LC-MS
Metabolites were extracted from plasma aliquots (80 μL) by incubation with 3 volumes of cold methanol for 1 h at −20 °C as described previously (Al-Mubarak et al., 2011) with some modifications (Supplemental Methods). Plasma metabolites were analyzed by LC-MS in negative and positive ionization modes. For the positive mode, an aliquot corresponding to 10 μL of plasma was applied to LC-MS analysis (Supplemental Methods). The order of sample injection was randomized. Chromatographic separation of metabolites was performed using an Agilent Poroshell 120 EC-C8 Column (2.7 μm particle size; 2.1 mm × 100 mm) with a gradient of 100% water with 0.1% formic acid (Solvent A) to 100% methanol and 0.1% formic acid (solvent B). Specifically, metabolites were applied to the column in Solvent A followed by an 8 min linear gradient to 20% Solvent B and a 4 min gradient to 100% Solvent B, which was held for 4 min. The solvent flow rate was 350 μL/min, column temperature was 30 °C and sample temperature was 4 °C. Further details are in Supplemental Methods. For LC-MS analyses in negative mode, the conditions used were described in Silva et al. (2017). In negative mode, the samples were analyzed in triplicate (20 μL for each injection). The order for sample injection for LC-MS analysis for both ionization modes, including the triplicates in negative mode, was randomized. A qualitative analysis was based on the peak area of the features.
Data processing and statistical analysis
Separately for the negative ion and positive ion mode data, all raw LC-MS data files were processed for peak detection, retention-time correction, chromatogram alignment and molecular features annotation using XCMS package version 1.46 (Smith et al., 2006) installed in R version 3.2 (RCoreTeam, 2017). For peak detection, the algorithm centwave (Tautenhahn et al., 2008) was used. Related isotopic features were grouped and annotated using the CAMERA package version 3.2 (Kuhl et al., 2012) with default parameters. Normalization and feature filtering criteria for statistical analysis are described in Supplemental Methods.
All statistical analyses were performed using the open source software R 3.2. In the 36 participants that had samples at both time points, the peak area of each feature was log2-transformed and compared between TB-IRIS and non-IRIS groups for each time point separately using the R package limma (Ritchie et al., 2015; Smyth, 2004) (Supplemental Methods). The p-values were adjusted for false discovery rate (Benjamini and Hochberg, 1995). Features with significantly altered levels (p < 0.05 and log2 fold change [log2FC] ≥ 0.58) between TB-IRIS and non-IRIS were used for pathway analysis. Principal Components Analysis (PCA) was also performed (Supplemental Methods). Differences in sex and probable tuberculosis between non-IRIS and TB-IRIS were evaluated with Fisher’s exact test.
Pathway analysis
In order to identify metabolic pathways that differed between the TB-IRIS and non-IRIS groups, pathway analysis was performed with MetaboAnalyst 3.0 (Xia et al., 2015; Xia and Wishart, 2011) (http://www.metaboanalyst.ca/). Prior to this analysis, the accurate mass of each feature that differed significantly between the TB-IRIS and non-IRIS groups was queried against the Human Metabolome Database (HMDB, www.hmdb.ca) (Wishart et al., 2009) (mass error tolerance of +/− 10 ppm). The lists of putative metabolites generated by HMDB were imported into MetaboAnalyst and mapped to the Kyoto Encyclopedia of Genes and Genomes (KEGG) for over-representation analysis (Xia and Wishart, 2010) and pathway topology analysis. Over-representation was evaluated using hypergeometric tests and p values were adjusted using the Holm-Bonferroni correction (Dunn, 1961). Metabolic pathways with adjusted p values lower than 0.05 were considered significantly enriched. The pathway topological analysis was based on the relative betweenness centrality (Aittokallio and Schwikowski, 2006) and the pathway impact value threshold was set to >0.10 (Liao et al., 2012; Wang et al., 2012). Pathway impact values closer to 1.0 indicate a more perturbed pathway.
Predictive LASSO modeling
To determine potential diagnostic or prognostic metabolic signatures in the plasma of participants that developed TB-IRIS, predictive models were built by fitting separate LASSO regression models to all metabolites with differential abundances between TB-IRIS and non-IRIS groups at study entry and during the TB-IRIS window. Metabolite peak areas were log2-transformed and standardized as described in the data processing and statistical analysis section. A training set consisting of 64% of the 36 participants with a sample at both time points was randomly selected (n = 23); the models were tested on all samples not used for building the model (n varies depending on time point). Modeling was implemented using the R package glmnet (Friedman et al., 2010).
Results
Participant characteristics
Participant clinical and demographic characteristics are summarized in Table 1. Although there were more women in the non-IRIS group (50% and 61% at study entry and TB-IRIS window, respectively) than in TB-IRIS group (36% and 41%at study entry and TB-IRIS window, respectively), this was not statistically significant at either time point (p = 1 and 0.16, respectively). The groups were similar, except that the number of participants with probable TB in the non-IRIS group (55% and 61% at study entry and TB-IRIS window, respectively) was significantly higher than in the TB-IRIS group (12% and 9% at study entry and TB-IRIS window) at the TB-IRIS window (p = 0.32 and 0.03, respectively). The majority of the plasma samples from non-IRIS and TB-IRIS groups at study entry (red circles) were collected before the start of study-provided ART (week zero) (13 [65%] out of 20 for non-IRIS and 21 [84%] out of 25 for TB-IRIS) (Figure 1A and B). For the TB-IRIS group, that time period between the diagnoses of TB-IRIS (black circle; assumed as the “onset” of TB-IRIS) from the time of plasma collection at TB-IRIS window (blue circle) was very different for each participant (Figure 1B). Only two plasma samples from TB-IRIS group were collected at the clinic visit when TB-IRIS symptoms were identified, all other plasma samples for the TB-IRIS window were collected after the diagnosis of TB-IRIS.
Exploratory metabolomics study
LC-MS data of TB-IRIS and non-IRIS groups at both time points were processed together by XCMS. As a result, the same number of totals features were extracted for TB-IRIS versus non-IRIS groups at the study entry and at TB-IRIS window (14,888 features for the positive ion mode data and 2,610 features for the negative ion mode data). After applying the filtering criteria (Supplemental Methods), only 3628 features and 343 features from the positive and negative ion mode data, respectively, were selected for further statistical evaluations.
Statistical analysis showed that 479 features (positive ion mode) and 29 features (negative ion mode) displayed significantly altered levels in the plasma (p < 0.05 and log2FC ≥ 0.58) of TB-IRIS versus non-IRIS participants at study entry. The number of features that were higher and lower in each mode and at each time point can be seen in Table 2. A Venn diagram shows that 219 features and 9 features exhibited differential levels between TB-IRIS and non-IRIS groups at both time points in positive and negative modes, respectively (Figure 2). In contrast, 260 features presented a significant log2FC only at the study entry, while 470 features significantly differed only at TB-IRIS point (positive ion mode, Figure 2A). Likewise, with the negative ion mode data, 20 features were significantly altered only at the study entry and 34 features only during the TB-IRIS window (Figure 2B).
Table 2.
Molecular features with significantly altered levels in plasma (p < 0.05; log2FC ≥ 0.58) of TB-IRIS versus non-IRIS participants for the positive ion and negative ion modes of analysis with LC-MS.
| Lowera |
Highera |
Lowera | Highera | Positiveb | Negative | |||
|---|---|---|---|---|---|---|---|---|
| Mode | Positiveb | Negative | Positiveb | Negative | Total | Total | ||
| Study Entry | 265 | 17 | 214 | 12 | 282 | 226 | 479 | 29 |
| TB-IRIS window | 391 | 28 | 298 | 15 | 419 | 313 | 689 | 43 |
| Total | 656 | 45 | 512 | 27 | 701 | 539 | 1168 | 72 |
Level of MF in plasma of TB-IRIS compared to non-IRIS participants.
Ionization mode used in liquid-chromatography mass-spectrometry.
Figure 2.
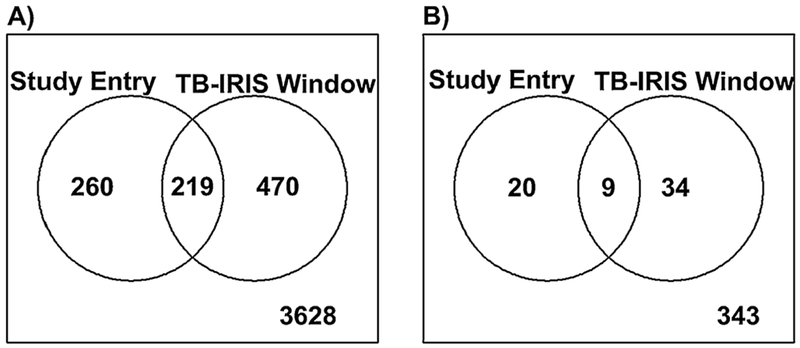
Depiction of TB-IRIS differentiating molecular features (MFs) that were common or specific based on sample time point collection. The Venn diagrams show the overlap between the Study Entry and TB-IRIS Window time points for MFs with significant abundance differences (log2 fold change (FC) ≥0.58 and p < 0.05) between the TB-IRIS and non-IRIS groups. (A) MFs identified with the positive ion mode data. (B) MFs identified with the negative ion mode data.
Principal component analysis (PCA) performed with all features retained by the filtering criteria, which included features that were not significantly different, showed no clear separation between TB-IRIS and non-IRIS groups at study entry and at TB-IRIS window for both ionization modes (Figures 3 and 4). However, a PCA performed only with features that significantly differed between TB-IRIS and non-IRIS groups revealed separation between both groups at study entry and at the TB-IRIS window (Figures 3 and 4). This suggests that features with p < 0.05 and log2FC ≥ 0.58 can be used to distinguish participants that developed TB-IRIS from the ones that did not.
Figure 3.
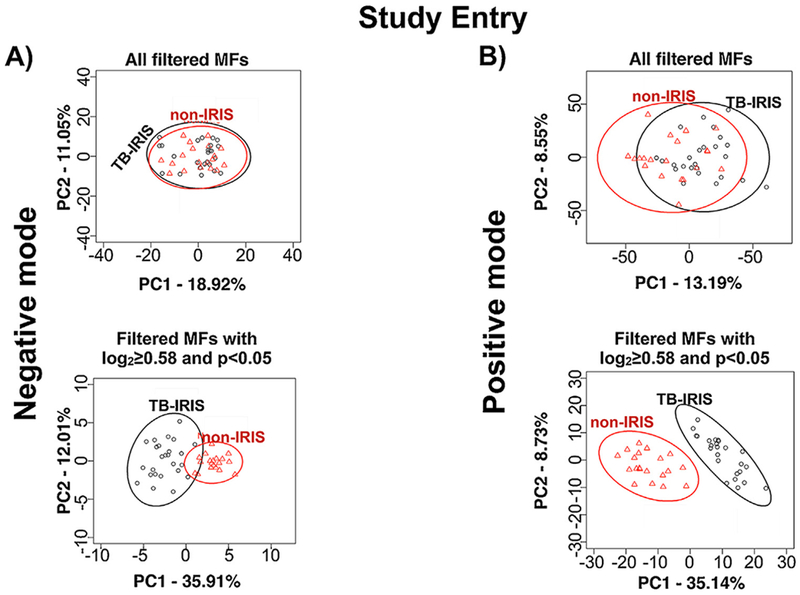
Principal component analysis (PCA) of molecular features (MFs) that differentiate the TB-IRIS and non-IRIS groups at Study Entry (before the onset of TB-IRIS). PCA was performed with MFs identified in the negative (A) and positive (B) ion mode data. The LC-MS data files were analyzed by XCMS software and MFs that were submitted for further statistical analyses were selected based on filtering criteria (Supplemental Methods). The level of separation provided by all filtered MFs is shown in the PCA panels on top. The level of separation provided by those filtered MFs that differed significantly (log2 fold change (FC) ≥ 0.58 and p < 0.05) in abundance between TB-IRIS and non-IRIS groups are shown in the lower PCA panels.
Figure 4.
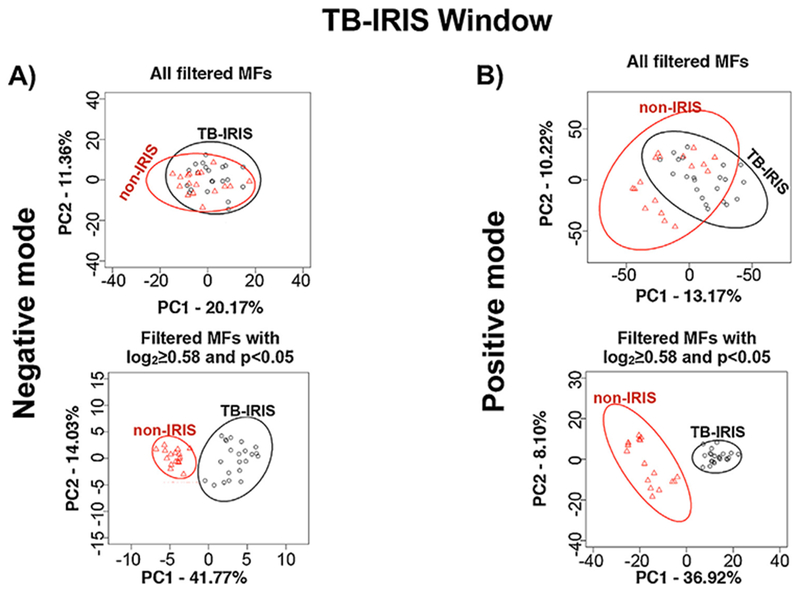
Principal component analysis (PCA) of molecular features (MFs) that differentiate the TB-IRIS and non-IRIS groups at TB-IRIS Window. PCA was performed with MFs identified from the negative (A) and positive (B) ion mode data. The LC-MS data files were analyzed by XCMS software and MFs that were used for further statistical analysis were selected based on filtering criteria (Supplemental Methods). The level of separation provided by all filtered MFs is shown in the PCA panels on top. The level of separation provided by those filtered MFs that differed significantly (log2 fold change (FC) ≥ 0.58 and p <0.05) in abundance between TB-IRIS and non-IRIS groups are shown in the lower PCA panels.
Pathway analysis
Evaluation using MetaboAnalyst (Xia et al., 2015) of potentially altered metabolic pathways revealed 13 KEGG pathways present at the study entry time point. Over-representation analysis showed that only arachidonic acid metabolism exhibited a significant number of metabolites that matched to this pathway (Table 3 and Figure 5A). However, topology analysis showed that the metabolites found in arachidonic acid metabolism had a low impact value (0.044). On the other hand, the results of topology analysis demonstrated that glycerophospholipid metabolism displayed the greatest impact value (0.228) followed by linoleic acid metabolism (0.114) (Table 3).
Table 3.
Metabolic Pathway Analysis for Study Entry and TB-IRIS Window Time Points.
| Pathway | Totala | Hitsb | Raw p valuec | Holm adjusted p valued | Impact valuee |
|---|---|---|---|---|---|
| Study Entry Time Point | |||||
| Glycerophospholipid metabolism | 39 | 2 | 0.34 | >0.99 | 0.228 |
| Linoleic acid metabolism | 15 | 3 | 0.01 | 0.80 | 0.115 |
| Arachidonic acid metabolism | 62 | 11 | <0.0001 | 0.0001 | 0.044 |
| TB-IRIS Window Time Point | |||||
| Sphingolipid metabolism | 25 | 2 | 0.23 | >0.99 | 0.140 |
| Linoleic acid metabolism | 15 | 3 | 0.001 | 0.09 | 0.115 |
| Glycerophospholipid metabolism | 39 | 2 | 0.11 | >0.99 | 0.104 |
Total is the total numbers of compounds in the pathway.
Hits represents the number of metabolites that matched with the metabolites of the Human Metabolome Database (HMDB) based on the accurate mass of each MF that differed significantly (p <0.05 and log2FC >0.58) between TB-IRIS and non-IRIS. The mass error tolerance used for HMDB search was +/− 10 ppm.
The original p value calculated from the over-representation analysis.
The p value adjusted by Holm-Bonferroni method.
The impact value is calculated from the pathway topology analysis. See also supplementary Tables 1 and 2 to known the compounds putatively identified.
Figure 5.
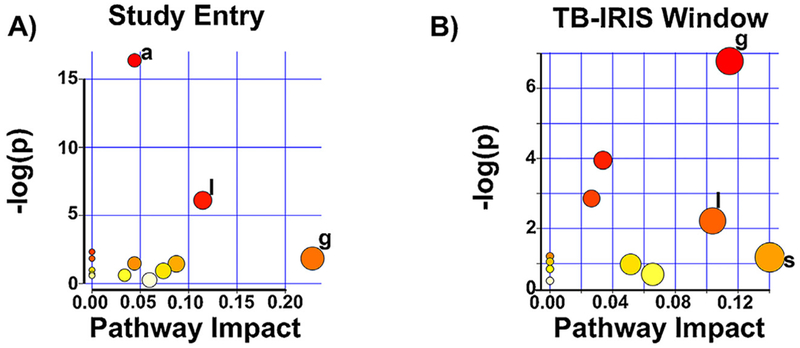
Metabolic pathways predicted to be altered between participants that presented with TB-IRIS versus those that did not. Summary plots of metabolic pathways predicted to be altered between the TB-IRIS and non-IRIS participants based on enrichment (y-axis) and topology (x-axis) analyses are shown. The significance and impact of specific metabolic pathways differs for TB-IRIS versus non-IRIS pathways at the two time points evaluated. Study Entry (A) and TB-IRIS Window (B). −log(p) is the negative natural log of the raw p values (p values not corrected for multiple comparison analysis). Only pathways with p < 0.05 and/or pathway impact value > 0.10 are marked. g = glycerophospholipid metabolism; l = linoleic acid metabolism; a = arachidonic acid metabolism; s = sphingolipid metabolism.
During the TB-IRIS window, 11 KEGG pathways were mapped, but none of them had a significant number of matched metabolites (Table 3 and Figure 5B). Topology analysis showed that the metabolic pathways with highest impact values were sphingolipid metabolism (0.1402), linoleic acid (0.114) and glycerophospholipid metabolism (0.103).
Predictive LASSO model
LASSO regression models were fitted to the randomly selected training set of 23 participants for whom we had samples at both time points. Peak areas of metabolites were transformed as previously described. Separate models were constructed for the study entry and TB-IRIS window data. The LASSO model training with the LC-MS data determined which features could distinguish TB-IRIS versus non-IRIS patient samples. Our pathway analyses indicated major contributions from arachidonic acid, linoleic acid and glycerophospholipid metabolism in the separation of TB-IRIS versus non-IRIS patient samples. The metabolites of these pathways are detected more robustly by MS as anions. Thus, the LC-MS negative-ion mode data was targeted for predictive model development and testing.
Using the LC-MS negative-ion data, the LASSO analysis identified 8 features as being nearly perfectly predictive on a test group at the study entry time point (sensitivity for TB-IRIS = 0.92, specificity = 1.00) and 6 features as nearly perfectly predictive on a test group for the TB-IRIS window (sensitivity = 0.89, specificity = 1.00). The high classification accuracy supports a strong potential for a predictive biosignature. Although, a test group of samples was withheld from model development, it must be noted that these test samples were used in the identification of the initial biosignatures. Thus, the models may be subject to some overfitting. Of note, the majority of features were not identified after interrogation against HMDB database (Table 4). Further investigation is needed to define the structures of these metabolites and additional patient samples are required to further test the TB-IRIS versus non-IRIS classification models.
Table 4.
Molecular Features that Predict TB-IRIS for Study Entry and TB-IRIS Window Time Points.
| Molecular Features (m/z-retention time pair) | Human Metabolome database hits |
|---|---|
| Study Entry Time Point | |
| 121.037-6.17 | No hits |
| 126.993-9.72 | No hits |
| 200.129-7.37 | Capryloylglycine |
| N-(5-methyl-3-oxohexyl)alanine | |
| Valproylglycine | |
| 2-(acetylamino)Octanoic acid | |
| 265.178-14.95 | No hits |
| 295.170-11.41 | Ethinyl estradiol |
| Exemestane | |
| 5-methoxy-1,7-diphenyl-3-heptanone | |
| 17-alpha-ethinyl estradiol | |
| 343.224-13.09 | No hits |
| 357.278-17.03 | 1-phenyl-1,3-octadecanedione |
| Tetracosapentaenoic acid (24:5n-3) | |
| Tetracosapentaenoic acid (24:5n-6) | |
| 568.395-17.21 | No hits |
| TB-IRIS Window Time Point | |
| 126.993-9.72 | No hits |
| 158.116-6.46 | No hits |
| 288.938-14.34 | No hits |
| 411.382-17.9 | No hits |
| 550.241-8.66 | Endoxifen O-glucuronide |
| 1238.748-12.32 | No hits |
This table shows the putative identification for each molecular feature (MF) identified by LASSO analysis obtained through the interrogation of the accurate mass from each MF against Human Metabolome Database (HMDB). Mass error tolerance of +/−10 ppm.
Discussion
This proof-of-concept study identified several host metabolites as well as metabolic pathways that were perturbed in TB-IRIS patients compared to a non-IRIS cohort, suggesting that metabolic profiling has the potential as a new tool for early diagnosis of TB-IRIS.
Our findings also support the concept that immune-inflammatory responses are linked with metabolic alterations (Ganeshan and Chawla, 2014). We observed a limited number of metabolic pathways involved at study entry and in the TB-IRIS window. Pathway analysis performed by MetaboAnalyst provided an exploratory tool that integrated over-representation and pathway topology analysis (Xia et al., 2015) to assess pathways that were perturbed in TB-IRIS patients. The over-representation analysis evaluated whether a particular pathway was statistically more represented than others (Goeman et al., 2004), while topology analysis evaluated the relative importance of the metabolites in a metabolic pathway based on their relative locations in a pathway (Aittokallio and Schwikowski, 2006). Pathway analysis suggests that arachidonic acid metabolism was significantly enriched at study entry, but was not perturbed per the topology analysis. Our search in the HMDB database indicated that, at study entry, hydroxyeicosatetraenoic acids (HETEs) were significantly increased in the TB-IRIS group. HETEs have a limited role in arachidonic acid metabolism, which explains why this pathway was not perturbed despite being significantly enriched in the TB-IRIS group, since metabolites with a peripheral position in a specific pathway will trigger a lower MetaboAnalyst impact score for that pathway.
Related to arachidonic acid metabolism, linoleic acid metabolism was also altered in TB-IRIS patients at study entry and in the TB-IRIS window of time. Linoleic acid is another ω6-polyunsaturated fatty acid (PUFA) that serves as a precursor for arachidonic acid (Choque et al., 2014). In addition, linoleic acid gives rise to a specific series of oxidized mono-unsaturated and poly-unsaturated fatty acids (Santoro et al., 2013). An evaluation of the putative structures identified by interrogation of the HMDB database indicated increased levels of the 9-Hydroxy-octadecadienoic (9-HODE) precursor (Choque et al., 2014), and 9-Hydroperoxy-octadecadienoic (9-HPODE), both products of linoleic acid oxidation. 9-HODE has been shown to elicit strong pro-inflammatory activity in the skin (Hattori et al., 2008) and, therefore, greater production of 9-HODE could be postulated to enhance the immune-inflammatory response in TB-IRIS. 9-HPODE is also a constituent of the low density lipoproteins oxidized by human monocytes (Folcik et al., 1995) and increased levels of this compound might indicate higher oxidative stress in TB-IRIS patients. Although HIV-TB co-infected patients have a higher oxidative stress than HIV mono-infected patients (Awodele et al., 2012), it is unknown whether TB-IRIS patients experience more oxidative stress.
Collectively, the results of our study provide evidence that PUFA metabolism is altered in patients that develop TB-IRIS as compared to the patients without TB IRIS. Such a result is not surprising as the PUFAs give rise to lipid mediators such as prostaglandins, leukotrienes, lipoxins, and resolvins that have pro-inflammatory and pro-resolving activities (Spite et al., 2014). Bell et al. recently demonstrated via proteomic analyses that stimulation of mononuclear cells from TB-IRIS subjects with M. tuberculosis antigens produced an inflammatory response with higher magnitude and a greater number of inflammation and immune pathways activated (Bell et al., 2017). Thus, altered PUFA metabolism would be expected based on the conclusions derived from proteomic analyses. Additionally, in TB-IRIS there is an abrupt activation of a pro-inflammatory Th1 response (Andrade et al., 2015), as observed in leprosy patients with type 1 reactions. We recently found leprosy type 1 reactions were associated with an inversion of the pro-resolving and pro-inflammatory lipid mediators (Silva et al., 2017). Together, with our current study, these findings provide support for additional studies that specifically target the role of PUFA metabolism and lipid mediators in the pathogenesis of TB-IRIS. Alterations in glycerophospholipid and sphingolipid metabolism during the TB-IRIS window were also observed. The reported involvement of these pathways with inflammation in others diseases, such as atherosclerosis (Dang et al., 2016) and Alzheimer’s disease (Han et al., 2011), also make them interesting targets for further study in TB-IRIS.
Evaluation of the diagnostic or prognostic potential of metabolite profiling by LASSO modeling revealed a small set of metabolites identified in the LC-MS negative-ion data as potential signatures for TB-IRIS patients. Others have demonstrated that a biomarker signature is more specific and accurate than the use of a single metabolite for making predictions (Maertzdorf et al., 2014). Thus, the metabolite set revealed by LASSO for both time points might be able to predict and identify patients with TB-IRIS. However, it is important to highlight that our LASSO modeling was performed with a small sample size and with samples used for the original selection of differentiating features. Additional studies with a larger number of patients are needed to confirm the utility of our metabolic signatures as a diagnostic tool for TB-IRIS. Such studies would need to include plasma from patients with other clinical illnesses including IRIS in HIV patients co-infected with other pathogens. Such studies would not only assess the specificity of a TB-IRIS metabolic signature, but would also allow evaluation of the overlap or dissimilarity in the metabolic pathways altered with the various co-infections of HIV that are associated with IRIS.
Another limitation is that a few participants were missing samples for either the study entry or the TB-IRIS window, lowering the number of samples available for statistical tests and modeling. In addition, the window of TB-IRIS diagnostic time point was rather broad and, therefore, the samples were not necessarily drawn at the point of maximum symptoms. This was unavoidable since the A5221 protocol required samples to be collected as soon as possible after TB-IRIS presentation. Thus, the majority of plasma samples collected from the participants were close to the time of diagnosis of TB-IRIS. Since TB-IRIS takes 3-18 months to resolve (Massiliano and Sandro, 2016), all plasma samples were collected when the individuals were experiencing TB-IRIS symptoms. In addition, the inclusion of probable TB is in accordance with clinical practice, but we acknowledge that a microbiologically confirmed diagnosis would have been more rigorous. Although the TB-IRIS group had lower numbers of women in comparison with the non-IRIS group, the difference was not statistically significant (p = 0.61) and there was no evidence of sex influence in the development of TB-IRIS (Karmakar et al., 2011; Lawn et al., 2007). In addition, we were able to use clinical samples from individuals that were similar with respect to HIV viral load and CD4 cell count at baseline.
The current work provides evidence that TB-IRIS patients have a distinct metabolic profile from patients without TB-IRIS and that these differences in TB-IRIS metabolism might be used to discover biosignatures that can predict and diagnose the development of TB-IRIS. Properly designed prospective clinical trials that include a larger number of participants will be crucial to confirm and validate our findings. In conclusion, our findings open new avenues for the discovery of metabolic biomarkers signatures for TB-IRIS.
Supplementary Material
Acknowledgments
This project has been funded by the United States Food and Drug Administration Grant No. 1U18FD004038-01, and National Institute of Allergy and Infectious Diseases grant U01 AI115619. The authors thank the participants enrolled in ACTG study A5221, Christina Blanchard-Horan and Nefertari Johnson for IRB assistance as well as Dr. Thomas Campbell for support and helpful comments.
Footnotes
Conflict of interest
MD is currently a consultant to Crestone, Inc.
Appendix A. Supplementary data
Supplementary material related to this article can be found, in the online version, at doi:https://doi.org/10.1016/j.ijid.2019.04.015.
References
- Aittokallio T, Schwikowski B. Graph-based methods for analysing networks in cell biology. Brief Bioinform 2006;7(3):243–55. [DOI] [PubMed] [Google Scholar]
- Al-Mubarak R, Vander Heiden J, Broeckling CD, Balagon M, Brennan PJ, Vissa VD. Serum metabolomics reveals higher levels of polyunsaturated fatty acids in lepromatous leprosy: potential markers for susceptibility and pathogenesis. PLoS Ngl Trop Dis 2011;5(9):e1303. [DOI] [PMC free article] [PubMed] [Google Scholar]
- Andrade PR, Pinheiro RO, Sales AM, Illarramendi X, Barbosa MG, Moraes MO, et al. Type 1 reaction in leprosy: a model for a better understanding of tissue immunity under an immunopathological condition. Expert Rev Clin Immunol 2015;11(3):391–407. [DOI] [PubMed] [Google Scholar]
- Awodele O, Olayemi SO, Nwite JA, Adeyemo TA. Investigation of the levels of oxidative stress parameters in HIV and HIV-TB co-infected patients.J Infect Dev Ctries 2012;6(1):79–85. [DOI] [PubMed] [Google Scholar]
- Barber DL, Andrade BB, Sereti I, Sher A. Immune reconstitution inflammatory syndrome: the trouble with immunity when you had none. Nat Rev Microbiol 2012;10(2):150–6. [DOI] [PMC free article] [PubMed] [Google Scholar]
- Bell L, Peyper JM, Garnett S, Tadokera R, Wilkinson R, Meintjes G, et al. TB-IRIS: proteomic analysis of in vitro PBMC responses to Mycobacterium tuberculosis and response modulation by dexamethasone. Exp Mol Pathol 2017;102(2):237–46. [DOI] [PMC free article] [PubMed] [Google Scholar]
- Benjamini Y, Hochberg Y. Controlling the false discovery rate: a practical and powerful approachto multiple testing.J R Stat Soc B (Methodol) 1995;(57):289–300. [Google Scholar]
- Chakrabarti LA, Boucherie C, Bugault F, Cumont MC, Roussillon C, Breton G, et al. Biomarkers of CD4+ T-cell activation as risk factors for tuberculosis-associated immune reconstitution inflammatory syndrome. Aids 2014;28(11):1593–602. [DOI] [PubMed] [Google Scholar]
- Choque B, Catheline D, Rioux V, Legrand P. Linoleic acid: between doubts and certainties. Biochimie 2014;96:14–21. [DOI] [PubMed] [Google Scholar]
- Dang VT, Huang A, Zhong LH, Shi Y, Werstuck GH. Comprehensive plasma metabolomic analyses of atherosclerotic progression reveal alterations in glycerophospholipid and sphingolipid metabolism in apolipoprotein E-deficient mice. Sci Rep 2016;6:35037. [DOI] [PMC free article] [PubMed] [Google Scholar]
- Dunn O Multiple comparisons among means. J Am Stat Assoc 1961;56:52–64. [Google Scholar]
- Esmail H, Riou C, Bruyn ED, Lai RP, Harley YXR, Meintjes G, et al. The immune response to Mycobacterium tuberculosis in HIV-1-coinfected persons. Annu Rev Immunol 2018;36:603–38. [DOI] [PubMed] [Google Scholar]
- Folcik VA Nivar-Aristy RA, Krajewski LP, Cathcart MK. Lipoxygenase contributes to the oxidation of lipids in human atherosclerotic plaques. J Clin Invest 1995;96 (1):504–10. [DOI] [PMC free article] [PubMed] [Google Scholar]
- Friedman J, Hastie T, Tibshirani R. Regularization paths for generalized linear models via coordinate descent. J Stat Softw 2010;33(1):1–22. [PMC free article] [PubMed] [Google Scholar]
- Ganeshan K, Chawla A. Metabolic regulation of immune responses. Annu Rev Immunol 2014;32:609–34. [DOI] [PMC free article] [PubMed] [Google Scholar]
- George V, Harrison L, Roach M, Li XD, Tierney C, Fischl MA, et al. Associations of plasma cytokine and microbial translocation biomarkers with immune reconstitution inflammatory syndrome. J Infect Dis 2017;216(9):1159–63. [DOI] [PMC free article] [PubMed] [Google Scholar]
- Goeman JJ, van de Geer SA, de Kort F, van Houwelingen HC. A global test for groups of genes: testing association with a clinical outcome. Bioinformatics 2004;20 (1):93–9. [DOI] [PubMed] [Google Scholar]
- Han X, Rozen S, Boyle SH, Hellegers C, Cheng H, Burke JR, et al. Metabolomics in early Alzheimer’s disease: identification of altered plasma sphingolipidome using shotgun lipidomics. PLoS One 2011;6(7)e21643. [DOI] [PMC free article] [PubMed] [Google Scholar]
- Hattori T, Obinata H, Ogawa A, Kishi M, Tatei K, Ishikawa O, et al. G2A plays proinflammatory roles in human keratinocytes under oxidative stress as a receptor for 9-hydroxyoctadecadienoic acid. J Invest Dermatol 2008;128 (5):1123–33. [DOI] [PubMed] [Google Scholar]
- Havlir DV, Kendall MA, Ive P, Kumwenda J, Swindells S, Qasba SS, et al. Timing of antiretroviral therapy for HIV-1 infection and tuberculosis. N Engl J Med 2011;365(16):1482–91. [DOI] [PMC free article] [PubMed] [Google Scholar]
- Isa F, Collins S, Lee MH, Decome D, Dorvil N, Joseph P, et al. Mass spectrometric identification of urinary biomarkers of pulmonary tuberculosis. EBioMedicine 2018;31:157–65. [DOI] [PMC free article] [PubMed] [Google Scholar]
- Karmakar S, Sharma SK, Vashishtha R, Sharma A, Ranjan S, Gupta D, et al. Clinical characteristics of tuberculosis-associated immune reconstitution inflammatory syndrome in North Indian population of HIV/AIDS patients receiving HAART. Clin Dev Immunol 2011;2011:239021. [DOI] [PMC free article] [PubMed] [Google Scholar]
- Klassen A, Faccio AT, Canuto GA, da Cruz PL, Ribeiro HC, Tavares MF, et al. Metabolomics: definitions and significance in systems biology. Adv Exp Med Biol 2017;965:3–17. [DOI] [PubMed] [Google Scholar]
- Kuhl C, Tautenhahn R, Bottcher C, Larson TR, Neumann S. CAMERA: an integrated strategy for compound spectra extraction and annotation of liquid chromatog-raphy/mass spectrometry data sets. Anal Chem 2012;84(1):283–9. [DOI] [PMC free article] [PubMed] [Google Scholar]
- Lai RP, Meintjes G, Wilkinson RJ. HIV-1 tuberculosis-associated immune reconstitution inflammatory syndrome. Semin Immunopathol 2016;38(2):185–98. [DOI] [PMC free article] [PubMed] [Google Scholar]
- Lawn SD, Myer L, Bekker LG, Wood R. Tuberculosis-associated immune reconstitution disease: incidence, risk factors and impact in an antiretroviral treatment service in South Africa. Aids 2007;21(3):335–41. [DOI] [PubMed] [Google Scholar]
- Liao W, Tan G, Zhu Z, Chen Q, Lou Z, Dong X, et al. Combined metabonomic and quantitative real-time PCR analyses reveal systems metabolic changes in Jurkat T-cells treated with HIV-1 Tat protein. J Proteome Res 2012;11(11):5109–23. [DOI] [PubMed] [Google Scholar]
- Luetkemeyer AF, Kendall MA, Nyirenda M, Wu X, Ive P, Benson CA, et al. Tuberculosis immune reconstitution inflammatory syndrome in A5221 STRIDE: timing, severity, and implications for HIV-TB programs. J Acquir Immune Defic Syndr 2014;65(4):423–8. [DOI] [PMC free article] [PubMed] [Google Scholar]
- Maertzdorf J, Kaufmann SH, Weiner J 3rd. Toward a unified biosignature for tuberculosis. Cold Spring Harb Perspect Med 2014;5(1)a018531. [DOI] [PMC free article] [PubMed] [Google Scholar]
- Mahapatra S, Hess AM, Johnson JL, Eisenach KD, DeGroote MA, Gitta P, et al. A metabolic biosignature of early response to anti-tuberculosis treatment. BMC Infect Dis 2014;14:53. [DOI] [PMC free article] [PubMed] [Google Scholar]
- Massiliano L, Sandro V. Tuberculosis-immune reconstitution inflammatory syndrome. J Clin Tuberc Mycobact Dis 2016;3:6–9. [DOI] [PMC free article] [PubMed] [Google Scholar]
- Mayboroda OA, van Hooij A, Derks R, van den Eeden SJ, Dijkman K, Khadge S, et al. Exploratory urinary metabolomics of type 1 leprosy reactions. Int J Infect Dis 2016;45:46–52. [DOI] [PubMed] [Google Scholar]
- Meintjes G, Lawn SD, Scano F, Maartens G, French MA, Worodria W, et al. Tuberculosis-associated immune reconstitution inflammatory syndrome: case definitions for use in resource-limited settings. Lancet Infect Dis 2008;8(8):516–23. [DOI] [PMC free article] [PubMed] [Google Scholar]
- Meintjes G, Stek C, Blumenthal L, Thienemann F, Schutz C, Buyze J, et al. Prednisone for the prevention of paradoxical tuberculosis-associated IRIS. N Engl J Med 2018;379(20):1915–25. [DOI] [PubMed] [Google Scholar]
- Namale PE, Abdullahi LH, Fine S, Kamkuemah M, Wilkinson RJ, Meintjes G. Paradoxical TB-IRIS in HIV-infected adults: a systematic review and meta-analysis. Future Microbiol 2015;10(6):1077–99. [DOI] [PubMed] [Google Scholar]
- Narendran G, Kavitha D, Karunaianantham R, Gil-Santana L, Almeida-Junior JL, Reddy SD, et al. Role of LTA4H polymorphism in tuberculosis-associated immune reconstitution inflammatory syndrome occurrence and clinical severity in patients infected with HIV. PLoS One 2016;11(9)e0163298. [DOI] [PMC free article] [PubMed] [Google Scholar]
- Rateni L, Lupo S, Racca L, Palazzi J, Ghersevich S. Assessing endocrine and immune parameters in human immunodeficiency virus-infected patients before and after the immune reconstitution inflammatory syndrome. Arch Endocrinol Metab 2018;62(1):64–71. [DOI] [PMC free article] [PubMed] [Google Scholar]
- RCoreTeam. R: a language and enviroment for statistical computing. R Foundation for Statistical Computing; 2017. [Google Scholar]
- Ritchie ME, Phipson B, Wu D, Hu Y, Law CW, Shi W, et al. limma powers differential expression analyses for RNA-sequencing and microarray studies. Nucleic Acids Res 2015;43(7):e47. [DOI] [PMC free article] [PubMed] [Google Scholar]
- Rohlwink UK, Walker NF, Ordonez AA, Li YJ, Tucker EW, Elkington PT, et al. Matrix metalloproteinases in pulmonary and central nervous system tuberculosis—a review. Int J Mol Sci 2019;20(6). [DOI] [PMC free article] [PubMed] [Google Scholar]
- Santoro N, Caprio S, Feldstein AE. Oxidized metabolites of linoleic acid as biomarkers of liver injury in nonalcoholic steatohepatitis. Clin Lipidol 2013;8(4):411–8. [DOI] [PMC free article] [PubMed] [Google Scholar]
- Silva CA, Webb K, Andre BG, Marques MA, Carvalho FM, de Macedo CS, et al. Type 1 reaction in patients with leprosy corresponds to a decrease in proresolving lipid mediators and an increase in proinflammatory lipid mediators. J Infect Dis 2017;215(3):431–9. [DOI] [PubMed] [Google Scholar]
- Smith CA, Want EJ, O’Maille G, Abagyan R, Siuzdak G. XCMS: processing mass spectrometry data for metabolite profiling using nonlinear peak alignment, matching, and identification. Anal Chem 2006;78(3):779–87. [DOI] [PubMed] [Google Scholar]
- Smyth GK. Linear models and empirical bayes methods for assessing differential expression in microarray experiments. Stat Appl Genet Mol Biol 2004;3: Article 3. [DOI] [PubMed] [Google Scholar]
- Spite M, Claria J, Serhan CN. Resolvins, specialized proresolving lipid mediators, and their potential roles in metabolic diseases. Cell Metab 2014;19(1):21–36. [DOI] [PMC free article] [PubMed] [Google Scholar]
- Tan HY, Yong YK, Andrade BB, Shankar EM, Ponnampalavanar S, Omar SF, et al. Plasma interleukin-18 levels are a biomarker of innate immune responses that predict and characterize tuberculosis-associated immune reconstitution inflammatory syndrome. AIDS (London, England) 2015;29(4):421–31. [DOI] [PubMed] [Google Scholar]
- Tautenhahn R, Bottcher C, Neumann S. Highly sensitive feature detection for high resolution LC/MS. BMC Bioinformatics 2008;9:504. [DOI] [PMC free article] [PubMed] [Google Scholar]
- Walker NF, Meintjes G, Wilkinson RJ. HIV-1 and the immune response to TB. Future Virol 2013;8(1):57–80. [DOI] [PMC free article] [PubMed] [Google Scholar]
- Wang X, Yang B, Sun H, Zhang A. Pattern recognition approaches and computational systems tools for ultra performance liquid chromatography-mass spectrome-try-based comprehensive metabolomic profiling and pathways analysis of biological data sets. Anal Chem 2012;84(1):428–39. [DOI] [PubMed] [Google Scholar]
- Weiner J 3rd, Parida SK, Maertzdorf J, Black GF, Repsilber D, Telaar A, et al. Biomarkers of inflammation, immunosuppression and stress with active disease are revealed by metabolomic profiling of tuberculosis patients. PLoS One 2012;7(7)e4022. [DOI] [PMC free article] [PubMed] [Google Scholar]
- WHO. Universal antiretroviral therapy (ART) for all HIV-infected TB patients. Geneva: World Health Organization; 2017. [Accessed 27 February 2017] http://www.who.int/hiv/topics/tb/art_hivpatients/en/. [Google Scholar]
- WHO. Global tuberculosis report 2018. Geneva: World Health Organization; 2018. http://apps.who.int/iris/bitstream/10665/250441/1/9789241565394-eng.pdf?ua=1. [Google Scholar]
- Wishart DS, Knox C, Guo AC, Eisner R, Young N, Gautam B, et al. HMDB: a knowledgebase for the human metabolome. Nucleic Acids Res 2009;37 (Database issue):D603–10. [DOI] [PMC free article] [PubMed] [Google Scholar]
- Xia J, Wishart DS. MSEA: a web-based tool to identify biologically meaningful patterns in quantitative metabolomic data. Nucleic Acids Res 2010;38(Web Server issue):W71–7. [DOI] [PMC free article] [PubMed] [Google Scholar]
- Xia J, Wishart DS. Web-based inference of biological patterns, functions and pathways from metabolomic data using MetaboAnalyst. Nat Protoc 2011;6 (6):743–60. [DOI] [PubMed] [Google Scholar]
- Xia J, Sinelnikov IV, Han B, Wishart DS. MetaboAnalyst 3.0–making metabolomics more meaningful. Nucleic Acids Res 2015;43(W1):W251–7. [DOI] [PMC free article] [PubMed] [Google Scholar]
Associated Data
This section collects any data citations, data availability statements, or supplementary materials included in this article.