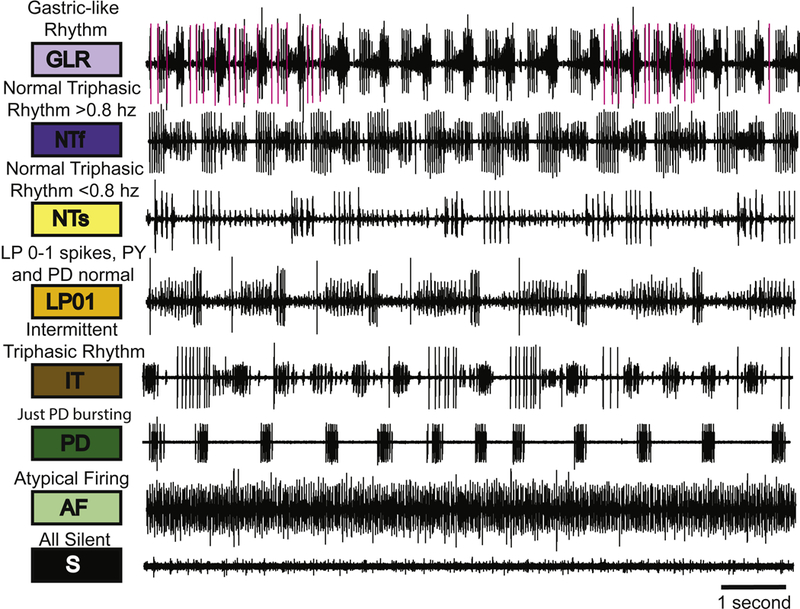
Figure 2.

The categorization system. The eight categories are illustrated with sample raw traces that represent each category used in this analysis. The colored boxes designate the color that represents that particular category. Above each box is the descriptive name of each category and the abbreviation for each category is indicated within the colored box.
