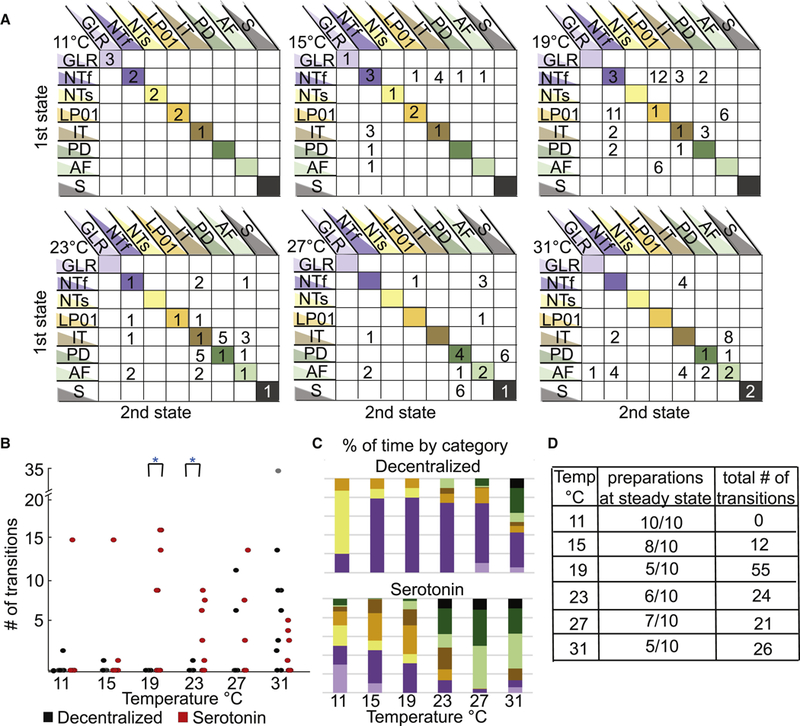
Figure 7.

Quantification of transitions seen in serotonin across temperature. A. Matrices of the cumulative data of transitions and stable activity patterns, for all the decentralized preparations (N=10) at each temperature. The y-axis rows indicate the first activity state the preparation is in, while the x-axis columns indicate the state transitioned to. The diagonal lists the number of preparations that were at that particular state for an entire temperature/file, meaning they did not transition across states for that 150 s. B. The number of transitions per preparation in the decentralized condition (black circles) and in the presence of 10−5 M serotonin (red circles) at each temperature (N=10). The number of transitions per preparation in the decentralized and serotonin conditions, when each preparation is compared in a pairwise t-test the number of transitions are significantly different at 19°C and 23°s (*p<0.01). C. Each bar represents the cumulative sums of the conditions that all the preparations were in as a function of temperature where the top bar graph is the sum of the decentralized condition and the lower bar graph is the sum of activity patterns in present in the serotonin condition. This shows that more types of activity patterns appear at lower temperatures in serotonin and as temperature is increased, more of the less stable activity patterns are present in both conditions. D. The tabulated counts of preparations at one state for an entire file (steady state) and the number of transitions counted across all preparations at each temperature in the serotonin condition.
