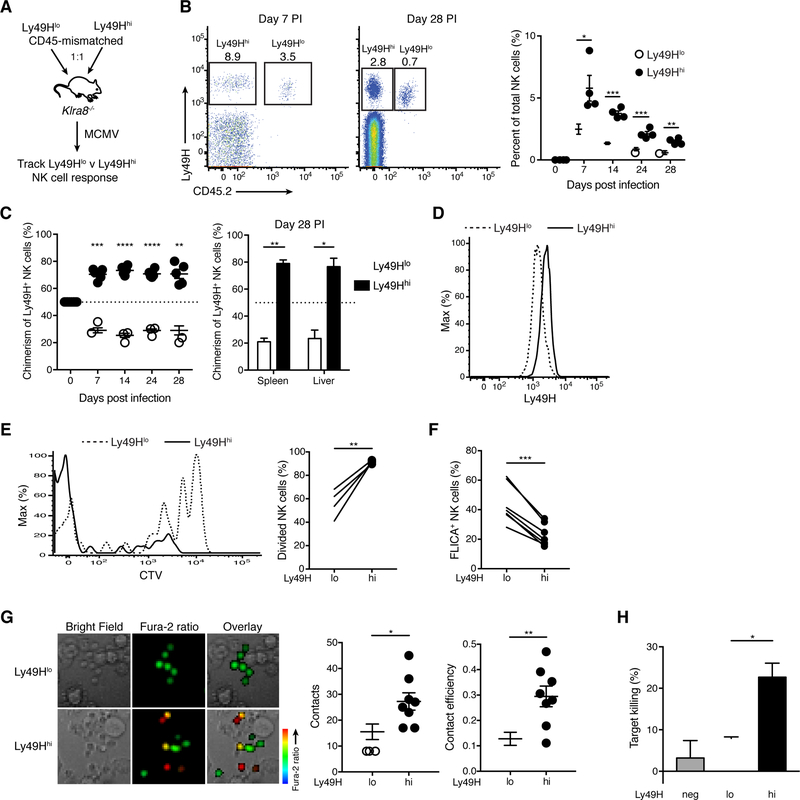
Figure 2. Ly49H+ NK cells undergo avidity selection during MCMV infection.
(A-D) Experimental schematic (A). Equal numbers of splenic Ly49Hlo and Ly49Hhi NK cells, purified from congenically distinct WT mice, were co-transferred into Klra8−/− mice, and their responses tracked following MCMV infection of the recipients. (B) Flow plots gated on NK cells from blood at day 7 PI (left) and spleen at day 28 PI (middle). Quantification of percent Ly49Hlo and Ly49Hhi NK cells within total NK cells in blood at indicated days PI (right). (C) The percentage of Ly49Hlo and Ly49Hhi NK cells within transferred Ly49H+ NK cells in blood at indicated days PI (left) and in indicated organs at day 28 PI (right). (D) Histograms of Ly49H expression on Ly49Hlo and Ly49Hhi NK cells from blood at day 7 PI. Data are representative of two independent experiments with 3–5 mice per experiment.
(E) WT splenocytes were labeled with CTV and transferred into congenically distinct WT mice prior to MCMV infection. Histograms of CTV in splenic Ly49Hlo and Ly49Hhi NK cells at day 7 PI (left). Quantification of indicated NK cell populations that have divided at least once (right). Data are representative of three independent experiments with 4 mice per experiment.
(F) Percent of splenic Ly49Hlo and Ly49Hhi NK cells staining positive for FLICA at day 4 PI. Data are pooled from two independent experiments with 3–4 mice per experiment.
(G) Purified splenic Ly49Hlo and Ly49Hhi NK cells were loaded with Fura-2AM and co-cultured with Ba/F3–m157 cells. Live-cell imaging was then performed. Representative images from the time-lapse analysis (left). Scale bar = 10 μM. Quantification of the number of contacts between NK cells and target cells (middle) and contact efficiency (right), defined as the proportion of target cell contacts that resulted in an NK cell Ca2+ flux (change in NK cell color from green to yellow or red). Data are representative of two experiments with 4 replicates per group per experiment.
(H) Purified splenic Ly49H−, Ly49Hlo, and Ly49Hhi NK cells were incubated with Ba/F3–m157 target cells (CTVhi) and Ba/F3 control cells (CTVlo) at 10:1:1 ratio (effector: target: control) for 6 hours. Quantification of target cell killing by indicated NK cell populations compared to control wells lacking NK cells. Data are representative of three independent experiments with 3 replicates per group per experiment. Ly49Hlo and Ly49Hhi NK cells were compared using an unpaired, two-tailed Student’s t test.
Groups were compared using a paired, two-tailed t test (B, E, F), an unpaired, two-tailed Student’s t test (G) or against 50 using a one sample t test (C). Data are presented as the mean ± SEM. *p < 0.05, **p < 0.01, ***p < 0.001, ****p < 0.0001. See also Figures S1 and S2.

