

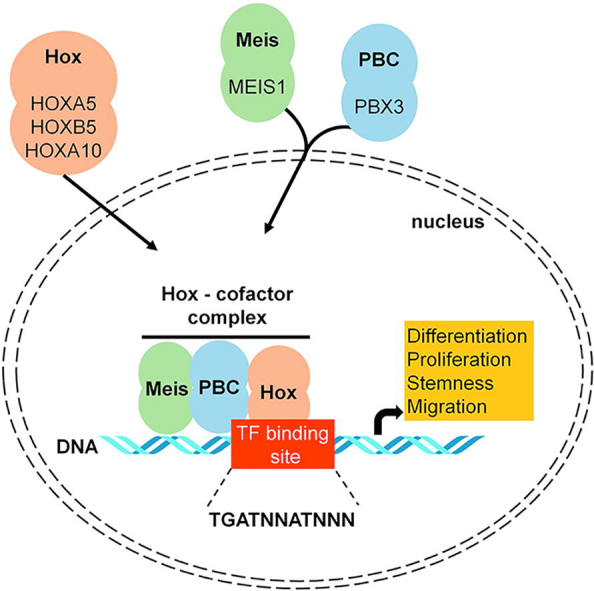
Graphical abstract
Keywords: Acute myeloid leukemia, Mutation, Gene expression, Clinical samples, HOX genes, Survival
Abbreviations: AML, acute myeloid leukemia; qPCR, quantitative polymerase chain reaction; NCBI GEO, National Center for Biotechnology Gene expression Omnibus; TCGA, The Cancer Genome Atlas; HOX, homeobox; PBX, pre-B-cell leukemia homeobox; MEIS, myeloid ecotropic viral integration site; FAB classification, French–American–British classification; WHO, World Health Organization; ITD, internal tandem duplication; OS, overall survival; HR, hazard ratio; FC, fold change
Highlights
-
•
The nucleophosmin 1 gene is a frequently mutated gene in acute myeloid leukemia.
-
•
NPM1 mutation status was connected with a gene expression signature.
-
•
HOX genes and their co-factors significantly upregulated in NPM1 mutant tumors.
-
•
The expression of these genes also correlated to survival.
-
•
HOX genes with co-factors can be therapeutic targets in NPM1 mutated AML patients.
Abstract
Acute myeloid leukemia (AML) is a clonal disorder of hematopoietic progenitor cells and the most common malignant myeloid disorder in adults. Several gene mutations such as in NPM1 (nucleophosmin 1) are involved in the pathogenesis and progression of AML. The aim of this study was to identify genes whose expression is associated with driver mutations and survival outcome. Genotype data (somatic mutations) and gene expression data including RNA-seq, microarray, and qPCR data were used for the analysis. Multiple datasets were utilized as training sets (GSE6891, TCGA, and GSE1159). A new clinical sample cohort (Semmelweis set) was established for in vitro validation. Wilcoxon analysis was used to identify genes with expression alterations between the mutant and wild type samples. Cox regression analysis was performed to examine the association between gene expression and survival outcome. Data analysis was performed in the R statistical environment. Eighty-five genes were identified with significantly altered expression when comparing NPM1 mutant and wild type patient groups in the GSE6891 set. Additional training sets were used as a filter to condense the six most significant genes associated with NPM1 mutations. Then, the expression changes of these six genes were confirmed in the Semmelweis set: HOXA5 (P = 3.06E−12, FC = 8.3), HOXA10 (P = 2.44E−09, FC = 3.3), HOXB5 (P = 1.86E−13, FC = 37), MEIS1 (P = 9.82E−10, FC = 4.4), PBX3 (P = 1.03E−13, FC = 5.4) and ITM2A (P = 0.004, FC = 0.4). Cox regression analysis showed that higher expression of these genes – with the exception of ITM2A – was associated with worse overall survival. Higher expression of the HOX genes was identified in tumors harboring NPM1 gene mutations by computationally linking genotype and gene expression. In vitro validation of these genes supports their potential therapeutic application in AML.
Introduction
Acute myeloid leukemia (AML) is characterized by clonal proliferation of myeloid blasts. Based on statistical data, AML represents approximately 1.1% of all new cancer cases in the U.S. and is more common in older adults and males. The death rate is higher among patients over 65 years and unfortunately, the rate has failed to decrease in recent years [1]. Chromosomal structural variations and genetic abnormalities play an essential role in the pathogenesis of AML [2]. According to The Cancer Genome Atlas project, the five most common mutated genes in AML comprise NPM1, IDH1, IDH2, DNMT3A, and FLT3 [3]. Isocitrate dehydrogenase 1/2 (IDH1/2) mutations occur in approximately 15% of AML patients, and the frequency increases with age [4]. Mutations in IDH1/2 are associated with DNA and histone hypermethylation, altered gene expression and blocked differentiation of hematopoietic progenitor cells [5]. The FMS-like tyrosine kinase 3 (FLT3) gene encodes a class III receptor tyrosine kinase that regulates hematopoiesis, including differentiation and proliferation of stem cells [6]. FLT3 mutations are correlated with worse clinical outcome in younger adults [7]. Activating mutations in the tyrosine kinase domain (TKD) of FLT3 exist in 15% of patients with AML.
The nucleophosmin gene (NPM1) is one of the most frequently mutated genes in AML [8]. The normal function of NPM1 is to control ribosome formation and export, stabilize the oncosuppressor p14Arf protein in the nucleolus and regulate centrosome duplication [9]. Mutations in NPM1 were found in 20–30% of AML patients. These alterations induce abnormal cytoplasmic localization of the protein which is a critical step in leukemogenesis [8]. NPM1 mutations are restricted to myeloid cells, and aberrant cytoplasmic dislocation was not observed in lymphoid cells, including the reactive lymph nodes or B and T cells from bone marrow biopsies or peripheral blood [10]. NPM1 mutations are frequently associated with internal tandem duplication (ITD) of FLT3 and DNMT3A mutations [11], [12]. In addition, besides the FLT3-ITD and DNMT3A mutations, NPM1 mutations also co-occur with IDH1, IDH2, and TET2 mutations [13]. There are mutations that rarely occur with NPM1 mutations, such as partial tandem duplication in the mixed lineage leukemia (MLL) gene and mutations in RUNX1, CEBPA, and TP53 genes [3]. FLT3 tyrosine kinase domain (TKD) mutations are rarely accompanied by NPM1 mutations [14]. A previous study described favorable prognosis of NPM1 mutated AML patients with normal karyotype [15]. Another study demonstrated that karyotype, age, NPM1 mutation status, white blood cell count, lactate dehydrogenase, and CD34 expression were independent prognostic markers for overall survival [16]. A previous study also demonstrated that IDH1 mutations are associated with favorable survival outcome in NPM1 mutant/FLT3-ITD-negative patients [17]. Currently, chemotherapy in younger and fit patients is still the primary treatment for AML patients. Chemotherapy generally includes a combination of an anthracycline, such as daunorubicin [18] or idarubicin [19], and cytarabine [20] agents. Of note, NPM1 mutated AML is highly responsive to induction chemotherapy [21], and up to 80% of patients experience complete remission with clearance of leukemic cells 16 days after starting a treatment [22]. In the last decade, several molecularly targeted agents were proposed for the treatment of AML, including tyrosine kinase inhibitors, such as sorafenib [23], midostaurin [24], quizartinib [25], and crenolanib [26] which inhibit the tyrosine kinase domain of the FLT3 kinase. STAT3 inhibitors, including C188-9 [27] and OPB-31121 [28], specifically inhibit the phosphorylation of STAT3 protein, which is highly upregulated in up to 50% of AML patients and is associated with poor prognosis. There are several additional targeted agents, such as IDH1 and IDH2 inhibitors [29], [30], nuclear export inhibitors [31] and CD33 and CD123 antigen specific inhibitors [32].
The aim was to examine the transcriptomic fingerprint of NPM1 gene mutations to shed light on transformed molecular pathways. First, genes showing altered expression in NPM1 mutated patients were identified and correlated these findings to different survival outcomes in multiple different genome-wide training sets. The best hits were validated in an independent set of patients.
Material and methods
The analysis was based on utilizing a training and a validation set (Fig. 1A). Data processing was performed in the R v3.2.3 statistical environment (http://www.r-project.org).
Fig. 1.

Training set setup. Summary of the analysis workflow (A). Proportion of driver mutations and clinical characteristics of the training sets GSE6891 (B) and TCGA (C). Distribution of the NPM1 mutation localizations in the TCGA samples (D).
Preprocessing of the training set
A suitable training AML dataset with available gene expression and clinical data was searched in the NCBI GEO repository (http://www.ncbi.nlm.nih.gov/geo/). The keywords “AML,” “GPL570” and “GPL96” were utilized, and we filtered for those datasets that included raw gene expression data and clinical information for the same patients. Array quality control was performed for all samples using the “yaqcaffy” (http://bioconductor.org/packages/yaqcaffy/) library. The background, the raw Q, the percentage of present calls, the presence of BioB-/C-/D- spikes, the GAPDH 3’ to 5’ ratio and the beta-actin 3’–5’ ratio were assessed and used only those arrays that passed the preset quality criteria. The MAS5 algorithm by the “affy” (http://bioconductor.org/packages/affy/) library was used to normalize the data. An additional second scaling normalization was made to set the mean expression on each array to 1000. For genes measured by various probe sets, we employed JetSet to choose the most trustworthy probe set [33].
RNA-seq and mutation data of AML patients
Two additional datasets were used for training, a gene-chip dataset (processed as described above) and an RNA-seq dataset. In the RNA-seq dataset, the somatic mutation data were obtained from The Cancer Genome Atlas (TCGA, https://cancergenome.nih.gov/). The preprocessed and annotated MAF (Mutation Annotation Format) data files were used generated by MuTect2, MUSE, VarScan and SomaticSniper pipelines. The “maftools” package (http://bioconductor.org/packages/maftools/) was applied for aggregation and visualization of mutation data.
The htseq counts RNA-seq data generated by the Illumina HiSeq 2000 RNA Sequencing version 2 platform was used for gene expression estimation. The “AnnotationDbi” package (http://bioconductor.org/packages/AnnotationDbi/) was applied to annotate Ensembl transcript IDs with gene symbols (n = 25,228). The “DESeq” package based on the negative binomial distribution was used to normalize the raw read counts data [34].
Semmelweis set
Clinical samples diagnosed at the 1st Department of Pathology-, and Experimental Cancer Research, Semmelweis University, Budapest, Hungary were utilized in the in vitro validation. All materials and protocols were approved by the Institutional Scientific and Research Ethics Committee of the Semmelweis University TUKEB – 14383-2/2017/EKU. Mutation status was determined by Sanger sequencing and quantitative PCR measurement was utilized to examine the gene expression changes.
DNA was isolated from peripheral blood and bone marrow samples using the High Pure PCR Template Preparation Kit (Roche, Basel, Switzerland) following the manufacturer’s protocol. DNA concentration was measured by UV spectrophotometry (NanoDrop; Thermo Fisher Scientific, Waltham, Massachusetts, USA).
RNA isolation
The peripheral blood and bone marrow samples were homogenized for 2 h using hemolysis solution containing 0.15 M NH4Cl, 10 M NH4HCO3, and 0.1 M EDTA with a pH of 7.4 (Sigma-Aldrich, St. Louis, MO, USA). After hemolysis, samples were centrifuged at 1800 RPM for 10 min and washed with 1x phosphate-buffered saline (PBS; Lonza, Basel, Switzerland). Total RNA was isolated from cells using TRIzol Reagent (Invitrogen, Waltham, Massachusetts, USA) following the manufacturer’s protocol. RNA concentration was measured by UV spectrophotometry (NanoDrop; Thermo Fisher Scientific, Waltham, Massachusetts, USA).
Sanger sequencing
The amplification of NPM1 was performed using AmpliTaqGold (Thermo Fisher Scientific, Waltham, Massachusetts, USA) polymerase mix in a PE 2720 GeneAmp (Perkin-Elmer, Waltham, Massachusetts, USA) PCR machine. Forward (5′- TTC CAT ACA TAC TTA AAA CCA A-3′) and reverse (5′- TGG TTC CTT AAC CAC ATT TCT TT −3′) primers were employed in a 25 mL final volume. The reaction mix contained 2x AmpliTaqGold mix, 400 nM of each primer and 100 ng of DNA. Amplification started with denaturation for 10 min at 95 °C, and then 95 °C for 30 sec, 56 °C for 60 sec and 72 °C for 60 sec were repeated for 40 cycles. The PCR products were cleaned using ExoSAP-IT PCR Product Cleanup (Affymetrix, Santa Clara, California USA), and trailed using the Big Dye Terminator kit v3.1 (Thermo Fisher Scientific, Waltham, Massachusetts, USA) direct sequencing reaction following the manufacturer’s protocol. For sequencing analysis an ABI 3500 Genetic Analyzer (Thermo Fisher Scientific, Waltham, Massachusetts, USA) machine was used, and the results were visualized using SeqA6 (Thermo Fisher Scientific, Waltham, Massachusetts, USA) software.
Quantitative PCR measurement
For qPCR analysis, 1 µg of total RNA from each sample was transcribed in a final volume of 25 µL using the High-Capacity cDNA Reverse Transcription Kit (Thermo Fisher Scientific, Waltham, Massachusetts, USA). Quantitative PCR was performed using the CFX96 Real-Time PCR Machine (Bio-Rad Laboratories, Hercules, California, USA) and SensiFAST SYBR No-ROX Kit (Bioline Reagents, London, UK).
Primers were designed on exon-exon junctions and covering all transcript variants of each selected gene. GAPDH and TBP genes were used as reference genes (Table 1).
Table 1.
Quantitative PCR primers for selected and references genes.
| Mutation | Gene | NCBI nucleotide sequence | Primer sequence | Length (bp) | Temp (°C) | |
|---|---|---|---|---|---|---|
| IDH1 | RASGRP3 | NM_015376.2 | F: | 5′-CAAGCCAACCTTCTGCGAAC-3′ | 83 | 60 |
| R: | 5′-TGGCTCCACAGTCTTTGCAT-3′ | |||||
| IDH2 | NPDC1 | NM_015392.3 | F: | 5′-GACTACGCCACTGCGAAGG-3′ | 139 | 60 |
| R: | 5′-CTTTATGCCGCTCCAGGCAC-3′ | |||||
| NPM1 | HOXA5 | NM_019102.3 | F: | 5′-AGCTGCACATAAGTCATGACAACA-3′ | 136 | 60 |
| R: | 5′-TCAATCCTCCTTCTGCGGGT-3′ | |||||
| NPM1 | HOXB5 | NM_002147.3 | F: | 5′-AACTCCTTCTCGGGGCGTTAT-3′ | 138 | 60 |
| R: | 5′-CATCCCATTGTAATTGTAGCCGT-3′ | |||||
| NPM1 | HOXA10 | NM_018951.3 | F: | 5′-GAGAGCAGCAAAGCCTCGC-3′ | 127 | 60 |
| R: | 5′-CCAGTGTCTGGTGCTTCGTG-3′ | |||||
| NPM1 | ITM2A | NM_001171581.1 | F: | 5′-TGTTGCTGGGGAACTGCTAT-3′ | 102 | 60 |
| R: | 5′-GATATCTGCCACTCGCCAGTTT-3′ | |||||
| NPM1 | MEIS1 | NM_002398.2 | F: | 5′-CACGGGACTCACCATCCTTC-3′ | 99 | 60 |
| R: | 5′-TGACTTACTGCTCGGTTGGAC-3′ | |||||
| NPM1 | PBX3 | NM_006195.5 | F: | 5′-CACACCTCAGCAACCCCTAC-3′ | 90 | 60 |
| R: | 5′-ACCAATTGGATACCTGTGACACT-3′ | |||||
| – | GAPDH | NM_002046.6 | F: | 5′-AAATCAAGTGGGGCGATGCT-3′ | 86 | 60 |
| R: | 5′-CAAATGAGCCCCAGCCTTCT-3′ | |||||
| – | TBP | NM_003194.4 | F: | 5′-GCACAGGAGCCAAGAGTGAA-3′ | 127 | 60 |
| R: | 5′-TCACAGCTCCCCACCATGT-3′ |
Annealing temperature (Temp) calculation was executed using NCBI Primer Blast (www.ncbi.nlm.nih.gov/tools/primer-blast/).
The reactions were performed in a 20 µL final volume, containing 1 µL of cDNA, diluted 2-fold, and 125 nM of each primer. After a preliminary denaturation step of 2 min at 95 °C, 40 cycles with three steps were performed: 95 °C for 15 sec, 60 °C for 15 sec and 72 °C for 30 sec. Each sample was measured in triplicate, and the threshold cycle (Ct) was determined for each gene. The ΔCt method was employed to evaluate gene expression changes and we used 2(-ΔCt)-values of the data. WinSTAT (http://www.winstat.com) was used to analyze the data.
Statistical computations
First, patients were divided into a mutated and a wild-type cohort based on the somatic mutation status of NPM1. Normal distribution of the data was checked using the Shapiro-Wilk’s W test. Then, Wilcoxon analysis was used to identify differentially expressed genes between the mutant and wild type cohorts. In addition, median fold change (FC) was computed for each gene to determine the direction of the expression change. Significance was accepted for genes with less than 0.5 or higher than 2 and with a p value below P < 0.05.
Correlation between gene expression and overall survival (OS) was computed using Cox proportional hazards regression and by plotting Kaplan-Meier survival plots. To calculate the prognostic effect of a gene, each percentile of gene expression were computed between the lower and upper quartiles and the best performing threshold was used as the final cutoff in the Cox regression analysis [35]. The “survival” R package (http://CRAN.R-project.org/package=survival) was applied for Cox regression analysis and “survplot” R package (http://www.cbs.dtu.dk/~eklund/survplot/) to generate Kaplan-Meier plots. Finally, q-value was computed (the minimum false discovery rate at which the test may be called significant) to combat multiple hypothesis testing.
Results
Analysis of the first training cohort
The training cohort was based on 536 patients from the GSE6891 dataset [36]. The gene expression profiles of these samples were determined using Affymetrix Human Genome U133 Plus 2.0 Arrays (GPL570), and we obtained both mutation and gene expression data for 460 of the 536 patients. The median follow-up for overall survival (OS) was 18.7 months. Fig. 1B and Table 2 show the clinico-pathological parameters, including age, gender, and FAB subtype. NPM1 was the most frequently mutated gene as 30% of patients harbored a mutation. When correlating survival length in the training cohort and NPM1 mutation status, no significant correlation was observed (P = 0.3).
Table 2.
Clinical characteristics of datasets.
| GSE6859 | TCGA | GSE1159 | Semmelweis set | |
|---|---|---|---|---|
| Total number of samples | 536 | 200 | 293 | 169 |
| Samples with mutation & expression data | 460 | 116 | 247 | 169 |
| Age range (median) | 15–60 (43) | 18–89 (58) | 15–60 (42) | 0–85 (59) |
| Sex (F/M) | 230/230 | 91/109 | 128/119 | 84/85 |
| Median survival time (months) | 18,7 | 12 | 17 | 6.92 |
| Karyotype (good/intermediate/poor/unknown) | 97/261/92/86 | – | 60/136/48/49 | 12/97/25/35 |
| FAB subtype (M0/M1/M2/M3/M4/M5/M6) | 16/95/105/24/84/104/6 | – | 6/55/54/17/43/62/3 | – |
F: female, M: male, PB: peripheral blood, BM: bone marrow.
Wilcoxon analysis across all genes (12,205) identified 85 genes showing significantly altered expression in NPM1 mutant patients compared to the NPM1 wild type cohort. Of these, 57 genes were upregulated and 28 genes were downregulated. The full list of significantly altered genes is displayed in Table 3. Cox regression analysis performed for the significant genes identified a correlation with overall survival for 47 genes at an FDR below 10% (Table 4).
Table 3.
List of genes showing significantly altered expression when comparing NPM1 mutant and wild type cohorts in the training set.
| Gene | Mutant median | Wild median | FC | P-value |
|---|---|---|---|---|
| HOXB3 | 598.5 | 189 | 3.17 | 5.12E−45 |
| HOXA5 | 2799 | 100 | 27.99 | 1.87E−44 |
| HOXB2 | 2282 | 220.5 | 10.35 | 2.85E−43 |
| HOXB6 | 1017 | 83.5 | 12.18 | 4.55E−43 |
| HOXA10 | 2952 | 683.5 | 4.32 | 2.22E−39 |
| PBX3 | 3544.5 | 654 | 5.42 | 5.45E−39 |
| MEIS1 | 2264.5 | 431 | 5.25 | 1.12E−38 |
| HOXB5 | 840.5 | 321.5 | 2.61 | 1.35E−38 |
| PDGFD | 665.5 | 227.5 | 2.93 | 2.30E−33 |
| SMC4 | 4415 | 2043.5 | 2.16 | 2.75E−32 |
| COL4A5 | 1342.5 | 100.5 | 13.36 | 1.00E−31 |
| DMXL2 | 4371.5 | 1398 | 3.13 | 3.00E−31 |
| PLA2G4A | 593.5 | 262.5 | 2.26 | 6.11E−29 |
| CD34 | 257.5 | 1854 | 0.14 | 7.04E−29 |
| APP | 49 | 839 | 0.06 | 3.44E−28 |
| BAALC | 78.5 | 611 | 0.13 | 3.49E−28 |
| ITM2C | 834.5 | 2579 | 0.32 | 2.45E−27 |
| CD200 | 77.5 | 664.5 | 0.12 | 3.38E−27 |
| H2AFY2 | 588.5 | 235.5 | 2.5 | 1.41E−25 |
| CCND2 | 2266.5 | 4802.5 | 0.47 | 2.54E−24 |
| GYPC | 803.5 | 2440.5 | 0.33 | 5.68E−23 |
| RASGRP3 | 1022.5 | 278.5 | 3.67 | 2.54E−22 |
| JUP | 702 | 1944 | 0.36 | 6.90E−22 |
| PRKAR2B | 2554 | 871.5 | 2.93 | 5.88E−21 |
| TSPAN13 | 343.5 | 1157.5 | 0.3 | 1.59E−20 |
| MAN1A1 | 1746.5 | 3552.5 | 0.49 | 2.11E−20 |
| ITM2A | 977.5 | 2989 | 0.33 | 3.81E−20 |
| H1F0 | 562.5 | 2117 | 0.27 | 1.45E−18 |
| C3AR1 | 1880 | 831.5 | 2.26 | 2.43E−18 |
| BAHCC1 | 1864 | 770 | 2.42 | 2.77E−18 |
| LPAR6 | 318 | 964 | 0.33 | 3.72E−18 |
| IFITM1 | 1370 | 2974.5 | 0.46 | 4.47E−18 |
| SEL1L3 | 1668.5 | 766.5 | 2.18 | 2.28E−17 |
| LGALS3BP | 2999.5 | 794 | 3.78 | 3.47E−17 |
| MEST | 986 | 3028 | 0.33 | 3.88E−17 |
| HIST2H2BE | 3068 | 1500 | 2.05 | 5.65E−16 |
| CPVL | 1442.5 | 553.5 | 2.61 | 1.03E−15 |
| SLC38A1 | 818.5 | 1878.5 | 0.44 | 2.49E−15 |
| EGFL7 | 276.5 | 728 | 0.38 | 3.33E−15 |
| PRKD3 | 331 | 805 | 0.41 | 6.67E−15 |
| VNN1 | 1144 | 261 | 4.38 | 9.17E−15 |
| TLR4 | 1193 | 524 | 2.28 | 3.39E−14 |
| CTSG | 3670 | 948.5 | 3.87 | 1.66E−13 |
| JAG1 | 1095.5 | 480.5 | 2.28 | 2.63E−13 |
| TNFAIP2 | 2286.5 | 1114 | 2.05 | 5.73E−13 |
| CD36 | 2778 | 1155 | 2.41 | 2.74E−12 |
| CCNA1 | 1382.5 | 476.5 | 2.9 | 7.85E−12 |
| TARP | 4965.5 | 2317.5 | 2.14 | 1.03E−11 |
| PPBP | 1487.5 | 332 | 4.48 | 1.08E−11 |
| EREG | 1391.5 | 255 | 5.46 | 1.39E−11 |
| EMP1 | 433 | 1063 | 0.41 | 2.96E−11 |
| SPINK2 | 2270 | 589.5 | 3.85 | 3.75E−11 |
| CX3CR1 | 2901.5 | 893 | 3.25 | 5.75E−11 |
| MARCKS | 1786.5 | 635.5 | 2.81 | 9.32E−11 |
| TREM1 | 1000.5 | 447 | 2.24 | 1.19E−10 |
| BCL2A1 | 993 | 446 | 2.23 | 1.35E−09 |
| WASF1 | 452 | 911.5 | 0.5 | 2.60E−09 |
| PTX3 | 766 | 368.5 | 2.08 | 2.63E−09 |
| MAFB | 1597.5 | 385.5 | 4.14 | 6.14E−09 |
| PF4 | 514.5 | 197 | 2.61 | 1.17E−08 |
| PROM1 | 320 | 1699.5 | 0.19 | 1.96E−08 |
| LILRB2 | 976 | 382.5 | 2.55 | 2.19E−08 |
| CYTL1 | 342.5 | 751.5 | 0.46 | 3.27E−08 |
| NPR3 | 479.5 | 1440 | 0.33 | 3.50E−08 |
| SERPINA1 | 4521 | 1940.5 | 2.33 | 8.33E−08 |
| HK3 | 1125 | 432.5 | 2.6 | 3.45E−07 |
| TMEM176B | 744 | 263 | 2.83 | 4.79E−07 |
| SLC4A1 | 470 | 1161.5 | 0.4 | 6.02E−07 |
| HBB | 6031 | 19,089 | 0.32 | 1.43E−06 |
| VCAN | 2036 | 491.5 | 4.14 | 1.81E−06 |
| TMEM176A | 619.5 | 302.5 | 2.05 | 3.33E−06 |
| BASP1 | 2885 | 1120 | 2.58 | 3.68E−06 |
| MPO | 6784.5 | 15,838 | 0.43 | 4.05E−06 |
| CPA3 | 3423.5 | 1255.5 | 2.73 | 1.83E−05 |
| MYCN | 839 | 390.5 | 2.15 | 2.42E−05 |
| MYOF | 736.5 | 303.5 | 2.43 | 3.17E−05 |
| IFI30 | 4928 | 1872.5 | 2.63 | 3.24E−05 |
| CA1 | 764.5 | 1800 | 0.42 | 2.42E−04 |
| FCN1 | 2595.5 | 869 | 2.99 | 4.39E−04 |
| FGL2 | 2020 | 893 | 2.26 | 7.20E−04 |
| FPR1 | 1097 | 478.5 | 2.29 | 9.26E−04 |
| C5AR1 | 1231.5 | 609 | 2.02 | 1.48E−03 |
| ELANE | 2086.5 | 4984 | 0.42 | 2.26E−03 |
| CD14 | 1211 | 359 | 3.37 | 5.38E−03 |
| S100A12 | 765 | 358 | 2.14 | 2.23E−02 |
Table 4.
NPM1 mutation associated genes that expression was correlated with OS in the training set.
| Gene | HR | P-value | q-value |
|---|---|---|---|
| MPO | 2.17 | 2.85E−07 | 2.42E−05 |
| HOXA5 | 0.55 | 1.15E−05 | 4.41E−04 |
| HOXA10 | 0.54 | 1.56E−05 | 4.41E−04 |
| CD34 | 0.55 | 2.78E−05 | 5.71E−04 |
| TARP | 0.61 | 3.36E−05 | 5.71E−04 |
| SPINK2 | 0.63 | 6.59E−05 | 9.34E−04 |
| MYOF | 0.62 | 2.27E−04 | 2.76E−03 |
| MEIS1 | 0.59 | 3.12E−04 | 3.31E−03 |
| SEL1L3 | 0.61 | 3.63E−04 | 3.43E−03 |
| PRKAR2B | 0.66 | 5.22E−04 | 4.44E−03 |
| H2AFY2 | 0.67 | 8.56E−04 | 6.62E−03 |
| PRKD3 | 0.66 | 1.10E−03 | 7.81E−03 |
| PPBP | 0.68 | 1.35E−03 | 8.85E−03 |
| MEST | 1.53 | 2.10E−03 | 1.25E−02 |
| PF4 | 0.68 | 2.21E−03 | 1.25E−02 |
| SMC4 | 0.7 | 2.75E−03 | 1.25E−02 |
| PLA2G4A | 0.7 | 2.81E−03 | 1.25E−02 |
| ELANE | 1.54 | 2.91E−03 | 1.25E−02 |
| BASP1 | 0.66 | 2.94E−03 | 1.25E−02 |
| MARCKS | 0.69 | 3.31E−03 | 1.25E−02 |
| LILRB2 | 0.66 | 3.34E−03 | 1.25E−02 |
| H1F0 | 0.68 | 3.36E−03 | 1.25E−02 |
| JUP | 1.5 | 3.38E−03 | 1.25E−02 |
| TSPAN13 | 0.69 | 3.83E−03 | 1.36E−02 |
| FCN1 | 0.71 | 4.58E−03 | 1.50E−02 |
| ITM2A | 1.46 | 4.65E−03 | 1.50E−02 |
| PBX3 | 0.69 | 4.76E−03 | 1.50E−02 |
| BAALC | 0.69 | 7.04E−03 | 2.14E−02 |
| IFI30 | 0.68 | 7.80E−03 | 2.24E−02 |
| CPVL | 0.71 | 8.09E−03 | 2.24E−02 |
| VNN1 | 0.69 | 8.18E−03 | 2.24E−02 |
| CD14 | 0.71 | 8.83E−03 | 2.34E−02 |
| HOXB5 | 0.73 | 9.86E−03 | 2.54E−02 |
| LGALS3BP | 0.72 | 1.13E−02 | 2.81E−02 |
| TNFAIP2 | 0.72 | 1.21E−02 | 2.88E−02 |
| SLC38A1 | 0.74 | 1.22E−02 | 2.88E−02 |
| CD200 | 0.73 | 1.38E−02 | 3.16E−02 |
| GYPC | 1.34 | 1.41E−02 | 3.16E−02 |
| MYCN | 0.73 | 1.48E−02 | 3.23E−02 |
| COL4A5 | 0.75 | 1.54E−02 | 3.27E−02 |
| HOXB6 | 0.76 | 1.75E−02 | 3.59E−02 |
| FPR1 | 0.72 | 1.77E−02 | 3.59E−02 |
| RASGRP3 | 0.76 | 1.90E−02 | 3.75E−02 |
| EREG | 0.76 | 2.12E−02 | 4.10E−02 |
| MAFB | 0.73 | 2.22E−02 | 4.19E−02 |
| EMP1 | 0.73 | 2.61E−02 | 4.83E−02 |
| HOXB3 | 0.77 | 2.71E−02 | 4.90E−02 |
| CTSG | 0.76 | 3.22E−02 | 5.71E−02 |
| CYTL1 | 1.35 | 3.33E−02 | 5.78E−02 |
| HOXB2 | 0.77 | 4.19E−02 | 7.02E−02 |
| EGFL7 | 0.76 | 4.21E−02 | 7.02E−02 |
| IFITM1 | 0.77 | 4.36E−02 | 7.09E−02 |
| MAN1A1 | 1.28 | 4.42E−02 | 7.09E−02 |
Selecting genes for qPCR analysis
Two additional datasets, the TCGA and the GSE1159, were used to filter the results to obtain the most reliable genes. The TCGA repository has 200 AML patients of which 152 patients had RNA-seq gene expression data and 149 patients had somatic mutation data (Table 2). Overall survival data were available for 175 patients, and the median follow-up time was 12 months. There were 116 patients who had both gene expression and mutation data. Survival analysis was not performed for this dataset because less than half of the patients had simultaneous survival, mutation and gene expression data. The clinical characteristics of the TCGA dataset are found in Fig. 1C and Table 2. The GSE1159 dataset [37] includes 293 patients measured using Affymetrix Human Genome U133A Arrays (GPL96). Follow-up with overall survival data was available for 260 patients. There were 247 patients with simultaneous gene expression and mutation data (Table 2).
In the TCGA dataset, NPM1 mutations were found in 17% of patients, of which 75% of the mutations were frame shift insertions, 20% were missense and 5% were in frame deletions (Fig. 1D). Most of the frame shift insertions were localized at the nucleolar localization signal region in the C-terminal DNA/RNA binding domain of the NPM1 gene (Fig. 1D).
In the TCGA and GSE1159 datasets, 49 of the previously identified 85 genes reached statistical significance. The results of the Wilcoxon test are listed in Table 5, and the results of the survival analysis in Table 6.
Table 5.
List of genes that expression was significantly altered between NPM1 mutant and wild type cohorts in the TCGA (A) and GSE1159 (B) datasets.
| Gene | Mutant median | Wild median | FC | P-value |
|---|---|---|---|---|
| (A) | ||||
| BAALC | 41.5 | 1010 | 0.04 | 4.75E−06 |
| HOXA5 | 1651.5 | 175.5 | 9.41 | 1.15E−05 |
| CD34 | 89 | 9587 | 0.01 | 1.18E−05 |
| GYPC | 752.5 | 2596.5 | 0.29 | 1.26E−05 |
| HOXB3 | 6453 | 729 | 8.85 | 1.54E−05 |
| HOXB5 | 426.5 | 5 | 85.3 | 2.75E−05 |
| HOXB6 | 714 | 7.5 | 95.2 | 3.61E−05 |
| RASGRP3 | 2853 | 693.5 | 4.11 | 5.14E−05 |
| MAN1A1 | 1577.5 | 4319.5 | 0.37 | 5.91E−05 |
| PBX3 | 3952 | 895.5 | 4.41 | 6.29E−05 |
| HOXB2 | 750.5 | 199 | 3.77 | 6.48E−05 |
| CD200 | 37 | 869 | 0.04 | 7.68E−05 |
| PDGFD | 377 | 85.5 | 4.41 | 1.10E−04 |
| COL4A5 | 1769 | 54 | 32.76 | 1.26E−04 |
| PROM1 | 118 | 3421 | 0.03 | 1.26E−04 |
| HOXA10 | 1164.5 | 318.5 | 3.66 | 1.46E−04 |
| DMXL2 | 9338 | 4220 | 2.21 | 1.51E−04 |
| MEIS1 | 4178 | 1235 | 3.38 | 1.96E−04 |
| SMC4 | 5938.5 | 3471 | 1.71 | 2.14E−04 |
| NPR3 | 561.5 | 3175 | 0.18 | 3.67E−04 |
| ITM2C | 2335 | 3929 | 0.59 | 4.83E−04 |
| MEST | 678 | 1710 | 0.4 | 1.27E−03 |
| BAHCC1 | 14,302 | 5990 | 2.39 | 1.49E−03 |
| TSPAN13 | 133.5 | 405 | 0.33 | 2.20E−03 |
| TMEM176B | 28.5 | 105.5 | 0.27 | 2.90E−03 |
| TMEM176A | 17 | 65.5 | 0.26 | 3.04E−03 |
| JUP | 2023 | 4307 | 0.47 | 3.22E−03 |
| APP | 230 | 4225.5 | 0.05 | 4.07E−03 |
| PTX3 | 177 | 99 | 1.79 | 5.66E−03 |
| PLA2G4A | 845.5 | 542.5 | 1.56 | 7.47E−03 |
| CTSG | 3846.5 | 891 | 4.32 | 7.55E−03 |
| IFITM1 | 208.5 | 405 | 0.51 | 8.51E−03 |
| LPAR6 | 330 | 649 | 0.51 | 8.60E−03 |
| CCND2 | 4057.5 | 6980 | 0.58 | 8.98E−03 |
| SEL1L3 | 2942.5 | 1823.5 | 1.61 | 1.41E−02 |
| ITM2A | 730.5 | 2173 | 0.34 | 1.45E−02 |
| SLC38A1 | 2730.5 | 5749.5 | 0.47 | 1.70E−02 |
| EMP1 | 478 | 698 | 0.68 | 1.93E−02 |
| EGFL7 | 799 | 1628 | 0.49 | 2.28E−02 |
| JAG1 | 1032 | 701.5 | 1.47 | 2.56E−02 |
| CCNA1 | 866.5 | 392.5 | 2.21 | 2.60E−02 |
| ELANE | 2815 | 1644 | 1.71 | 3.66E−02 |
| TREM1 | 1238 | 565.5 | 2.19 | 4.07E−02 |
| TNFAIP2 | 5289 | 3448 | 1.53 | 4.25E−02 |
| SLC4A1 | 255 | 1005.5 | 0.25 | 4.29E−02 |
| PRKD3 | 898 | 1510.5 | 0.59 | 4.33E−02 |
| LGALS3BP | 5023.5 | 1190 | 4.22 | 4.60E−02 |
| TARP | 1053.5 | 503 | 2.09 | 4.72E−02 |
| HBB | 3253 | 11122.5 | 0.29 | 4.72E−02 |
| (B) | ||||
| BAALC | 105 | 527 | 0.2 | 1.20E−14 |
| HOXA5 | 3320 | 167.5 | 19.82 | 3.79E−26 |
| CD34 | 310 | 1862 | 0.17 | 1.02E−13 |
| GYPC | 814 | 2218.5 | 0.37 | 7.62E−12 |
| HOXB3 | 395 | 93 | 4.25 | 1.19E−25 |
| HOXB5 | 687 | 245.5 | 2.8 | 1.53E−23 |
| HOXB6 | 952 | 14.5 | 65.66 | 1.06E−22 |
| RASGRP3 | 743 | 197 | 3.77 | 1.93E−11 |
| MAN1A1 | 1025 | 2469.5 | 0.42 | 7.51E−11 |
| PBX3 | 3406 | 647 | 5.26 | 1.58E−22 |
| HOXB2 | 2268 | 245 | 9.26 | 2.71E−23 |
| CD200 | 69 | 538 | 0.13 | 1.63E−16 |
| PDGFD | 573 | 205.5 | 2.79 | 2.23E−18 |
| COL4A5 | 1161 | 99 | 11.73 | 1.03E−17 |
| PROM1 | 288 | 1468 | 0.2 | 2.68E−05 |
| HOXA10 | 1842 | 304.5 | 6.05 | 8.81E−23 |
| DMXL2 | 3644 | 1164.5 | 3.13 | 1.03E−17 |
| MEIS1 | 1761 | 352.5 | 5 | 4.04E−21 |
| SMC4 | 3502 | 1565.5 | 2.24 | 5.65E−20 |
| NPR3 | 440 | 1493 | 0.29 | 7.34E−06 |
| ITM2C | 712 | 2538 | 0.28 | 3.27E−17 |
| MEST | 948 | 2877 | 0.33 | 1.20E−12 |
| BAHCC1 | 2543 | 1273 | 2 | 1.15E−08 |
| TSPAN13 | 252 | 732 | 0.34 | 4.82E−11 |
| TMEM176B | 651 | 170 | 3.83 | 2.21E−03 |
| TMEM176A | 831 | 435.5 | 1.91 | 8.10E−04 |
| JUP | 510 | 1762.5 | 0.29 | 1.40E−14 |
| APP | 43 | 335.5 | 0.13 | 1.90E−14 |
| PTX3 | 722 | 286 | 2.52 | 3.17E−07 |
| PLA2G4A | 400 | 187.5 | 2.13 | 3.73E−15 |
| CTSG | 3909 | 837 | 4.67 | 1.05E−08 |
| IFITM1 | 1295 | 2301 | 0.56 | 1.06E−08 |
| LPAR6 | 220 | 805 | 0.27 | 1.24E−11 |
| CCND2 | 2137 | 5490.5 | 0.39 | 3.31E−16 |
| SEL1L3 | 1650 | 791 | 2.09 | 2.16E−09 |
| ITM2A | 647 | 1967 | 0.33 | 1.75E−11 |
| SLC38A1 | 831 | 1893.5 | 0.44 | 4.41E−10 |
| EMP1 | 281 | 906.5 | 0.31 | 3.13E−09 |
| EGFL7 | 376 | 965 | 0.39 | 1.51E−09 |
| JAG1 | 888 | 403 | 2.2 | 8.53E−08 |
| CCNA1 | 1514 | 583.5 | 2.59 | 2.04E−05 |
| ELANE | 2466 | 5811 | 0.42 | 1.27E−02 |
| TREM1 | 1158 | 597.5 | 1.94 | 2.99E−07 |
| TNFAIP2 | 2196 | 1215.5 | 1.81 | 2.72E−08 |
| SLC4A1 | 284 | 794 | 0.36 | 4.45E−04 |
| PRKD3 | 269 | 558.5 | 0.48 | 6.82E−08 |
| LGALS3BP | 2623 | 996.5 | 2.63 | 2.70E−09 |
| TARP | 5095 | 2815.5 | 1.81 | 3.96E−05 |
| HBB | 4514 | 21338.5 | 0.21 | 5.18E−05 |
Table 6.
NPM1 mutation associated genes that expression was correlated with OS in the GSE1159 dataset.
| Gene | HR | P-value | q-value |
|---|---|---|---|
| HOXA10 | 0.48 | 1.63E−05 | 7.99E−04 |
| TARP | 0.53 | 1.31E−04 | 2.22E−03 |
| HOXA5 | 0.51 | 1.69E−04 | 2.22E−03 |
| SEL1L3 | 0.53 | 1.81E−04 | 2.22E−03 |
| MEIS1 | 0.49 | 2.85E−04 | 2.76E−03 |
| ITM2A | 1.96 | 3.38E−04 | 2.76E−03 |
| PLA2G4A | 0.59 | 1.19E−03 | 8.33E−03 |
| ELANE | 1.8 | 1.39E−03 | 8.51E−03 |
| MEST | 1.77 | 2.06E−03 | 1.12E−02 |
| CD34 | 0.58 | 2.48E−03 | 1.22E−02 |
| JUP | 1.76 | 3.73E−03 | 1.58E−02 |
| GYPC | 1.57 | 3.86E−03 | 1.58E−02 |
| LGALS3BP | 0.62 | 4.49E−03 | 1.67E−02 |
| SMC4 | 0.62 | 4.76E−03 | 1.67E−02 |
| MAN1A1 | 1.54 | 5.38E−03 | 1.76E−02 |
| PBX3 | 0.65 | 6.02E−03 | 1.84E−02 |
| HOXB5 | 0.63 | 7.11E−03 | 2.05E−02 |
| CTSG | 0.63 | 8.96E−03 | 2.44E−02 |
| TSPAN13 | 0.65 | 1.03E−02 | 2.66E−02 |
| SLC38A1 | 0.67 | 1.26E−02 | 3.09E−02 |
| IFITM1 | 1.49 | 1.49E−02 | 3.48E−02 |
| HOXB2 | 0.68 | 1.98E−02 | 4.41E−02 |
| RASGRP3 | 0.71 | 2.79E−02 | 5.94E−02 |
| CCND2 | 1.38 | 4.21E−02 | 8.24E−02 |
| LPAR6 | 1.41 | 4.42E−02 | 8.24E−02 |
| HOXB3 | 0.72 | 4.45E−02 | 8.24E−02 |
| EGFL7 | 1.46 | 4.54E−02 | 8.24E−02 |
For qPCR measurement only those genes were selected which showed a significant gene expression change and a fold change over 2.0 or below 0.5 in each training set (n = 32). Correlation to survival was used as an additional filter (n = 19), and the pipeline of gene selection for qPCR measurement is depicted in Fig. 2A.
Fig. 2.

A–G. Best genes in the training set. Workflow of selecting differentially expressed genes (A). The best performing genes linked to NPM1 mutations in the training set (B–G). Hazard rates with 95% confidence intervals are shown.
The best performing genes discriminating NPM1 mutant and wild-type samples were HOXA5, HOXB5, HOXA10, PBX3, MEIS1, and ITM2A. Of these, ITM2A was the only downregulated gene (Fig. 2G). Kaplan-Meier curves show that high expression of these genes was correlated with poor survival (Fig. 2B–F). In the case of ITM2A, lower expression was associated with worse outcome (Fig. 2G). Correlation between mutation status and expression and expression and survival in the TCGA and GSE1159 datasets for these genes is provided in Figs. 3 and 4, respectively.
Fig. 3.

Validation of NPM1-associated differentially expressed genes in the GSE1159 (A) and TCGA datasets (B).
Fig. 4.

The expression of HOXA5 (A), HOXB5 (B), HOXA10 (C), PBX3 (D), MEIS1 (E) and ITM2A (F) genes was significantly correlated with OS in the GSE1159 dataset. HRs with 95% confidence intervals are shown.
Correlation between NPM1 mutation and mutations in other genes
The prevalence of NPM1 mutation was compared to IDH1, IDH2, and FLT3 mutation status in the training and validation sets by Chi-square analysis. In the training set, the correlation to IDH1 and FLT3 was significant (chi-stat = 44.7, P < 0.00001 and chi-stat = 9.2, P = 0.0024, respectively) while the correlation to IDH2 was not significant. Similarly, in the validation set, the correlation to IDH1 and FLT3 were significant (chi-stat = 5.03, P = 0.024 and chi-stat = 8.2, P = 0.0041, respectively), and IDH2 was not significant. Important to note that only 89 patients had simultaneous mutation state for each gene in the validation set.
Validation of target genes by qPCR in the Semmelweis set
Mutation data were available for all patients in our clinical sample cohort. In this group, the NPM1 gene was mutated in 25% of patients (Fig. 5A). The FLT3, IDH2, and IDH1 genes harbored a mutation in 25%, 14%, and 5% of patients, respectively. The mutation frequency was independent of the sample origin, including bone marrow and blood (data not shown).
Fig. 5.

A–J. Validation in an independent clinical set. Clinical characteristics of the Semmelweis set (A–D). RT-qPCR for differentially expressed genes with validated expression linked to NPM1 mutations and survival in the clinical set (E–J). Hazard rates with 95% confidence intervals are shown.
The Semmelweis set contains 169 AML patients (Fig. 1A); 52.6% of the samples were obtained from bone marrow and 47.4% of the samples were collected from peripheral blood. All samples have overall survival data with a median follow-up time of 6.92 months. Similar to the training sets, most patients have intermediate cytogenetic risk (Fig. 5A). Additional clinico-pathological characteristics of the samples are displayed in Fig. 5A–D and Table 2. When analyzing the mutation status of NPM1 in the Semmelweis set, no significant correlation to overall survival was observed (P = 0.4).
The most significant genes associated with NPM1 mutations as observed in the training sets was validated by qPCR. The expressions of HOXA5 (P = 3.06E−12, FC = 8.3), HOXA10 (P = 2.44E−09, FC = 3.3), HOXB5 (P = 1.86E−13, FC = 37), MEIS1 (P = 9.82E−10, FC = 4.4) and PBX3 (P = 1.03E−13, FC = 5.4) genes were significantly higher while the expression of the ITM2A (P = 0.004, FC = 0.4) gene was significantly lower in the NPM1 mutant patient cohort (Fig. 5E–J). Finally, the survival analysis provided a significant association between the expression of the HOXA5, HOXA10, PBX3, and MEIS1 genes and overall survival in the validation cohort (Fig. 5E–I).
Correlation between HOX genes and co-factors
Pearson’s rank correlation was computed to examine the relation of gene expression between HOX, MEIS, and PBX genes. All the P-values were less than 2.2E−16. High correlation was found between HOXA5 and HOXA10, HOXA5 and MEIS1, HOXA10 and MEIS1, HOXA10 and PBX3, and MEIS1 and PBX3 genes (Fig. 6A). In Fig. 6B, the potential interplay between HOX genes and co-factors (PBX3 and MEIS1) in the cell is displayed.
Fig. 6.

Correlation between top target genes. Scatterplot and Pearson rank correlation coefficients of gene expression (P < 2.2E−16 for each correlation) (A). HOX genes and identified cofactors act in concert to influence multiple features of a cancer cell (B).
Discussion
Genes showing altered expression with NPM1 somatic mutations and altered survival were identified in AML. Interestingly, NPM1 mutation status per se was not correlated to survival neither in the training nor in the validation set. The final set of NPM1-assicated genes is established in four independent datasets (three previously published genomic sets and one clinical sample set collected at the Semmelweis University). The results demonstrate that the HOXA5, HOXB5, HOXA10, PBX3, MEIS1, and ITM2A genes show the highest expression change when comparing NPM1 mutant and wild type cohorts. Of these genes, HOXA5, HOXB5, HOXA10, PBX3, and MEIS1 were upregulated, and the ITM2A gene was downregulated in the NPM1 mutant tumors. With the exception of ITM2A, higher expression was also correlated with poor prognosis.
Homeobox genes are members of transcription factor families that are grouped into four main clusters (HOXA-D) on four different chromosomes. HOX genes play central roles in embryonic development, differentiation, and proliferation of hematopoietic cells [38]. Expression changes of HOX genes are also highly correlated with the development of hematologic malignancies [39]. In a genome-wide analysis, several HOXA and HOXB genes with their co-factors were overexpressed in AML with normal karyotype [40]. HOX expression in AML is restricted to specific genes in the HOXA or HOXB loci, and are highly correlated with recurrent cytogenetic abnormalities [41]. Overexpression of HOX genes results in the expansion of progenitor cell populations and simultaneously blockade of the differentiation of these cells [42]. Here, three homeobox (HOX) genes were found – HOXA5, HOXB5, and HOXA10 – that show significantly higher expression in NPM1 mutant tumor samples. A previous study revealed that high expression of HOXA5 is linked with worse survival in AML [38]. In pediatric AML cases, NPM1 mutations affected the expression of HOXA4, HOXA6, HOXA7, HOXA9, and HOXB9 genes and the MEIS1 and PBX3 genes [43]. The mechanism of action for upregulation of HOX genes in NPM1 mutated patients remains uncertain. NPM1 might directly modify the expression of HOX genes, or NPM1 mutations might inhibit the differentiation of early hematopoietic progenitors where HOX expression is upregulated [44]. The results of present study also provide robust clinical support for recent cell-culture based observations establishing the connection between NPM1 and HOX expression in AML. In their study, Brunetti and coworkers show the key role of mutant NPM1 and its aberrant cytoplasmic localization in inducing HOX expression. Nuclear re-localization of the mutated protein (NPM1c) induced immediate downregulation of HOX genes, followed by cell differentiation [45].
Hox transcription factors frequently co-operate with PBX (pre-B-cell leukemia homeobox) and MEIS (myeloid ecotropic viral integration site homeobox) family genes [46]. These genes are encoded by homeodomain-containing transcription cofactors, which have an essential role in some HOX-dependent developmental programs [47]. HOX proteins from paralog groups 1 to 10 interact with PBX proteins, whereas interaction with MEIS proteins is limited to HOX paralogs 9 to 13 [48].
PBX proteins were identified as fusion proteins from chromosome translocations causing pre-B cell leukemia in humans [49]. The interaction between PBX and HOX proteins is essential for HOX function [50] (see Fig. 6B). Earlier studies presented that the DNA binding affinity of HOX proteins is higher when PBX proteins are present [51]. In addition, these co-factors can mediate the DNA target selection of HOX proteins [52]. PBX proteins also bind to additional factors, such as histone deacetylases (HDACs) and histone acetyltransferases (HATs) to mobilize these factors to the HOX complexes [53].
MEIS proteins are members of HMP (homothorax, meis and prep) proteins and are identified as proto-oncogenes coactivated with HOX genes in leukemia [54]. Previous studies demonstrated that HMP proteins can form complexes with PBX and HOX proteins [55] (Fig. 6B). MEIS proteins also counteract HDAC activity [56]. PBX-HOX complexes can bind HDACs and repress transcription; however, this repression can be blocked by MEIS proteins capable of initiating transcription [56].
ITM2A (integral membrane protein 2A) is a type II membrane protein that belongs to the ITM2 family [57]. ITM2A is involved in myogenic differentiation, mesenchymal stem cell differentiation, and autophagy [58]. A patent describing a monoclonal antibody against ITM2A for the potential treatment of AML by inducing ADCC was recently submitted [59]. Decreased ITM2A expression in AML was described previously, but its function in the progression of AML is still unclear [14].
These results support the idea of targeting the HOX transcription complex in the targeted therapy of NPM1 mutated AML. In some solid cancers, including lung [60], breast [61], prostate [62], melanoma [63], and AML cell lines [64], HXR9 is a potent cell penetrating peptide inhibitor targeting HOX proteins by inhibiting the interaction with PBX cofactors. Alharbi et al. evaluated the mechanism of HXR9 induced cell death and found that HXR9 promotes apoptosis and necroptosis and its cytotoxicity can be enhanced by inhibiting protein kinase C (PKC) in AML cell lines [65].
Conclusions
In summary, by connecting mutation status with a gene expression signature we identified HOX genes and their co-factors significantly upregulated in NPM1 mutant tumors. The expression of these genes also correlated to survival outcome. The strength of this study is the utilization of several different training sets for feature selection and validation using an independent method. Based on these results, the complex involving the HOX genes with the PBX3 and MEIS1 co-factors may serve as an advanced therapeutic target in NPM1 mutated AML patients.
Availability of data and material
The NCBI Gene Expression Omnibus datasets are available using the following links:
GSE6891: https://www.ncbi.nlm.nih.gov/geo/query/acc.cgi?acc=GSE6891.
GSE1159: https://www.ncbi.nlm.nih.gov/geo/query/acc.cgi?acc=GSE1159.
TCGA (The Cancer Genome Atlas) dataset is available using the following link: https://portal.gdc.cancer.gov/projects/TCGA-LAML.
Conflict of interest
The authors have declared no conflict of interest.
Acknowledgements
The study was supported by the NVKP_16-1-2016-0004 NVKP_16-1-2016-0037, 2018-1.3.1-VKE-2018-00032, KH-129581 and FIEK_16-1-2016-0005 grants of the National Research, Development and Innovation Office, Hungary.
Footnotes
Peer review under responsibility of Cairo University.
References
- 1.Siegel R.L., Miller K.D., Jemal A. Cancer statistics, 2018. CA Cancer J Clin. 2018;68(1):7–30. doi: 10.3322/caac.21442. [DOI] [PubMed] [Google Scholar]
- 2.Rowley J.D. Chromosomal translocations: revisited yet again. Blood. 2008;112(6):2183–2189. doi: 10.1182/blood-2008-04-097931. [DOI] [PubMed] [Google Scholar]
- 3.Cancer Genome Atlas Research N., Ley T.J., Miller C., Ding L., Raphael B.J., Mungall A.J. Genomic and epigenomic landscapes of adult de novo acute myeloid leukemia. N Engl J Med. 2013;368(22):2059–2074. doi: 10.1056/NEJMoa1301689. [DOI] [PMC free article] [PubMed] [Google Scholar]
- 4.Fathi A.T., Wander S.A., Faramand R., Emadi A. Biochemical, epigenetic, and metabolic approaches to target IDH mutations in acute myeloid leukemia. Semin Hematol. 2015;52(3):165–171. doi: 10.1053/j.seminhematol.2015.03.002. [DOI] [PubMed] [Google Scholar]
- 5.Shlush L.I., Zandi S., Mitchell A., Chen W.C., Brandwein J.M., Gupta V. Identification of pre-leukaemic haematopoietic stem cells in acute leukaemia. Nature. 2014;506(7488):328–333. doi: 10.1038/nature13038. [DOI] [PMC free article] [PubMed] [Google Scholar]
- 6.McKenna H.J., Stocking K.L., Miller R.E., Brasel K., De Smedt T., Maraskovsky E. Mice lacking flt3 ligand have deficient hematopoiesis affecting hematopoietic progenitor cells, dendritic cells, and natural killer cells. Blood. 2000;95(11):3489–3497. [PubMed] [Google Scholar]
- 7.Rombouts W.J., Blokland I., Lowenberg B., Ploemacher R.E. Biological characteristics and prognosis of adult acute myeloid leukemia with internal tandem duplications in the Flt3 gene. Leukemia. 2000;14(4):675–683. doi: 10.1038/sj.leu.2401731. [DOI] [PubMed] [Google Scholar]
- 8.Falini B., Mecucci C., Tiacci E., Alcalay M., Rosati R., Pasqualucci L. Cytoplasmic nucleophosmin in acute myelogenous leukemia with a normal karyotype. N Engl J Med. 2005;352(3):254–266. doi: 10.1056/NEJMoa041974. [DOI] [PubMed] [Google Scholar]
- 9.Grisendi S., Mecucci C., Falini B., Pandolfi P.P. Nucleophosmin and cancer. Nat Rev Cancer. 2006;6(7):493–505. doi: 10.1038/nrc1885. [DOI] [PubMed] [Google Scholar]
- 10.Martelli M.P., Manes N., Pettirossi V., Liso A., Pacini R., Mannucci R. Absence of nucleophosmin leukaemic mutants in B and T cells from AML with NPM1 mutations: implications for the cell of origin of NPMc+ AML. Leukemia. 2008;22(1):195–198. doi: 10.1038/sj.leu.2404857. [DOI] [PubMed] [Google Scholar]
- 11.Thiede C., Koch S., Creutzig E., Steudel C., Illmer T., Schaich M. Prevalence and prognostic impact of NPM1 mutations in 1485 adult patients with acute myeloid leukemia (AML) Blood. 2006;107(10):4011–4020. doi: 10.1182/blood-2005-08-3167. [DOI] [PubMed] [Google Scholar]
- 12.Yang L., Rau R., Goodell M.A. DNMT3A in haematological malignancies. Nat Rev Cancer. 2015;15(3):152–165. doi: 10.1038/nrc3895. [DOI] [PMC free article] [PubMed] [Google Scholar]
- 13.Papaemmanuil E., Gerstung M., Bullinger L., Gaidzik V.I., Paschka P., Roberts N.D. Genomic classification and prognosis in acute myeloid leukemia. N Engl J Med. 2016;374(23):2209–2221. doi: 10.1056/NEJMoa1516192. [DOI] [PMC free article] [PubMed] [Google Scholar]
- 14.Verhaak R.G., Goudswaard C.S., van Putten W., Bijl M.A., Sanders M.A., Hugens W. Mutations in nucleophosmin (NPM1) in acute myeloid leukemia (AML): association with other gene abnormalities and previously established gene expression signatures and their favorable prognostic significance. Blood. 2005;106(12):3747–3754. doi: 10.1182/blood-2005-05-2168. [DOI] [PubMed] [Google Scholar]
- 15.Schnittger S., Schoch C., Kern W., Mecucci C., Tschulik C., Martelli M.F. Nucleophosmin gene mutations are predictors of favorable prognosis in acute myelogenous leukemia with a normal karyotype. Blood. 2005;106(12):3733–3739. doi: 10.1182/blood-2005-06-2248. [DOI] [PubMed] [Google Scholar]
- 16.Rollig C., Thiede C., Gramatzki M., Aulitzky W., Bodenstein H., Bornhauser M. A novel prognostic model in elderly patients with acute myeloid leukemia: results of 909 patients entered into the prospective AML96 trial. Blood. 2010;116(6):971–978. doi: 10.1182/blood-2010-01-267302. [DOI] [PubMed] [Google Scholar]
- 17.Paschka P., Schlenk R.F., Gaidzik V.I., Habdank M., Kronke J., Bullinger L. IDH1 and IDH2 mutations are frequent genetic alterations in acute myeloid leukemia and confer adverse prognosis in cytogenetically normal acute myeloid leukemia with NPM1 mutation without FLT3 internal tandem duplication. J Clin Oncol. 2010;28(22):3636–3643. doi: 10.1200/JCO.2010.28.3762. [DOI] [PubMed] [Google Scholar]
- 18.Gong Q., Zhou L., Xu S., Li X., Zou Y., Chen J. High doses of daunorubicin during induction therapy of newly diagnosed acute myeloid leukemia: a systematic review and meta-analysis of prospective clinical trials. PLoS One. 2015;10(5):e0125612. doi: 10.1371/journal.pone.0125612. [DOI] [PMC free article] [PubMed] [Google Scholar]
- 19.Li X., Xu S., Tan Y., Chen J. The effects of idarubicin versus other anthracyclines for induction therapy of patients with newly diagnosed leukaemia. Cochr Datab Syst Rev. 2015;6:CD010432. doi: 10.1002/14651858.CD010432.pub2. [DOI] [PMC free article] [PubMed] [Google Scholar]
- 20.Lowenberg B. Sense and nonsense of high-dose cytarabine for acute myeloid leukemia. Blood. 2013;121(1):26–28. doi: 10.1182/blood-2012-07-444851. [DOI] [PubMed] [Google Scholar]
- 21.Falini B., Nicoletti I., Martelli M.F., Mecucci C. Acute myeloid leukemia carrying cytoplasmic/mutated nucleophosmin (NPMc+ AML): biologic and clinical features. Blood. 2007;109(3):874–885. doi: 10.1182/blood-2006-07-012252. [DOI] [PubMed] [Google Scholar]
- 22.Schneider F., Hoster E., Unterhalt M., Schneider S., Dufour A., Benthaus T. NPM1 but not FLT3-ITD mutations predict early blast cell clearance and CR rate in patients with normal karyotype AML (NK-AML) or high-risk myelodysplastic syndrome (MDS) Blood. 2009;113(21):5250–5253. doi: 10.1182/blood-2008-09-172668. [DOI] [PubMed] [Google Scholar]
- 23.Zhang W., Konopleva M., Shi Y.X., McQueen T., Harris D., Ling X. Mutant FLT3: a direct target of sorafenib in acute myelogenous leukemia. J Natl Cancer Inst. 2008;100(3):184–198. doi: 10.1093/jnci/djm328. [DOI] [PubMed] [Google Scholar]
- 24.Fischer T., Stone R.M., Deangelo D.J., Galinsky I., Estey E., Lanza C. Phase IIB trial of oral Midostaurin (PKC412), the FMS-like tyrosine kinase 3 receptor (FLT3) and multi-targeted kinase inhibitor, in patients with acute myeloid leukemia and high-risk myelodysplastic syndrome with either wild-type or mutated FLT3. J Clin Oncol. 2010;28(28):4339–4345. doi: 10.1200/JCO.2010.28.9678. [DOI] [PMC free article] [PubMed] [Google Scholar]
- 25.Wander S.A., Levis M.J., Fathi A.T. The evolving role of FLT3 inhibitors in acute myeloid leukemia: quizartinib and beyond. Ther Adv Hematol. 2014;5(3):65–77. doi: 10.1177/2040620714532123. [DOI] [PMC free article] [PubMed] [Google Scholar]
- 26.Smith C.C., Lasater E.A., Lin K.C., Wang Q., McCreery M.Q., Stewart W.K. Crenolanib is a selective type I pan-FLT3 inhibitor. Proc Natl Acad Sci USA. 2014;111(14):5319–5324. doi: 10.1073/pnas.1320661111. [DOI] [PMC free article] [PubMed] [Google Scholar]
- 27.Redell M.S., Ruiz M.J., Alonzo T.A., Gerbing R.B., Tweardy D.J. Stat3 signaling in acute myeloid leukemia: ligand-dependent and -independent activation and induction of apoptosis by a novel small-molecule Stat3 inhibitor. Blood. 2011;117(21):5701–5709. doi: 10.1182/blood-2010-04-280123. [DOI] [PMC free article] [PubMed] [Google Scholar]
- 28.Oh D.Y., Lee S.H., Han S.W., Kim M.J., Kim T.M., Kim T.Y. Phase I study of OPB-31121, an Oral STAT3 inhibitor, in patients with advanced solid tumors. Cancer Res Treat. 2015;47(4):607–615. doi: 10.4143/crt.2014.249. [DOI] [PMC free article] [PubMed] [Google Scholar]
- 29.Abdel-Wahab O., Levine R.L. Mutations in epigenetic modifiers in the pathogenesis and therapy of acute myeloid leukemia. Blood. 2013;121(18):3563–3572. doi: 10.1182/blood-2013-01-451781. [DOI] [PMC free article] [PubMed] [Google Scholar]
- 30.Dawson M.A., Kouzarides T., Huntly B.J. Targeting epigenetic readers in cancer. N Engl J Med. 2012;367(7):647–657. doi: 10.1056/NEJMra1112635. [DOI] [PubMed] [Google Scholar]
- 31.Etchin J., Sanda T., Mansour M.R., Kentsis A., Montero J., Le B.T. KPT-330 inhibitor of CRM1 (XPO1)-mediated nuclear export has selective anti-leukaemic activity in preclinical models of T-cell acute lymphoblastic leukaemia and acute myeloid leukaemia. Br J Haematol. 2013;161(1):117–127. doi: 10.1111/bjh.12231. [DOI] [PMC free article] [PubMed] [Google Scholar]
- 32.Gasiorowski R.E., Clark G.J., Bradstock K., Hart D.N. Antibody therapy for acute myeloid leukaemia. Br J Haematol. 2014;164(4):481–495. doi: 10.1111/bjh.12691. [DOI] [PubMed] [Google Scholar]
- 33.Li Q., Birkbak N.J., Gyorffy B., Szallasi Z., Eklund A.C. Jetset: selecting the optimal microarray probe set to represent a gene. BMC Bioinf. 2011;12:474. doi: 10.1186/1471-2105-12-474. [DOI] [PMC free article] [PubMed] [Google Scholar]
- 34.Anders S., Huber W. Differential expression analysis for sequence count data. Genome Biol. 2010;11(10):R106. doi: 10.1186/gb-2010-11-10-r106. [DOI] [PMC free article] [PubMed] [Google Scholar]
- 35.Mihaly Z., Kormos M., Lanczky A., Dank M., Budczies J., Szasz M.A. A meta-analysis of gene expression-based biomarkers predicting outcome after tamoxifen treatment in breast cancer. Breast Cancer Res Treat. 2013;140(2):219–232. doi: 10.1007/s10549-013-2622-y. [DOI] [PubMed] [Google Scholar]
- 36.Verhaak R.G., Wouters B.J., Erpelinck C.A., Abbas S., Beverloo H.B., Lugthart S. Prediction of molecular subtypes in acute myeloid leukemia based on gene expression profiling. Haematologica. 2009;94(1):131–134. doi: 10.3324/haematol.13299. [DOI] [PMC free article] [PubMed] [Google Scholar]
- 37.Valk P.J., Verhaak R.G., Beijen M.A., Erpelinck C.A., van Waalwijk Barjesteh, van Doorn-Khosrovani S. Prognostically useful gene-expression profiles in acute myeloid leukemia. N Engl J Med. 2004;350(16):1617–1628. doi: 10.1056/NEJMoa040465. [DOI] [PubMed] [Google Scholar]
- 38.Drabkin H.A., Parsy C., Ferguson K., Guilhot F., Lacotte L., Roy L. Quantitative HOX expression in chromosomally defined subsets of acute myelogenous leukemia. Leukemia. 2002;16(2):186–195. doi: 10.1038/sj.leu.2402354. [DOI] [PubMed] [Google Scholar]
- 39.Crooks G.M., Fuller J., Petersen D., Izadi P., Malik P., Pattengale P.K. Constitutive HOXA5 expression inhibits erythropoiesis and increases myelopoiesis from human hematopoietic progenitors. Blood. 1999;94(2):519–528. [PubMed] [Google Scholar]
- 40.Debernardi S., Lillington D.M., Chaplin T., Tomlinson S., Amess J., Rohatiner A. Genome-wide analysis of acute myeloid leukemia with normal karyotype reveals a unique pattern of homeobox gene expression distinct from those with translocation-mediated fusion events. Genes Chromos Cancer. 2003;37(2):149–158. doi: 10.1002/gcc.10198. [DOI] [PubMed] [Google Scholar]
- 41.Spencer D.H., Young M.A., Lamprecht T.L., Helton N.M., Fulton R., O'Laughlin M. Epigenomic analysis of the HOX gene loci reveals mechanisms that may control canonical expression patterns in AML and normal hematopoietic cells. Leukemia. 2015;29(6):1279–1289. doi: 10.1038/leu.2015.6. [DOI] [PMC free article] [PubMed] [Google Scholar]
- 42.Alcalay M., Tiacci E., Bergomas R., Bigerna B., Venturini E., Minardi S.P. Acute myeloid leukemia bearing cytoplasmic nucleophosmin (NPMc+ AML) shows a distinct gene expression profile characterized by up-regulation of genes involved in stem-cell maintenance. Blood. 2005;106(3):899–902. doi: 10.1182/blood-2005-02-0560. [DOI] [PubMed] [Google Scholar]
- 43.Mullighan C.G., Kennedy A., Zhou X., Radtke I., Phillips L.A., Shurtleff S.A. Pediatric acute myeloid leukemia with NPM1 mutations is characterized by a gene expression profile with dysregulated HOX gene expression distinct from MLL-rearranged leukemias. Leukemia. 2007;21(9):2000–2009. doi: 10.1038/sj.leu.2404808. [DOI] [PubMed] [Google Scholar]
- 44.Rau R., Brown P. Nucleophosmin (NPM1) mutations in adult and childhood acute myeloid leukaemia: towards definition of a new leukaemia entity. Hematol Oncol. 2009;27(4):171–181. doi: 10.1002/hon.904. [DOI] [PMC free article] [PubMed] [Google Scholar]
- 45.Brunetti L., Gundry M.C., Sorcini D., Guzman A.G., Huang Y.H., Ramabadran R. Mutant NPM1 Maintains the Leukemic State through HOX Expression. Cancer Cell. 2018;34(3):499–512. doi: 10.1016/j.ccell.2018.08.005. e9. [DOI] [PMC free article] [PubMed] [Google Scholar]
- 46.Mann R.S. The specificity of homeotic gene function. BioEssays. 1995;17(10):855–863. doi: 10.1002/bies.950171007. [DOI] [PubMed] [Google Scholar]
- 47.Azpiazu N., Morata G. Functional and regulatory interactions between Hox and extradenticle genes. Genes Dev. 1998;12(2):261–273. doi: 10.1101/gad.12.2.261. [DOI] [PMC free article] [PubMed] [Google Scholar]
- 48.Shen W.F., Montgomery J.C., Rozenfeld S., Moskow J.J., Lawrence H.J., Buchberg A.M. AbdB-like Hox proteins stabilize DNA binding by the Meis1 homeodomain proteins. Mol Cell Biol. 1997;17(11):6448–6458. doi: 10.1128/mcb.17.11.6448. [DOI] [PMC free article] [PubMed] [Google Scholar]
- 49.Korsmeyer S.J. Chromosomal translocations in lymphoid malignancies reveal novel proto-oncogenes. Annu Rev Immunol. 1992;10:785–807. doi: 10.1146/annurev.iy.10.040192.004033. [DOI] [PubMed] [Google Scholar]
- 50.Mann R.S., Chan S.K. Extra specificity from extradenticle: the partnership between HOX and PBX/EXD homeodomain proteins. Trends Genet. 1996;12(7):258–262. doi: 10.1016/0168-9525(96)10026-3. [DOI] [PubMed] [Google Scholar]
- 51.Chang C.P., Shen W.F., Rozenfeld S., Lawrence H.J., Largman C., Cleary M.L. Pbx proteins display hexapeptide-dependent cooperative DNA binding with a subset of Hox proteins. Genes Dev. 1995;9(6):663–674. doi: 10.1101/gad.9.6.663. [DOI] [PubMed] [Google Scholar]
- 52.Chang C.P., Brocchieri L., Shen W.F., Largman C., Cleary M.L. Pbx modulation of Hox homeodomain amino-terminal arms establishes different DNA-binding specificities across the Hox locus. Mol Cell Biol. 1996;16(4):1734–1745. doi: 10.1128/mcb.16.4.1734. [DOI] [PMC free article] [PubMed] [Google Scholar]
- 53.Saleh M., Rambaldi I., Yang X.J., Featherstone M.S. Cell signaling switches HOX-PBX complexes from repressors to activators of transcription mediated by histone deacetylases and histone acetyltransferases. Mol Cell Biol. 2000;20(22):8623–8633. doi: 10.1128/mcb.20.22.8623-8633.2000. [DOI] [PMC free article] [PubMed] [Google Scholar]
- 54.Moskow J.J., Bullrich F., Huebner K., Daar I.O., Buchberg A.M. Meis1, a PBX1-related homeobox gene involved in myeloid leukemia in BXH-2 mice. Mol Cell Biol. 1995;15(10):5434–5443. doi: 10.1128/mcb.15.10.5434. [DOI] [PMC free article] [PubMed] [Google Scholar]
- 55.Mann R.S., Affolter M. Hox proteins meet more partners. Curr Opin Genet Dev. 1998;8(4):423–429. doi: 10.1016/s0959-437x(98)80113-5. [DOI] [PubMed] [Google Scholar]
- 56.Choe S.K., Lu P., Nakamura M., Lee J., Sagerstrom C.G. Meis cofactors control HDAC and CBP accessibility at Hox-regulated promoters during zebrafish embryogenesis. Dev Cell. 2009;17(4):561–567. doi: 10.1016/j.devcel.2009.08.007. [DOI] [PMC free article] [PubMed] [Google Scholar]
- 57.Deleersnijder W., Hong G., Cortvrindt R., Poirier C., Tylzanowski P., Pittois K. Isolation of markers for chondro-osteogenic differentiation using cDNA library subtraction. Molecular cloning and characterization of a gene belonging to a novel multigene family of integral membrane proteins. J Biol Chem. 1996;271(32):19475–19482. doi: 10.1074/jbc.271.32.19475. [DOI] [PubMed] [Google Scholar]
- 58.Namkoong S., Lee K.I., Lee J.I., Park R., Lee E.J., Jang I.S. The integral membrane protein ITM2A, a transcriptional target of PKA-CREB, regulates autophagic flux via interaction with the vacuolar ATPase. Autophagy. 2015;11(5):756–768. doi: 10.1080/15548627.2015.1034412. [DOI] [PMC free article] [PubMed] [Google Scholar]
- 59.Aburatani, Hiroyuki (Tokyo, JP), Ishikawa, Shumpei (Tokyo, JP), Kawai, Shigeto (Tokyo, JP), inventor; Chugai Seiyaku Kabushiki Kaisha (Kita-ku, Tokyo, JP), The University of Tokyo (Bunkyo-ku, Tokyo, JP), assignee. Diagnosis and treatment of cancer using anti-itm2a antibody. United States, 20140193420, 2014, http://www.freepatentsonline.com/y2014/0193420.html.
- 60.Plowright L., Harrington K.J., Pandha H.S., Morgan R. HOX transcription factors are potential therapeutic targets in non-small-cell lung cancer (targeting HOX genes in lung cancer) Br J Cancer. 2009;100(3):470–475. doi: 10.1038/sj.bjc.6604857. [DOI] [PMC free article] [PubMed] [Google Scholar]
- 61.Morgan R., Boxall A., Harrington K.J., Simpson G.R., Gillett C., Michael A. Targeting the HOX/PBX dimer in breast cancer. Breast Cancer Res Treat. 2012;136(2):389–398. doi: 10.1007/s10549-012-2259-2. [DOI] [PubMed] [Google Scholar]
- 62.Morgan R., Boxall A., Harrington K.J., Simpson G.R., Michael A., Pandha H.S. Targeting HOX transcription factors in prostate cancer. BMC Urol. 2014;14:17. doi: 10.1186/1471-2490-14-17. [DOI] [PMC free article] [PubMed] [Google Scholar]
- 63.Morgan R., Pirard P.M., Shears L., Sohal J., Pettengell R., Pandha H.S. Antagonism of HOX/PBX dimer formation blocks the in vivo proliferation of melanoma. Cancer Res. 2007;67(12):5806–5813. doi: 10.1158/0008-5472.CAN-06-4231. [DOI] [PubMed] [Google Scholar]
- 64.Li Z., Zhang Z., Li Y., Arnovitz S., Chen P., Huang H. PBX3 is an important cofactor of HOXA9 in leukemogenesis. Blood. 2013;121(8):1422–1431. doi: 10.1182/blood-2012-07-442004. [DOI] [PMC free article] [PubMed] [Google Scholar]
- 65.Alharbi R.A., Pandha H.S., Simpson G.R., Pettengell R., Poterlowicz K., Thompson A. Inhibition of HOX/PBX dimer formation leads to necroptosis in acute myeloid leukemia cells. Oncotarget. 2017;8(52):89566–89579. doi: 10.18632/oncotarget.20023. [DOI] [PMC free article] [PubMed] [Google Scholar]
Associated Data
This section collects any data citations, data availability statements, or supplementary materials included in this article.
Data Availability Statement
The NCBI Gene Expression Omnibus datasets are available using the following links:
GSE6891: https://www.ncbi.nlm.nih.gov/geo/query/acc.cgi?acc=GSE6891.
GSE1159: https://www.ncbi.nlm.nih.gov/geo/query/acc.cgi?acc=GSE1159.
TCGA (The Cancer Genome Atlas) dataset is available using the following link: https://portal.gdc.cancer.gov/projects/TCGA-LAML.