

Summary
Phase separation can produce local structures with specific functionality in the cell, and in the nucleus, this can lead to chromatin reorganization. Microrchidia 3 (MORC3) is a human ATPase that has been implicated in autoimmune disorders and cancer. Here, we show that MORC3 forms phase-separated condensates with liquid-like properties in the cell nucleus. Fluorescence live-cell imaging reveals that the MORC3 condensates are heterogeneous and undergo dynamic morphological changes during the cell cycle. The ATPase activity of MORC3 drives its phase separation in vitro and requires DNA binding and releasing the MORC3 CW domain-dependent autoinhibition through association with histone H3. Our findings suggest a mechanism by which the ATPase function of MORC3 mediates MORC3 nuclear compartmentalization.
Subject Areas: Biophysical Chemistry, Biological Sciences, Molecular Biology
Graphical Abstract
Highlights
-
•
MORC3 forms nuclear condensates with liquid-like characteristics
-
•
Morphology of the MORC3 condensates changes during the cell cycle
-
•
Phase separation depends on the MORC3 ATPase activity and DNA binding
-
•
CW impedes the ability of MORC3 to form condensates
Biophysical Chemistry; Biological Sciences; Molecular Biology
Introduction
Microrchidia 3 (MORC3) ATPase is associated with a number of human diseases, including autoimmune disorders, Down syndrome, cancer, and viral infection (Andrews et al., 2016, Gonzalez-Fernandez et al., 2012, Gunawardena et al., 2009, Li et al., 2016, Sloan et al., 2016, Ver et al., 2015). This multi-modular enzyme contains an N-terminal ATPase-CW cassette followed by a long and largely unstructured C-terminal region, harboring at least one coiled-coil and several SUMOylation sites. MORC3 exists in autoinhibited and active states, and the mechanism underlying the state transition has recently been elucidated (Andrews et al., 2016, Zhang et al., 2019a). A tight binding of the CW domain to the adjacent catalytic ATPase domain impedes the ATPase domain's association with DNA necessary for the catalytic activity of MORC3, resulting in MORC3 autoinhibition. Competitive binding of the CW domain to histone H3, particularly methylated at lysine 4 (H3K4me), frees the ATPase domain for the interaction with DNA, alleviating autoinhibition. The influenza virus A protein NS1, which contains the amino acid sequence similar to that of histone H3K4me, has also been shown to activate MORC3, evading anti-viral immune response (Zhang et al., 2019b).
In cells, both endogenous and overexpressed MORC3 forms nuclear bodies (NBs) in promyelocytic leukemia protein (PML)-dependent and PML-independent manner (Andrews et al., 2016, Mimura et al., 2010). The number of PML-independent MORC3-NBs appears to vary among cell types, accounting for only 5% in mouse embryonic fibroblasts but making up 70%–85% in mouse bone marrow, solenocytes, and CD11b+ cells (Mimura et al., 2010). The formation of PML-independent MORC3-NBs relies on the ATPase activity, whereas colocalization with the PML bodies depends on MORC3 SUMOylation (Mimura et al., 2010). PML bodies, Cajal bodies, speckles, and other membraneless compartments are frequently observed in eukaryotic nuclei and are thought to be produced through phase separation (Banani et al., 2017, Hyman et al., 2014). These biomolecular condensates are typically micron scale in size, have liquid or gel-like properties, and allow for their components to be concentrated and be available for rapid multiple interactions.
Nuclear condensates and droplets formed through phase separation as a result of non-specific multivalent interactions are very dynamic and can sense and alter local chromatin environment (Shin et al., 2018). For example, liquid droplets of the heterochromatin protein 1 alpha (HP1α), induced by phosphorylation of this major chromatin compactor, stimulate rapid DNA condensation and formation of dense heterochromatin domains (Larson et al., 2017, Strom et al., 2017). A few proteins have been shown to phase separate into liquid condensates within low-density euchromatic regions and were proposed to mechanically push out chromatin (Boehning et al., 2018, Nair et al., 2019, Shin et al., 2018).
In this study, we report that MORC3 is capable of forming liquid-like nuclear condensates through phase separation. The number of MORC3-NBs decreases during cell division but is re-established in daughter cells. The ATPase activity drives phase separation in vitro and requires binding of MORC3 to DNA. Our findings highlight a previously uncharacterized mechanism by which the ATPase activity facilitates MORC3 liquid-liquid phase separation in the cell nucleus.
Results and Discussion
MORC3 Forms Phase-Separated Condensates in Living Cells
MORC3 has been shown to associate with chromatin and form NBs (MORC3-NBs) in cells (Andrews et al., 2016, Li et al., 2016, Mimura et al., 2010). To gain insight into the nature and morphology of MORC3-NBs, we generated mCherry-tagged full-length MORC3 and visualized it in live HeLa cells stably expressing H2B-GFP (green fluorescent protein) by fluorescence microscopy (Figures 1A–1C). Throughout all experiments, three distinct patterns of mCherry-MORC3-NBs were observed in interphase (Figure S1). The majority of cells showed more than 30 small clusters, but some cells had a mixture of about 20 medium and small foci and a few cells displayed less than 10 foci with one or two being enlarged. All confocal microscopic images of MORC3-NBs demonstrated near-perfect rounded MORC3-NBs, indicative of liquid droplets (Figures 1A–1C and Video S1). This observation was consistent with previously reported immunostaining images of endogenous MORC3 (Mimura et al., 2010, Takahashi et al., 2007), supporting the notion that MORC3 forms NBs.
Figure 1.

MORC3 Phase Separates to Condensates in Cells
(A–C) Representative fluorescence microscopy images of live HeLa cells expressing H2B-GFP (green) and MORC3 labeled with mCherry (red). Scale bar, 5 μm.
(D) Representative FRAP images of mCherry-MORC3 expressed in HeLa cells. The images were taken before (left) and after (middle and right) photobleaching. The condensate that was bleached is indicated by a white arrow. Scale bar, 2 μm.
(E) FRAP curve of mCherry-MORC3 NBs in HeLa cells. The FRAP curve was obtained from averaging data from 10 cells. Error bars represent SEM.
(F) Representative images of MORC3-NBs before and after treatment with 10% 1,6-hexanediol. Scale bar, 2 μm.
A representative 3D projection of a living cell in interphase. Chromatin was labeled with H2B-GFP (green) and MORC3 labeled with mCherry (red) and visualized by confocal microscopy.
To characterize the physicochemical properties of MORC3-NBs, we measured the exchange kinetics of mCherry-MORC3 in selected foci by fluorescence recovery after photobleaching (FRAP) experiments. Cell images were collected at 10-s intervals for a duration of 270 s following the bleach, and changes in fluorescent signal of each bleached cluster were monitored (Figure 1D). The experiments were repeated on 10 MORC3-NBs, and an averaged signal intensity was normalized and plotted (Figure 1E). About 50% recovery of bleached fluorescence was observed within ∼4.5 min after photobleaching, which suggested that mCherry-MORC3-NBs are viscous liquid droplets, characterized by rapid protein diffusion within the droplet and rapid exchange with surrounding environment. In further support, treatment of the cells with 1,6-hexanediol, known to selectively dissolve liquid droplets, resulted in complete disappearance of MORC3-NBs within 2 min (Figure 1F). Collectively, these data indicate that MORC3 forms nuclear condensates through liquid-liquid phase separation.
MORC3-NBs Heterogeneity Is Cell Cycle Dependent
To examine the phase separation capability of MORC3 over time, we carried out time-lapse live cell confocal microscopy experiments using live HeLa cells expressing mCherry-MORC3 and H2B-GFP. Figure 2 and Video S2 show a representative cell undergoing a complete cycle of cell division with cell images collected every 10 min. We observed drastic changes in the number and volume of MORC3-NBs between interphase and metaphase, which suggested that MORC3-NBs functioning is cell cycle dependent (Figures 2A and 2D). In interphase, 10–60 min prior entering mitosis, over 40 evenly distributed MORC3-NBs were counted in the nucleus of a cell, and these droplets localized primarily to the chromatin regions of low H2B density (Figure 2A, top panel, and Figure 2D). The number of MORC3-NBs decreased to two to three in metaphase, and notably these remaining MORC3-NBs were detached from the metaphase plate and chromatin (Figure 2A, middle panel, and Figure 2D). After mitosis was complete, the number and distribution of MORC3-NBs in the nuclei of daughter cells were faithfully re-established (Figure 2A, bottom panel, and Figure 2D). These data demonstrate that the number of MORC3-NBs decreases concomitantly with chromatin compaction, as indicated by H2B volume, and increases after nuclear division coinciding with chromatin decondensation (Figure 2B). Analysis of MORC3-NBs in nuclei from time-lapse data, shown in Figure 2C, illustrates a clear trend of cell cycle stage-dependent MORC3-NB heterogeneity.
Figure 2.

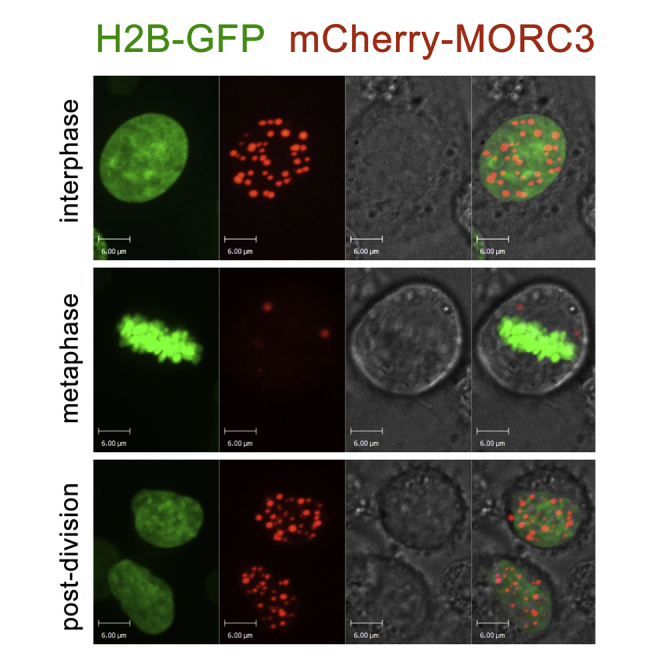
The Number of MORC3-NBs Changes during Cell Division
(A) A representative cell division with chromatin labeled with H2B-GFP (green) and MORC3 labeled with mCherry (red) visualized by confocal time-lapse microscopy in live cells. Foci numbers decrease in metaphase but recover to initial levels after cell division is complete. Scale bar, 6 μm.
(B) A plot of the changes of H2B volume (green) and MORC3 foci number (red) during cell division.
(C) Statistics and cartoon plots of the dynamic morphological change of MORC3-NBs after aligning cells to the entry point of mitosis.
(D) A representative cell division with chromatin labeled with H2B-GFP (green) and MORC3 labeled with mCherry (red) visualized by confocal time-lapse microscopy in live cells. Scale bar, 6 μm.
A representative cell division with chromatin labeled with H2B-GFP (green) and MORC3 labeled with mCherry (red) visualized by confocal time-lapse microscopy in living cells. Foci numbers decrease in metaphase but recover to initial levels after cell division is complete.
MORC3 Phase Separates to Liquid Droplets upon Binding to DNA
We have previously shown that binding of the ATPase domain to DNA is necessary for the catalytic function of MORC3 (Andrews et al., 2016, Zhang et al., 2019a), and Mimura et al. reported that the formation of PML-independent MORC3-NBs relies on the ATPase activity (Mimura et al., 2010). We therefore asked whether the interaction with DNA could induce MORC3 phase separation. To test this idea, we examined the ability of the isolated ATPase domain, the ATPase-CW cassette, and the C-terminal region of MORC3 to undergo phase separation in vitro (Figure S2). A clear solution of the recombinantly purified ATPase domain of MORC3 became visibly cloudy upon addition of 37-bp double-stranded DNA (Figure 3A). Visualizing the solution under a microscope revealed liquid-liquid separated droplets (Figure 3B). We note that this process is ATPase concentration dependent and that phase separation can be detected with naked eye when the ATPase concentration is above 13.3 μM (Figures 3C and S3).
Figure 3.

MORC3-ATPase Phase Separation Requires DNA
(A) Phase separation of 13.3 μM MORC3 ATPase with (right) or without (left) 6.7 μM 37-bp double-stranded (ds) DNA.
(B) A representative image of a sample containing 20 μM MORC3 ATPase and 10 μM 37-bp dsDNA on the surface of cover slides. Scale bar, 20 μm.
(C) Quantification of droplets counted in images acquired for indicated MORC3-ATPase concentrations.
(D) Quantification of MORC3-ATPase droplets in samples containing 13.3 μM MORC3 ATPase protein and 6.7 μM 15-bp dsDNA (black), 6.7 μM 37-bp dsDNA (orange), and 1.4 μM 601 DNA (red) without or with 2 mM ATP.
(E) Quantification of MORC3-ATPase droplets in samples containing 6.7 μM ATPase protein and 3.3 μM 37-bp dsDNA in the absence and presence of 2 mM AMPPNP and ADP.
(F) Representative images of 13.3 μM MORC3 ATPase with indicated amount of 37-bp dsDNA on the surface of cover slides. Scale bar, 10 μm.
(G) Quantification of (F).
(H) Representative confocal images of phase-separated MORC3-ATPase (13.3 μM) condensates (left and middle) or buffer with FAM-labeled DNA (6.7 μM) (right). Scale bar, 20 μm (left) and 10 μm (middle and right). Number of droplets were counted in a 50 × 50-μm square region (C, D, E, and G). For each sample, six square regions were counted. Error bars represent SEM.
See also Figures S2 and S3.
To assess if the catalytic function of the MORC3 ATPase domain influences phase separation, we compared formation of condensates in the absence and presence of 2 mM ATP (Figure 3D). Addition of ATP to the ATPase domain greatly stimulated the formation of condensates. It was particularly evident when 147-bp 601 DNA and 37-bp DNA were used in the reactions, in which we observed an 8- to 9-fold increase in droplet counts (Figure 3D, red and orange bars). Considerably fewer droplets were formed upon addition of 15-bp DNA with or without ATP (Figure 3D, black bars). These results are consistent with our previous findings that the dimeric MORC3 ATPase domain cooperatively binds to 37-bp DNA but is incapable of the cooperative binding to the short 15-bp DNA (Zhang et al., 2019a). Furthermore, the ATPase phase separation was induced by AMPPNP, a non-hydrolysable ATP analog known to stabilize the ATPase dimer, but not by ADP (Figure 3E) (Li et al., 2016, Zhang et al., 2019a). Excess of DNA reversed the ATPase phase separation, likely indicating saturation of the DNA-binding sites and also pointing to a role of electrostatic interactions in the formation of condensates (Figures 3F and 3G).
Phase separation can facilitate cellular compartmentalization and increase local concentration of biomolecules, therefore, we postulated that DNA could be concentrated within the MORC3 droplets. We tested this hypothesis by a droplet formation assay using 37-bp fluorescein (FAM)-labeled DNA (Figure 3H). The MORC3 ATPase condensates, induced by FAM-DNA, showed strong fluorescent signal in confocal microscopy, but no condensates were formed by FAM-labeled DNA itself (Figure 3H). A nearly complete overlay of the FAM-DNA signal and MORC3 droplets implies that DNA was concentrated in the MORC3 condensates.
Phase Separation Requires Active MORC3
The DNA-binding function of the MORC3 ATPase domain is impeded by the adjacent CW domain in the MORC3 autoinhibited state, but the interaction of CW with histone H3 tail, either unmodified or H3K4me, releases autoinhibition (Andrews et al., 2016, Zhang et al., 2019a). To determine if the phase separation capability of MORC3 is also suppressed by CW, we tested the ATPase-CW cassette in in vitro condensate formation assays (Figure 4). As shown in Figures 4A and 4C, DNA or H3K4me3 peptide that was added individually to the ATPase-CW cassette failed to promote phase separation; however, addition of both DNA and H3K4me3 led to the formation of ATPase-CW liquid droplets (Figures 4A–4C). Furthermore, MORC3 ATPase-CW was able to concentrate FAM-labeled DNA only in the presence of the histone H3K4me3 peptide (Figure 4D). The mixture of unmodified H3 peptide and DNA also promoted ATPase-CW droplet formation, although to a lesser degree, which is in agreement with a 5-to-10-fold decrease in binding activity of CW toward non-methylated H3 (H3K4me0) (Andrews et al., 2016, Li et al., 2012, Li et al., 2016, Liu et al., 2016) (Figures 4A and 4C). Importantly, MORC3 ATPase-CW phase separation was stimulated upon addition of the intact nucleosome, confirming the essential role of binding of CW to histone H3 tail, and therefore MORC3 activation in this process (Figure 4E).
Figure 4.

Phase Separation of MORC3 Is Impeded by the CW Domain
(A and B) Representative images of MORC3 ATPase-CW (20 μM) with or without 37-bp double-stranded DNA (5 μM) and histone H3K4me0 (1–12) and H3K4me3 (1–12) peptides (200 μM) on the surface of cover slides. Scale bar, 10 μm. As the MORC3 ATPase-CW condensates settled on the glass slide, droplets with irregular shapes gradually became spherical while small droplets fused together, as indicated by arrows in (B).
(C) Quantification of (A). Number of droplets was counted in a 50 × 50-μm square region. For each sample, six square regions were counted. Error bars represent SEM.
(D) Representative confocal images of phase-separated MORC3 ATPase-CW (20 μM) condensates in the presence of 6.7 μM FAM-labeled DNA and 200 μM H3K4me3 peptide (left). No condensates are detected without H3K4me3 peptide (right). Scale bar, 10 μm. See also Figure S2.
(E) Representative images of MORC3 ATPase-CW (20 μM) incubated with reconstituted unmodified nucleosome (10 μM) on the surface of cover slides. Scale bar, 10 μm.
Concluding Remarks
In this work, we show that MORC3 forms nuclear condensates through liquid-liquid phase separation that undergo substantial morphological changes in mitosis. The active state of the MORC3 ATPase-CW cassette drives phase separation, which requires concomitant binding of the ATPase domain to DNA and of the CW domain to histone H3 tail. In contrast, we found that the C-terminal region of MORC3, which is predicted to be mostly disordered, does not form liquid droplets itself, even at high protein concentration or upon incubation with DNA (data not shown). Our results further demonstrate that phase-separated MORC3 can concentrate free DNA within its droplets and, on the other hand, excess of DNA reduces the MORC3 droplet formation capability. Interestingly, the dynamic behavior of MORC3 condensates observed in mitosis is reminiscent of the behavior of PML NBs that co-accumulate several dozens of nuclear proteins (Dellaire et al., 2006). In future studies, it will be interesting to characterize and compare physicochemical properties of PML-dependent and PML-independent MORC3 NBs. It will also be important to determine the composition of MORC3-NBs in different cell cycle stages and examine whether other proteins can be recruited to MORC3-NBs.
Limitations of the Study
In this study, we overexpressed fluorescently labeled mCherry-MORC3 necessary for FRAP experiment in live HeLa cells. To fully characterize the morphological changes and phase separation properties of MORC3, studies using genome-edited cells expressing fluorescently tagged endogenous MORC3 may be considered.
Methods
All methods can be found in the accompanying Transparent Methods supplemental file.
Acknowledgments
We thank Anne Lehmkuhl for helping with experiments. This work was supported by grants from NIH GM106416, GM125195 and GM100907 to T.G.K. and from German Research Foundation DFG CA198/9-2 and German Federal Ministry of Education and Research (BMBF) GREWIS 02NUK017D to M.C.C. A.H.T. is an American Heart Association postdoctoral fellow.
Author Contributions
Y.Z., B.B., A.H.T, X.R., G.M.W. and J.B. performed experiments and together with M.C.C. and T.G.K. analyzed the data. Y.Z. and T.G.K. wrote the manuscript with input from all authors.
Declaration of Interests
The authors declare no competing interests.
Published: July 26, 2019
Footnotes
Supplemental Information can be found online at https://doi.org/10.1016/j.isci.2019.06.030.
Supplemental Information
References
- Andrews F.H., Tong Q., Sullivan K.D., Cornett E.M., Zhang Y., Ali M., Ahn J., Pandey A., Guo A.H., Strahl B.D. Multivalent chromatin engagement and inter-domain crosstalk regulate MORC3 ATPase. Cell Rep. 2016;16:3195–3207. doi: 10.1016/j.celrep.2016.08.050. [DOI] [PMC free article] [PubMed] [Google Scholar]
- Banani S.F., Lee H.O., Hyman A.A., Rosen M.K. Biomolecular condensates: organizers of cellular biochemistry. Nat. Rev. Mol. Cell. Biol. 2017;18:285–298. doi: 10.1038/nrm.2017.7. [DOI] [PMC free article] [PubMed] [Google Scholar]
- Boehning M., Dugast-Darzacq C., Rankovic M., Hansen A.S., Yu T., Marie-Nelly H., McSwiggen D.T., Kokic G., Dailey G.M., Cramer P. RNA polymerase II clustering through carboxy-terminal domain phase separation. Nat. Struct. Mol. Biol. 2018;25:833–840. doi: 10.1038/s41594-018-0112-y. [DOI] [PubMed] [Google Scholar]
- Dellaire G., Eskiw C.H., Dehghani H., Ching R.W., Bazett-Jones D.P. Mitotic accumulations of PML protein contribute to the re-establishment of PML nuclear bodies in G1. J. Cell Sci. 2006;119:1034–1042. doi: 10.1242/jcs.02817. [DOI] [PubMed] [Google Scholar]
- Gonzalez-Fernandez R., Morales M., Avila J., Martin-Vasallo P. Changes in leukocyte gene expression profiles induced by antineoplastic chemotherapy. Oncol. Lett. 2012;3:1341–1349. doi: 10.3892/ol.2012.669. [DOI] [PMC free article] [PubMed] [Google Scholar]
- Gunawardena H., Wedderburn L.R., Chinoy H., Betteridge Z.E., North J., Ollier W.E., Cooper R.G., Oddis C.V., Ramanan A.V., Davidson J.E. Autoantibodies to a 140-kd protein in juvenile dermatomyositis are associated with calcinosis. Arthritis Rheum. 2009;60:1807–1814. doi: 10.1002/art.24547. [DOI] [PMC free article] [PubMed] [Google Scholar]
- Hyman A.A., Weber C.A., Julicher F. Liquid-liquid phase separation in biology. Annu. Rev. Cell Dev. Biol. 2014;30:39–58. doi: 10.1146/annurev-cellbio-100913-013325. [DOI] [PubMed] [Google Scholar]
- Larson A.G., Elnatan D., Keenen M.M., Trnka M.J., Johnston J.B., Burlingame A.L., Agard D.A., Redding S., Narlikar G.J. Liquid droplet formation by HP1alpha suggests a role for phase separation in heterochromatin. Nature. 2017;547:236–240. doi: 10.1038/nature22822. [DOI] [PMC free article] [PubMed] [Google Scholar]
- Li S., Yen L., Pastor W.A., Johnston J.B., Du J., Shew C.J., Liu W., Ho J., Stender B., Clark A.T. Mouse MORC3 is a GHKL ATPase that localizes to H3K4me3 marked chromatin. Proc. Natl. Acad. Sci. U S A. 2016;113:E5108–E5116. doi: 10.1073/pnas.1609709113. [DOI] [PMC free article] [PubMed] [Google Scholar]
- Li X., Foley E.A., Molloy K.R., Li Y., Chait B.T., Kapoor T.M. Quantitative chemical proteomics approach to identify post-translational modification-mediated protein-protein interactions. J. Am. Chem. Soc. 2012;134:1982–1985. doi: 10.1021/ja210528v. [DOI] [PMC free article] [PubMed] [Google Scholar]
- Liu Y., Tempel W., Zhang Q., Liang X., Loppnau P., Qin S., Min J. Family-wide characterization of histone binding abilities of human CW domain containing proteins. J. Biol. Chem. 2016;291:9000–9013. doi: 10.1074/jbc.M116.718973. [DOI] [PMC free article] [PubMed] [Google Scholar]
- Mimura Y., Takahashi K., Kawata K., Akazawa T., Inoue N. Two-step colocalization of MORC3 with PML nuclear bodies. J. Cell Sci. 2010;123:2014–2024. doi: 10.1242/jcs.063586. [DOI] [PubMed] [Google Scholar]
- Nair S.J., Yang L., Meluzzi D., Oh S., Yang F., Friedman M.J., Wang S., Suter T., Alshareedah I., Gamliel A. Phase separation of ligand-activated enhancers licenses cooperative chromosomal enhancer assembly. Nat. Struct. Mol. Biol. 2019;26:193–203. doi: 10.1038/s41594-019-0190-5. [DOI] [PMC free article] [PubMed] [Google Scholar]
- Shin Y., Chang Y.C., Lee D.S.W., Berry J., Sanders D.W., Ronceray P., Wingreen N.S., Haataja M., Brangwynne C.P. Liquid nuclear condensates mechanically sense and restructure the genome. Cell. 2018;175:1481–1491.e13. doi: 10.1016/j.cell.2018.10.057. [DOI] [PMC free article] [PubMed] [Google Scholar]
- Sloan E., Orr A., Everett R.D. MORC3, a component of PML nuclear bodies, has a role in restricting herpes simplex virus 1 and human cytomegalovirus. J. Virol. 2016;90:8621–8633. doi: 10.1128/JVI.00621-16. [DOI] [PMC free article] [PubMed] [Google Scholar]
- Strom A.R., Emelyanov A.V., Mir M., Fyodorov D.V., Darzacq X., Karpen G.H. Phase separation drives heterochromatin domain formation. Nature. 2017;547:241–245. doi: 10.1038/nature22989. [DOI] [PMC free article] [PubMed] [Google Scholar]
- Takahashi K., Yoshida N., Murakami N., Kawata K., Ishizaki H., Tanaka-Okamoto M., Miyoshi J., Zinn A.R., Shime H., Inoue N. Dynamic regulation of p53 subnuclear localization and senescence by MORC3. Mol. Biol. Cell. 2007;18:1701–1709. doi: 10.1091/mbc.E06-08-0747. [DOI] [PMC free article] [PubMed] [Google Scholar]
- Ver L.S., Marcos-Villar L., Landeras-Bueno S., Nieto A., Ortin J. The cellular factor NXP2/MORC3 is a positive regulator of influenza virus multiplication. J. Virol. 2015;89:10023–10030. doi: 10.1128/JVI.01530-15. [DOI] [PMC free article] [PubMed] [Google Scholar]
- Zhang Y., Klein B.J., Cox K.L., Bertulat B., Tencer A.H., Holden M.R., Wright G.M., Black J., Cardoso M.C., Poirier M.G. Mechanism for autoinhibition and activation of the MORC3 ATPase. Proc. Natl. Acad. Sci. U S A. 2019 doi: 10.1073/pnas.1819524116. [DOI] [PMC free article] [PubMed] [Google Scholar]
- Zhang Y., Ahn J., Green K.J., Vann K.R., Black J., Brooke C.B., Kutateladze T.G. MORC3 is a target of the Influenza A viral protein NS1. Structure. 2019;27:1029–1033.e3. doi: 10.1016/j.str.2019.03.015. [DOI] [PMC free article] [PubMed] [Google Scholar]
Associated Data
This section collects any data citations, data availability statements, or supplementary materials included in this article.
Supplementary Materials
A representative 3D projection of a living cell in interphase. Chromatin was labeled with H2B-GFP (green) and MORC3 labeled with mCherry (red) and visualized by confocal microscopy.
A representative cell division with chromatin labeled with H2B-GFP (green) and MORC3 labeled with mCherry (red) visualized by confocal time-lapse microscopy in living cells. Foci numbers decrease in metaphase but recover to initial levels after cell division is complete.