Abstract
Many patients with type 1 diabetes mellitus suffer from progressive diabetic kidney disease (DKD). The progression of DKD is largely attributed to mitochondrial dysfunction, with key contributions from mitochondrial reactive oxygen species. Recent studies have revealed that the antimalarial drug artemether has antidiabetic effects. To identify potential effects on type 1 DKD in the present study, mice with streptozotocin-induced diabetes were treated with artemether. Treatment reduced urinary excretion of albumin and tubular injury biomarkers, increased serum albumin and total protein levels, and attenuated renal hypertrophy. In addition, artemether treatment prevented hyperglycemia, raised serum insulin levels, and restored glucagon/insulin and somatostatin/insulin ratios in islets. We found that artemether improved mitochondrial function and regulated redox balance in kidney. These results demonstrate that artemether provides renal protection in type 1 diabetes mellitus, which may be due to improved mitochondrial function.
Keywords: Artemether, diabetic kidney disease, mitochondrial function
Introduction
Diabetes is the leading cause of chronic kidney disease and end-stage renal disease. Although strict control of blood glucose and blood pressure slow disease progression, many patients still suffer from progressive diabetic kidney disease (DKD) [1]. The factors that precipitate the development and progression of DKD remain elusive, particularly in patients with type 1 diabetes (T1D) mellitus [2]. Therefore, studies investigating the pathogenesis and exploring new medications are urgently needed.
The kidneys are mitochondria-rich, highly metabolic organs that require vast amount of energy [3]. Mitochondrial stress can rapidly activate cytosolic signaling pathways that ultimately alter nuclear gene expression [4]. Mitochondrial dysfunction is increasingly postulated to be central to DKD progression [5]. The conventional theory is that hyperglycemia leads to overproduction of reactive oxygen species (ROS) which drive diabetic complications. However, this hypothesis has been challenged by the negative results of antioxidant-based clinical trials [6]. Moreover, superoxide production is reduced in the kidneys of mice with streptozotocin (STZ)-induced diabetes, a model of T1D [7]. Increased mitochondrial superoxide production is considered an indicator of healthy mitochondria [8]. Accumulating evidence indicates that ROS are not simply byproducts of mitochondrial metabolism, but play a critical role in the regulation of a wide variety of biological processes [9]. Mitochondrial superoxide can be converted to hydrogen peroxide (H2O2) by superoxide dismutase (SOD) enzymes to induce cellular effects [10].
Artemether is a methyl ether derivative of artemisinin used for the treatment of malaria [11]. Previous studies found that artemether and other artemisinin derivatives exhibit antidiabetic effects [12] as well as antiviral, fungicidal, anti-inflammatory, antiasthma, and anticancer effects [13]. However, the effect of artemether on DKD in T1D has not been investigated. Thus, the aim of the present study is to determine the effects and underlying mechanisms of artemether on DKD in T1D.
Materials and methods
Animal experiments
Animal studies were approved by the Guangzhou University of Chinese Medicine Institutional Animal Care and Use Committee and were performed under protocols in accordance with relevant guidelines and regulations. Male C57BL/6J mice were obtained from Guangdong Medical Laboratory Animal Center and were housed in the Central Animal Facility at Shenzhen Graduate School of Peking University. The T1D mice were induced by the administration of multiple low doses of STZ (55 mg/kg, dissolved in citrate buffer) to mice (22-26 g) intraperitoneally on 5 consecutive days. Normal T1D-control (T1D-ctrl) mice were intraperitoneally injected with an equal volume of citrate buffer. The diabetic mice were randomly allocated into STZ group and STZ + artemether (STZ + Art) group according to the fasting blood glucose 9 days after the last injection of STZ. Mice in T1D-ctrl and STZ groups were fed with regular diet, and mice in STZ + Art group were fed a regular diet supplemented with 0.67 g/kg artemether (ChengDu ConBon Biotech Co., LTD, China). The treatment lasted for 8 weeks.
Tissue preparation
At the end of the study, blood, pancreas, and kidney samples were collected immediately after the mice were sacrificed. Pancreas and kidney tissue samples were fixed in 10% formalin for histopathological examination and immunofluorescence staining, and other kidney tissue samples were used to isolate mitochondria or immediately snap-frozen in liquid nitrogen and stored at -80°C for later analysis.
Physiological and metabolic parameters
Fasting blood glucose was measured using a blood glucose meter (Roche, Basel, Switzerland). Urine was collected using metabolic cages (Tecniplast, Buguggiate, Italy). Glycosylated hemoglobin A1c (HbA1c) levels were measured using an Ultra2 HbA1c analyzer (Primus, Kansas City, MO, USA). Serum total protein (TP), albumin (ALB), urinary glucose, and N-acetyl-β-d-glucosaminidase (NAG) levels were detected using an automatic biochemical analyzer (Roche).
Light microscopy
Kidney sections (4 μm) were stained with periodic acid-Schiff (PAS) and scanned by a slide scanner (Motic Easyscan Digital Slide Scanner, Xiamen, China) to evaluate renal pathological alterations. A total of 30-40 renal glomerular tuft areas (GTAs), 30-40 renal glomerular mesangial matrix areas, 35-60 proximal renal tubular areas (PAS staining possessing brush border) and tubular lumen areas (axial ratio less than 1.5) were measured. The renal glomerular tuft volume (GTV) was calculated using a previously described method [14]. The tubular wall area was calculated by subtracting the tubular lumen area from the renal tubular area. Paraffin-embedded pancreas sections (3 μm) were stained with hematoxylin and eosin (H&E) and scanned to measure the mean islet area. The images were analyzed using ImageJ software (National Institutes of Health, Bethesda, MD, USA).
Immunostaining analysis
Pancreatic sections were deparaffinized and rehydrated. Then, the sections were subjected to antigen retrieval by boiling in citric acid buffer (pH 6) for 20 min. After rinsing three times with phosphate-buffered saline, the sections were incubated with primary antibodies against insulin (Cell Signaling Technology, Danvers, MA, USA), glucagon (Abcam, Cambridge, UK), and somatostatin (GeneTex, Irvine, CA, USA) overnight at 4°C. The sections were then washed with rinse buffer and incubated for 1 h at room temperature with Alexa Fluor-conjugated secondary antibodies. The fluorescence was visualized and imaged with a confocal microscope (LSM710, Carl Zeiss, Oberkochen, Germany). Four to 10 photographs were randomly selected in each pancreas section to calculate the ratio of glucagon/insulin and somatostatin/insulin in islets.
Enzyme-linked immunosorbent assay (ELISA)
Enzyme-linked immunosorbent assay kits were used to measure urine albumin (Bethyl Laboratories, Montgomery, TX, USA), neutrophil gelatinase-associated lipocalin (NGAL; R&D Systems, Minneapolis, MN, USA), kidney injury molecule-1 (Kim-1; R&D Systems), and serum insulin (Merck Millipore, Danvers, MA, USA) according to the manufacturer’s instructions.
Kidney mitochondria isolation and mitochondrial H2O2 release rate assay
Kidney mitochondria were isolated as previously described [15]. The mitochondrial H2O2 release rate was measured using Amplex UltraRed reagent (Invitrogen, Carlsbad, CA, USA) according to the manufacturer’s instructions. Briefly, equivalent amounts of mitochondrial proteins in each group were incubated in mitochondrial assay medium. Then Amplex UltraRed/horseradish peroxidase work solution was added to each microplate well to initiate the reaction. The fluorescence was measured at excitation and emission wavelengths of 490 nm and 585 nm, respectively, using a Synergy H1 microplate reader (BioTek Instruments, Winooski, VT, USA).
Immunoblotting analysis
Renal cortex samples (homogenized in lysis buffer) and mitochondrial proteins were prepared in sample loading buffer (Bio-Rad, Hercules, CA, USA) and separated on SDS-PAGE gels and transferred to PVDF membranes (Merck Millipore). After blocking in Tris-buffered saline containing 5% nonfat dry milk for 1 h at room temperature, the membranes were incubated and gently shaken overnight at 4°C with primary antibodies. After washing with Tris-buffered saline, the membranes were incubated with secondary antibodies for 1 h at room temperature with shaking. After washing, the protein bands were detected and analyzed using a ChemiDoc MP imaging system (Bio-Rad). β-Actin and voltage-dependent anion channel (VDAC) were used as the loading controls for renal cortex protein and mitochondrial protein, respectively. Primary antibodies against catalase, superoxide dismutase 2 (SOD2), and VDAC were obtained from Cell Signaling Technology. The antibody against peroxisome proliferator-activated receptor γ coactivator 1α (PGC-1α) was obtained from Novus Biologicals (Littleton, CO, USA), the pyruvate dehydrogenase kinase 1 (PDK1) antibody was obtained from Enzo Life Science (Farmingdale, NY, USA), and the β-actin antibody was obtained from Sigma Aldrich (St. Louis, MO, USA).
mRNA analysis
Total RNA was isolated from renal tissue by using the TRIzol Plus RNA purification kit (Invitrogen). First-strand cDNA was synthesized with oligo(dT)12-18 primers and M-MLV reverse transcriptase (Invitrogen) according to the manufacturer’s instructions. Real-time quantitative PCR was performed using SYBR green master mix (Applied Biosystems, Foster City, CA, USA) and gene-specific primers in the Stratagene M × 3000 P real-time PCR system (Agilent Technologies, Santa Clara, CA, USA). The primers were synthesized by Sangon Biotechnology Company (Shanghai, China) and designed to detect catalase (forward, GGACGCTCAGCTTTTCATTC; reverse, TTGTCCAGAAGAGCCTGGAT), SOD2 (forward, CCCAGACCTGCCTTACGACTAT; reverse, GGTGGCGTTGAGATTGTTGA), and β-actin (forward, GGACTCCTATGTGGGTGACG; reverse, AGGTGTGGTGCCAGATCTTC). The amplification conditions were 95°C for 5 min followed by 45 cycles of 95°C for 15 s, 55°C for 15 s, and 72°C for 20 s. Relative mRNA expression was calculated by the 2-ΔΔCT method normalized against the housekeeping gene β-actin.
Immunohistochemistry
Kidney paraffin sections (4 μm) were mounted on slides, dewaxed, and rehydrated. Antigen retrieval was performed by boiling in sodium citrate buffer (pH 6) for 20 min and then cooling to room temperature. Sections were treated with 3% H2O2 for 10 min, blocked with goat serum for 30 min, and then incubated with primary antibodies against catalase and SOD2 overnight at 4°C. After washing with rinse buffer, the sections were incubated with horseradish peroxidase-polymer conjugated anti-mouse/rabbit IgG complex (MaiXin, Fuzhou, China) for 15 min, with diaminobenzidine as a chromogen for 1 min and hematoxylin as a counterstain for 2 min.
Statistical analysis
Data are expressed as mean ± standard deviations. Data analysis was performed using SPSS statistics software (IBM, Armonk, NY, USA). Comparisons between two groups were performed using unpaired Student’s t tests. Differences among multiple groups were analyzed by using one-way ANOVA. Significance was defined as P < 0.05.
Results
Artemether improved mitochondrial function and regulated mitochondrial redox balance
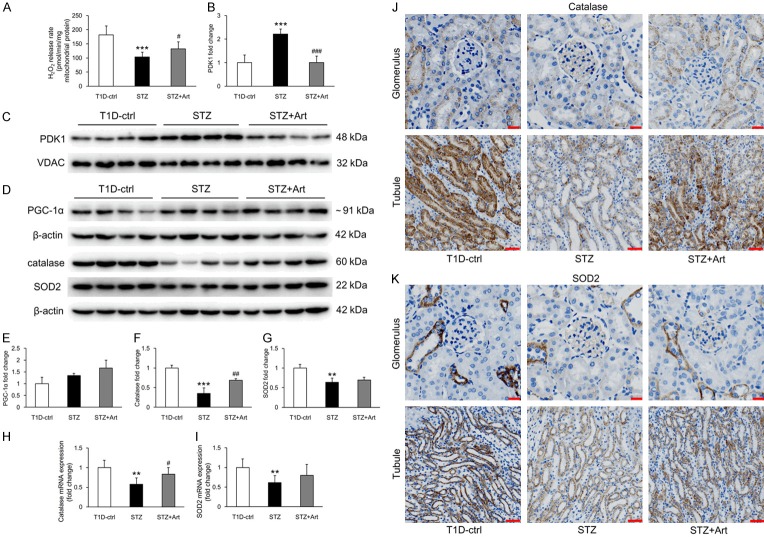
As the production of superoxide is considered as an indicator of healthy mitochondria and physiological oxidative phosphorylation, we assessed mitochondrial H2O2 release in renal tissues to address the effect of artemether on mitochondrial function. As shown in Figure 1A, the renal mitochondrial H2O2 release rate was significantly lower in diabetic mice (STZ group) than in controls. However, 8 weeks of artemether treatment significantly increased mitochondrial H2O2 release rate. Additionally, mitochondrial protein PDK1 levels were higher in the STZ group than in controls and were significantly reduced by artemether treatment (Figure 1B and 1C). However, no significant difference in PGC-1α was observed in renal tissues from control and STZ mice, with a small but insignificant increase in the group treated with artemether (Figure 1D and 1E). Levels of catalase and SOD2, important proteins regulating mitochondrial redox balance, decreased in the STZ mice; artemether treatment significantly upregulated expression of catalase but not SOD2 (Figure 1D, 1F and 1G). qPCR analyses revealed that catalase and SOD2 mRNA levels in renal tissues (Figure 1H and 1I) were consistent with the protein levels. As shown in Figure 1J and 1K, catalase and SOD2 were primarily expressed in tubules and scarcely expressed in glomeruli.
Figure 1.
Artemether improved mitochondrial function and regulated mitochondrial redox balance. A. Mitochondrial H2O2 release rate in each group after artemether treatment for 8 weeks. n = 6 per group. B. Fold changes of PDK1 expression after normalization to VDAC. n = 4 per group. C. Western blot images of renal mitochondrial PDK1 in various group at 8 weeks. D. Western blot images of renal tissue protein PGC-1α, catalase, and SOD2 in various group at 8 weeks. E-G. Fold changes of PGC-1α, catalase, and SOD2 expression after normalization to β-actin. n = 4 per group. H, I. Relative mRNA expression of catalase and SOD2 in renal tissue after normalization to β-actin. n = 6 per group. J, K. Immunohistochemical staining of catalase and SOD2 in glomerulus and tubule. Scale bars: 20 μm for glomerulus; 50 μm for tubule. **P < 0.01 and ***P < 0.001 vs. the T1D-ctrl group. #P < 0.05, ##P < 0.01 and ###P < 0.001 vs. the STZ group.
Artemether reduced urinary excretion of albumin and tubular injury biomarkers and increased serum ALB and TP levels
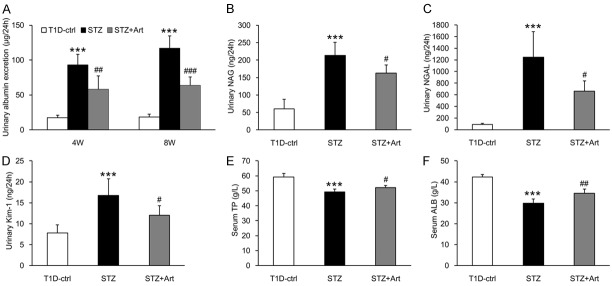
As shown in Figure 2A, urinary albumin excretion in the STZ group mice was significantly higher than in the control group at 4 weeks and increased further at 8 weeks. Artemether treatment significantly reduced urinary albumin excretion. As renal proximal tubules also play a major role in the development of albuminuria during early stages of DKD, we measured tubular injury biomarkers in urine samples. Figure 2B-D show that the excretion of NAG, NGAL, and Kim-1 in urine increased significantly in the STZ group mice at 8 weeks and decreased significantly with artemether treatment. In addition, artemether treatment ameliorated the decreases in serum TP and ALB levels induced by STZ (Figure 2E and 2F).
Figure 2.
Artemether reduced urinary excretion of albumin and tubular injury biomarkers, and increased serum ALB and TP levels. A. Urinary albumin excretion at 4 and 8 weeks in various groups. B-D. Urinary excretion of NAG, NGAL, and Kim-1 at 8 weeks in each group. E, F. Serum TP and ALB levels at 8 weeks in each group. n = 6 per group. ***P < 0.001 vs. the T1D-ctrl group. #P < 0.05, ##P < 0.01 and ###P < 0.001 vs. the STZ group.
Artemether attenuated renal hypertrophy in DKD from T1D
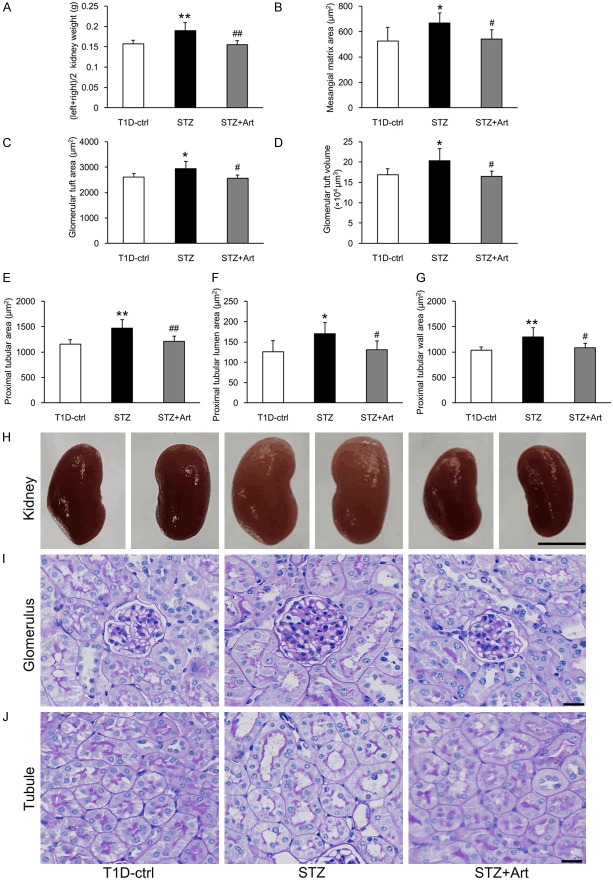
At the end of the experiment, the kidneys from mice in the STZ group mice were significantly heavier than in the control group, and artemether treatment decreased the diabetic kidney weight significantly (Figure 3A and 3H). In accordance with the enlarged kidneys, mice in the STZ group exhibited increased mesangial matrix areas and hypertrophic glomeruli and proximal tubules. These pathological changes were all attenuated by artemether treatment for 8 weeks (Figure 3B-G, 3I and 3J).
Figure 3.
Effects of artemether on kidney weight, mesangial matrix area, and glomerular and proximal tubular size. A. Kidney weights in each group at the end of the study. B-D. Bar graphs indicating the mesangial matrix area, GTA and GTV of each group. E-G. Bar graphs indicating the proximal tubular area, tubular lumen and wall area in various groups. H. Representative kidney images. Scale bars, 5 mm. I. PAS staining for the glomerulus. Scale bars, 20 μm. J. PAS staining for the renal tubule. Scale bars, 20 μm. n = 6 per group. *P < 0.05 and **P < 0.01 vs. the T1D-ctrl group. #P < 0.05 and ##P < 0.01 vs. the STZ group.
Artemether improved typical diabetic symptoms and prevented hyperglycemia
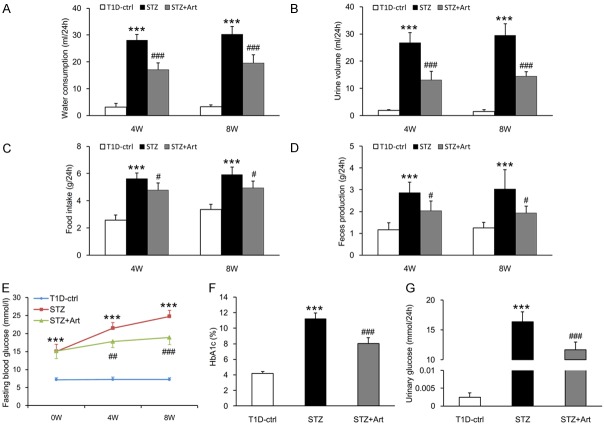
Mice in the STZ group exhibited typical diabetic symptoms, including polydipsia, polyuria, polyphagia, and increased feces production. These diabetic symptoms were all improved by artemether (Figure 4A-D). Fasting blood glucose in STZ group mice was significantly higher than control group at 0 week, and the difference became more pronounced at 4 and 8 weeks. Whereas fasting blood glucose levels were similar between STZ and STZ + Art groups at 0 week, levels in the STZ + Art group were significantly decreased by artemether treatment at 4 and 8 weeks (Figure 4E). HbA1c and urinary glucose levels in the STZ group were significantly higher than in the control group at 8 weeks (Figure 4F and 4G). Artemether treatment significantly reduced HbA1c and urinary glucose levels (Figure 4F and 4G).
Figure 4.
Artemether improved typical diabetic symptoms and prevented hyperglycemia. (A) Water consumption, (B) Urine volume, (C) Food intake, and (D) Feces production at 4 and 8 weeks in various groups. (E) The line chart indicating the changes of fasting blood glucose during the experiment. (F, G) Bar graphs representing the quantification of HbA1c and urinary glucose at the end of the study. n = 6 per group. ***P < 0.001 vs. the T1D-ctrl group. #P < 0.05, ##P < 0.01 and ###P < 0.001 vs. the STZ group.
Artemether raised serum insulin and restored glucagon/insulin and somatostatin/insulin ratios in islets
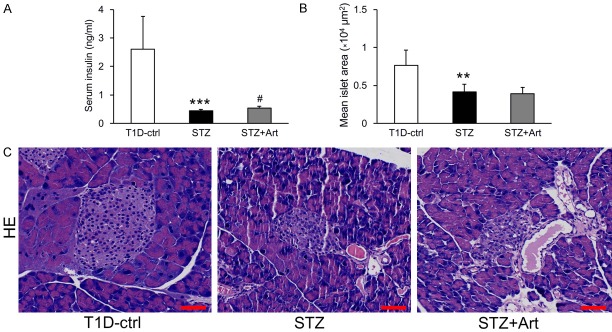
Diabetic STZ mice displayed significantly lower serum insulin levels than control mice at the end of the study (Figure 5A). H&E staining revealed that the mean islet area in the STZ group also decreased significantly (Figure 5B and 5C). Although artemether treatment significantly raised serum insulin levels (Figure 5A), the mean islet area values were similar between the STZ + Art and STZ groups (Figure 5B and 5C). To explore the impact of artemether on pancreatic islet function, we immunostained pancreas sections for insulin, glucagon, and somatostatin and found that ratios of glucagon/insulin and somatostatin/insulin in the STZ group were significantly higher than in control mice. Artemether treatment reduced them significantly, which may explain the increase in serum insulin (Figure 6A-C).
Figure 5.
Effects of artemether on serum insulin level and pancreatic islet size. A. Serum insulin levels in each group at the end of the study. B. Quantification of mean islet area in different groups. C. Representative images of pancreatic H&E staining for determination of islet size. Scale bars, 50 μm. n = 6 per group. **P < 0.01 and ***P < 0.001 vs. the T1D-ctrl group. #P < 0.05 vs. the STZ group.
Figure 6.
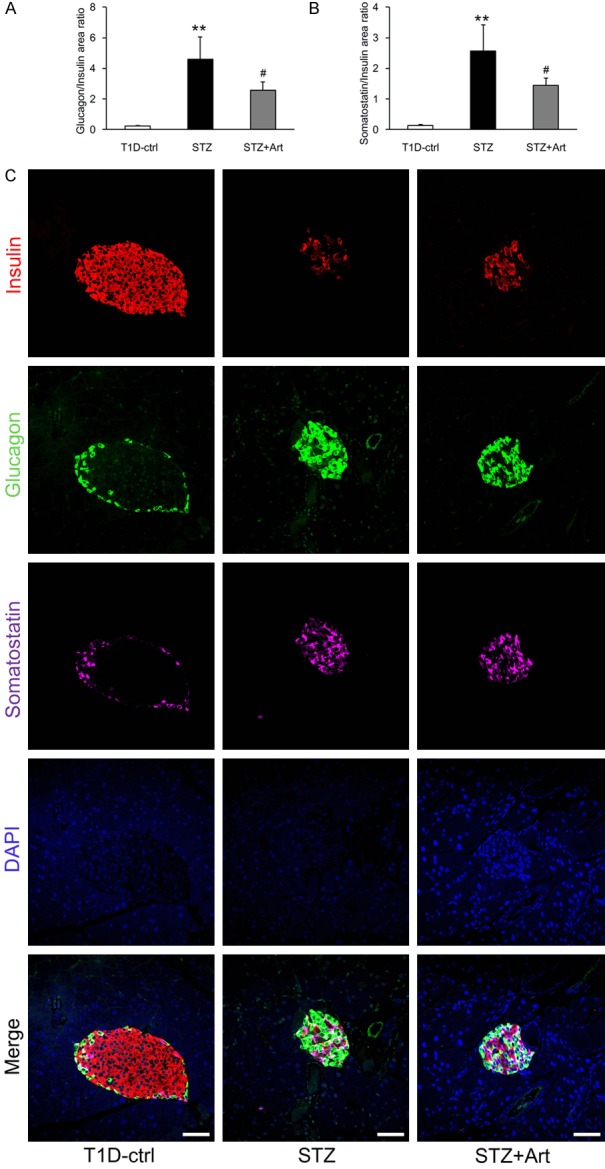
Artemether restored the glucagon/insulin and somatostatin/insulin ratios in islets. A, B. Quantification of glucagon/insulin and somatostatin/insulin ratios in islets in different groups at the end of the study. n = 4 per group. C. Representative confocal images depicting insulin, glucagon and somatostatin coimmunostaining in islets. Scale bars, 50 μm. **P < 0.01 vs. the T1D-ctrl group. #P < 0.05 vs. the STZ group.
Discussion
The present study indicates that artemether prevents kidney injury in T1D and the mechanism underlying this effect may be associated with the regulation of mitochondrial function.
The results show that artemether treatment reduced urinary albumin excretion and increased serum total protein and albumin levels. It is widely accepted that glomerular abnormalities lead to proteinuria [16]. However, other studies demonstrated that impaired tubular function also contributes to albuminuria generation, especially in DKD [17]. In this study, artemether reduced urinary excretion of tubular injury biomarkers including NGAL, NAG, and Kim-1. These well explained the lowering effect of artemether on proteinuria. Artemether treatment also prevented renal hypertrophy, a characteristic of early DKD. Previous study revealed that fasting blood glucose and HbA1c level were strongly correlated with kidney volume which indicates that hyperglycemia induces renal hypertrophy [18]. So we inferred that the renal pathological improvement by artemether might be associated with its hypoglycemic effect. Pancreatic islet dysfunction is central to the progression of diabetes, and insulin dependent T1D is characterized by the loss or dysfunction of pancreatic β cells [19]. Pancreatic islets were destroyed by STZ, and although artemether treatment did not increase the mean islet area, it ameliorated the imbalanced ratio of α, δ, and β cells, which contributes to T1D progression [20,21]. These effects may underpin the increase in insulin levels observed in animals treated with artemether. However, further investigations are needed to elucidate the mechanisms responsible for this.
The diabetic kidney is characterized by mitochondrial dysfunction and the Warburg effect [22]. PDK1, a kinase that inactivates pyruvate dehydrogenase [23], may promote glycolysis and increase conversion of pyruvate to lactate by excluding pyruvate from mitochondrial consumption. The results in this study revealed that PDK1 levels are increased in mitochondria in the diabetic kidney. Treatment with artemether reduced these levels, suggesting improved pyruvate oxidation in mitochondria. It is increasingly appreciated that mitochondrial ROS act as signalling molecules in physiology. Consistent with previous study [7], STZ administration reduced the renal mitochondrial H2O2 release rate in this study, indicating that mitochondrial function was impaired. Furthermore, there was evidence of mitochondrial redox imbalance, as catalase and SOD2 expression in renal tissues was also reduced. Treatment with artemether reversed these effects, indicating that improved mitochondrial function protects the kidneys in T1D.
Altogether, the results of these experiments demonstrate that artemether exerts renal protective effects in T1D. This protection likely involves an improvement of mitochondrial function. However, the detailed mechanisms underlying this still need further investigation.
Acknowledgements
This study was supported by grants from National Natural Science Foundation of China (81673794, 81704012), Shenzhen Science and Technology Project (JCYJ20160330171116798, JCYJ20160428182542525), and Sanming Project of Medicine in Shenzhen (SZSM201512040).
Disclosure of conflict of interest
None.
References
- 1.Anders HJ, Huber TB, Isermann B, Schiffer M. CKD in diabetes: diabetic kidney disease versus nondiabetic kidney disease. Nat Rev Nephrol. 2018;14:361–377. doi: 10.1038/s41581-018-0001-y. [DOI] [PubMed] [Google Scholar]
- 2.Katsarou A, Gudbjornsdottir S, Rawshani A, Dabelea D, Bonifacio E, Anderson BJ, Jacobsen LM, Schatz DA, Lernmark A. Type 1 diabetes mellitus. Nat Rev Dis Primers. 2017;3:17016. doi: 10.1038/nrdp.2017.16. [DOI] [PubMed] [Google Scholar]
- 3.Galvan DL, Green NH, Danesh FR. The hallmarks of mitochondrial dysfunction in chronic kidney disease. Kidney Int. 2017;92:1051–1057. doi: 10.1016/j.kint.2017.05.034. [DOI] [PMC free article] [PubMed] [Google Scholar]
- 4.Quiros PM, Mottis A, Auwerx J. Mitonuclear communication in homeostasis and stress. Nat Rev Mol Cell Biol. 2016;17:213–226. doi: 10.1038/nrm.2016.23. [DOI] [PubMed] [Google Scholar]
- 5.Forbes JM, Thorburn DR. Mitochondrial dysfunction in diabetic kidney disease. Nat Rev Nephrol. 2018;14:291–312. doi: 10.1038/nrneph.2018.9. [DOI] [PubMed] [Google Scholar]
- 6.Forbes JM, Coughlan MT, Cooper ME. Oxidative stress as a major culprit in kidney disease in diabetes. Diabetes. 2008;57:1446–1454. doi: 10.2337/db08-0057. [DOI] [PubMed] [Google Scholar]
- 7.Dugan LL, You YH, Ali SS, Diamond-Stanic M, Miyamoto S, DeCleves AE, Andreyev A, Quach T, Ly S, Shekhtman G, Nguyen W, Chepetan A, Le TP, Wang L, Xu M, Paik KP, Fogo A, Viollet B, Murphy A, Brosius F, Naviaux RK, Sharma K. AMPK dysregulation promotes diabetes-related reduction of superoxide and mitochondrial function. J Clin Invest. 2013;123:4888–4899. doi: 10.1172/JCI66218. [DOI] [PMC free article] [PubMed] [Google Scholar]
- 8.Sharma K. Mitochondrial hormesis and diabetic complications. Diabetes. 2015;64:663–672. doi: 10.2337/db14-0874. [DOI] [PMC free article] [PubMed] [Google Scholar]
- 9.Shadel GS, Horvath TL. Mitochondrial ROS signaling in organismal homeostasis. Cell. 2015;163:560–569. doi: 10.1016/j.cell.2015.10.001. [DOI] [PMC free article] [PubMed] [Google Scholar]
- 10.Sies H. Hydrogen peroxide as a central redox signaling molecule in physiological oxidative stress: oxidative eustress. Redox Biol. 2017;11:613–619. doi: 10.1016/j.redox.2016.12.035. [DOI] [PMC free article] [PubMed] [Google Scholar]
- 11.Tu Y. Artemisinin-a gift from traditional chinese medicine to the world (Nobel lecture) Angew Chem Int Ed Engl. 2016;55:10210–10226. doi: 10.1002/anie.201601967. [DOI] [PubMed] [Google Scholar]
- 12.Li J, Casteels T, Frogne T, Ingvorsen C, Honore C, Courtney M, Huber KVM, Schmitner N, Kimmel RA, Romanov RA, Sturtzel C, Lardeau CH, Klughammer J, Farlik M, Sdelci S, Vieira A, Avolio F, Briand F, Baburin I, Majek P, Pauler FM, Penz T, Stukalov A, Gridling M, Parapatics K, Barbieux C, Berishvili E, Spittler A, Colinge J, Bennett KL, Hering S, Sulpice T, Bock C, Distel M, Harkany T, Meyer D, Superti-Furga G, Collombat P, Hecksher-Sorensen J, Kubicek S. Artemisinins target GABAA receptor signaling and impair alpha cell identity. Cell. 2017;168:86–100. e115. doi: 10.1016/j.cell.2016.11.010. [DOI] [PMC free article] [PubMed] [Google Scholar]
- 13.Guo Z. Artemisinin anti-malarial drugs in China. Acta Pharm Sin B. 2016;6:115–124. doi: 10.1016/j.apsb.2016.01.008. [DOI] [PMC free article] [PubMed] [Google Scholar]
- 14.Sun H, Wang W, Han P, Shao M, Song G, Du H, Yi T, Li S. Astragaloside IV ameliorates renal injury in db/db mice. Sci Rep. 2016;6:32545. doi: 10.1038/srep32545. [DOI] [PMC free article] [PubMed] [Google Scholar]
- 15.Han P, Zhan H, Shao M, Wang W, Song G, Yu X, Zhang C, Ge N, Yi T, Li S, Sun H. Niclosamide ethanolamine improves kidney injury in db/db mice. Diabetes Res Clin Pract. 2018;144:25–33. doi: 10.1016/j.diabres.2018.08.003. [DOI] [PubMed] [Google Scholar]
- 16.Rinschen MM, Godel M, Grahammer F, Zschiedrich S, Helmstadter M, Kretz O, Zarei M, Braun DA, Dittrich S, Pahmeyer C, Schroder P, Teetzen C, Gee H, Daouk G, Pohl M, Kuhn E, Schermer B, Kuttner V, Boerries M, Busch H, Schiffer M, Bergmann C, Kruger M, Hildebrandt F, Dengjel J, Benzing T, Huber TB. A multi-layered quantitative in vivo expression atlas of the podocyte unravels kidney disease candidate genes. Cell Rep. 2018;23:2495–2508. doi: 10.1016/j.celrep.2018.04.059. [DOI] [PMC free article] [PubMed] [Google Scholar]
- 17.Russo LM, Sandoval RM, Campos SB, Molitoris BA, Comper WD, Brown D. Impaired tubular uptake explains albuminuria in early diabetic nephropathy. J Am Soc Nephrol. 2009;20:489–494. doi: 10.1681/ASN.2008050503. [DOI] [PMC free article] [PubMed] [Google Scholar]
- 18.Takiyama Y, Sera T, Nakamura M, Ishizeki K, Saijo Y, Yanagimachi T, Maeda M, Bessho R, Takiyama T, Kitsunai H, Sakagami H, Fujishiro D, Fujita Y, Makino Y, Abiko A, Hoshino M, Uesugi K, Yagi N, Ota T, Haneda M. Impacts of diabetes and an SGLT2 inhibitor on the glomerular number and volume in db/db mice, as estimated by synchrotron radiation Micro-CT at SPring-8. EBioMedicine. 2018;36:329–346. doi: 10.1016/j.ebiom.2018.09.048. [DOI] [PMC free article] [PubMed] [Google Scholar]
- 19.Wang P, Fiaschi-Taesch NM, Vasavada RC, Scott DK, Garcia-Ocana A, Stewart AF. Diabetes mellitus--advances and challenges in human beta-cell proliferation. Nat Rev Endocrinol. 2015;11:201–212. doi: 10.1038/nrendo.2015.9. [DOI] [PubMed] [Google Scholar]
- 20.Feng AL, Xiang YY, Gui L, Kaltsidis G, Feng Q, Lu WY. Paracrine GABA and insulin regulate pancreatic alpha cell proliferation in a mouse model of type 1 diabetes. Diabetologia. 2017;60:1033–1042. doi: 10.1007/s00125-017-4239-x. [DOI] [PubMed] [Google Scholar]
- 21.Rorsman P, Huising MO. The somatostatin-secreting pancreatic delta-cell in health and disease. Nat Rev Endocrinol. 2018;14:404–414. doi: 10.1038/s41574-018-0020-6. [DOI] [PMC free article] [PubMed] [Google Scholar]
- 22.Zhang G, Darshi M, Sharma K. The warburg effect in diabetic kidney disease. Semin Nephrol. 2018;38:111–120. doi: 10.1016/j.semnephrol.2018.01.002. [DOI] [PMC free article] [PubMed] [Google Scholar]
- 23.Klyuyeva A, Tuganova A, Kedishvili N, Popov KM. Tissue-specific kinase expression and activity regulate flux through the pyruvate dehydrogenase complex. J Biol Chem. 2019;294:838–851. doi: 10.1074/jbc.RA118.006433. [DOI] [PMC free article] [PubMed] [Google Scholar]


