Abstract
Background
Cartilage repair outcomes of matrix-associated stem cell implants (MASIs) in patients have been highly variable. Conventional MRI cannot help distinguish between grafts that will and grafts that will not repair the underlying cartilage defect until many months after the repair.
Purpose
To determine if ferumoxytol nanoparticle labeling could be used to depict successful or failed MASIs compared with conventional MRI in a large-animal model.
Materials and Methods
Between January 2016 and December 2017, 10 Göttingen minipigs (n = 5 male; n = 5 female; mean age, 6 months ± 5.1; age range, 4–20 months) received implants of unlabeled (n = 12) or ferumoxytol-labeled (n = 20) viable and apoptotic MASIs in cartilage defects of the distal femur. All MASIs were serially imaged with MRI on a 3.0-T imaging unit at week 1 and weeks 2, 4, 8, 12, and 24, with calculation of T2 relaxation times. Cartilage regeneration outcomes were assessed by using the MR observation of cartilage repair tissue (MOCART) score (scale, 0–100), the Pineda score, and histopathologic quantification of collagen 2 production in the cartilage defect. Findings were compared by using the unpaired Wilcoxon rank sum test, a linear regression model, the Fisher exact test, and Pearson correlation.
Results
Ferumoxytol-labeled MASIs showed significant T2 shortening (22.2 msec ± 3.2 vs 27.9 msec ± 1.8; P < .001) and no difference in cartilage repair outcomes compared with unlabeled control MASIs (P > .05). At week 2 after implantation, ferumoxytol-labeled apoptotic MASIs showed a loss of iron signal and higher T2 relaxation times compared with ferumoxytol-labeled viable MASIs (26.6 msec ± 4.9 vs 20.8 msec ± 5.3; P = .001). Standard MRI showed incomplete cartilage defect repair of apoptotic MASIs at 24 weeks. Iron signal loss at 2 weeks correlated with incomplete cartilage repair, diagnosed at histopathologic examination at 12–24 weeks.
Conclusion
Ferumoxytol nanoparticle labeling can accelerate the diagnosis of successful and failed matrix-associated stem cell implants at MRI in a large-animal model.
© RSNA, 2019
Online supplemental material is available for this article.
See also the editorial by Sneag and Potter in this issue.
Summary
Ferumoxytol-labeled matrix-associated stem cell implants can predict cartilage repair outcomes with MRI in a large-animal model.
Key Points
■ At week 2 after implantation into cartilage defects, matrix-associated stem cell implants (MASIs) labeled with ferumoxytol showed higher T2 relaxation times at MRI (indicating a loss of iron signal) when they were apoptotic versus when they were viable (27 msec ± 5 vs 21 msec ± 5; P = .001).
■ Standard MRI showed incomplete cartilage repair of apoptotic MASIs only after 24 weeks.
Introduction
Cartilage defects due to trauma, degenerative arthritis, or inflammatory arthritis affect approximately one out of five adults and represent a major cause of pain and disability (1–3). Because cartilage defects do not heal spontaneously, interventions are needed to induce repair. Bone marrow–derived autologous mesenchymal stromal cells (MSCs) can differentiate into chondrocytes and have been implanted into cartilage defects to restore joint health (4). However, cartilage repair outcomes of matrix-associated stem cell implants (MASIs) in patients have been highly variable: While some investigators reported full-thickness hyaline cartilage regeneration (5,6), others reported a failure rate of up to 50% for MASIs (7,8). Limited cell transplant survival was identified as the most important obstacle for successful cartilage repair (9). An imaging test that could help predict MASI outcomes would greatly enhance our ability to develop more successful cell transplant procedures.
MRI is the primary modality for cartilage imaging (10,11). However, MRI within the 1st few weeks after MASI cannot help distinguish between grafts that will and grafts that will not repair the underlying cartilage defect (9). To date, successful cartilage repair is diagnosed many months after MASI, on the basis of a reduction in cartilage defect size at morphologic MRI (10,11). Unfortunately, failed cartilage repair and scar formation are difficult to correct at that time. Timely detection of an impending graft failure could enable rescue interventions with growth factors, immune suppression, or repeated cell transplants (12,13).
Therapeutic cells can be labeled with iron oxide nanoparticles and tracked in vivo with MRI (14,15). In rodents, apoptotic nanoparticle-labeled MSCs showed rapidly declining MRI signal owing to macrophage clearance, while viable nanoparticle-labeled MSCs metabolized the iron label more slowly and showed longer persistence of the iron signal at MRI (16). However, MASI tracking techniques have not yet reached clinical use because it is unclear whether the iron label is safe and would affect cartilage regeneration outcomes (17–19). In addition, it is not clear whether previous imaging findings of MASIs in rodent joints would translate to MASIs in joints of clinically relevant size and whether ferumoxytol nanoparticle labeling would impair cartilage assessment with the MR observation of cartilage repair tissue (MOCART) score.
We hypothesized that cartilage regeneration outcomes of labeled and unlabeled MASIs would not be significantly different. In addition, we hypothesized that the degree of nanoparticle signal decrease at MRI 1–2 weeks after the MASI procedure would correlate with abnormal MOCART scores and incomplete cartilage defect repair outcomes 12–24 weeks later. The aim of our study was to determine if ferumoxytol nanoparticle labeling could accelerate the MRI diagnosis of successful or failed MASI compared with MOCART scores at conventional MRI in a large-animal model.
Materials and Methods
Animals
Our prospective animal study was approved by the institutional animal care and use committee and was performed in close collaboration with our veterinary care team. MSCs were harvested from the bone marrow of Göttingen minipigs (Marshall Farms, North Rose, NY) (Appendix E1, Figs E1a and E1b [online]), and MASIs were implanted into 40 cartilage defects of 20 knee (stifle) joints of 10 immune-competent Göttingen minipigs. Equal numbers of male and female pigs were used in this study (n = 5 male, n = 5 female; mean age, 6 months ± 5.1; age range, 4–20 months). All pigs underwent the same care, and their ambulation or feeding was not limited before or after the surgery. An overview of the in vivo experiments is shown in Figure 1. Initial pilot studies were performed with six MASIs with different stem cell–to-scaffold compositions. Two MASIs dislocated and were excluded from the analysis. We selected a combination of MSC construct and fibrin scaffold to achieve long-lasting deposition of the MSC transplant. For the main arm of the experiment, 20 MASIs were labeled with ferumoxytol (Feraheme; AMAG Pharmaceuticals, Waltham, Mass) (Fig E1c [online]), and 12 MASIs served as unlabeled controls (see power calculations in the Statistical Analysis section). All MASIs were assigned to implantations into artificially created 5-mm cartilage defects of the distal femur. In each group (unlabeled and labeled MASIs), 50% of the MASIs were untreated (viable) and 50% were pretreated with mitomycin (apoptotic), a classic apoptosis inducer that leads to unfavorable cartilage repair outcomes.
Figure 1:
Flow diagram overview of in vivo investigations of 40 matrix-associated stem cell implants (MASIs) in 20 knee joints of 10 Göttingen minipigs. Pilot studies for scaffold and labeling optimization were performed in two minipigs. Two MASIs dislocated. For the main arm of the study, 20 ferumoxytol-labeled MASIs and 12 unlabeled MASIs were assessed.
In Vitro Validation Studies
In vitro validation studies are detailed in Appendix E1 (online).
In Vivo Studies
MASI implantation into pig knee joints.—After a 12-hour preoperative fast, animals were sedated with tiletamine and zolazepam (Telazol; Zoetis, Kalamazoo, Mich; 2–8 mg intramuscularly per kilogram of body weight), intubated endotracheally and anesthetized with isoflurane (Fluriso, Vetone, MWI, Boise, Idaho; 1%–3% in oxygen/1–2 L/min). After surgical disinfection of the knee, a medial patellar skin incision was made, and the knee joint was exposed by means of lateral dislocation of the patella. Two full-thickness cartilage defects (5 mm in diameter) were created in the medial aspect of the femoral intercondylar groove with a curette (FST, Foster City, Calif) (Fig E1d, E1e [online]). To generate a set of therapeutic cells that would lead to poor engraftment outcomes, we treated 20 samples of MSC with 0.06 mg mitomycin C per milliliter medium for apoptosis induction by means of the p53-mediated pathway (20,21).
Unlabeled viable MASIs (n = 6) and apoptotic MASIs (n = 6) and ferumoxytol-labeled viable MASIs (n = 10) and apoptotic MASIs (n = 10) were implanted into cartilage defects of the distal femur. Cells were secured with fibrin glue (Evicel; Ethicon, Somerville, NJ). The patella was then repositioned, and the stifle joint capsule, associated muscle layers, and skin were closed with absorbable and nonabsorbable sutures.
Animals had no restrictions regarding their locomotion before or after the surgery. We evaluated the joint function in our animals before and at 1 week and 2, 4, 8, 12, and 24 weeks after the MASI procedure by using the Feet First Swine Locomotion Scoring system, which evaluates signs of lameness based on observations of the pigs’ weight-bearing and walking patterns (22).
In vivo MRI.—Figure 2 summarizes the MRI signal effects of ferumoxytol-labeled viable and apoptotic therapeutic cells and cartilage repair outcomes. All pigs underwent MRI of both knee joints at 1 week and 2, 4, 8, and 12 weeks after the MASI procedure. MRI was performed by using a clinical 3.0-T MRI unit (Signa HDxt; GE Healthcare, Milwaukee, Wis) and a one-channel receive-only loop coil (GE Healthcare) (Fig E1f [online]). Four pigs were followed for up to 24 weeks. MRI included a proton density–weighted fast spin-echo sequence with fat saturation (repetition time msec/echo time msec, 3700/34; flip angle, 90°; matrix size, 192 × 192; section thickness, 1.3 mm; field of view, 8 cm; acquisition time, 16 minutes), a multiecho spin-echo sequence (3500/15, 30, 45, 60; flip angle, 90°; matrix, 192 × 192; section thickness, 1.3 mm; field of view, 8 cm; acquisition time, 13 minutes), and a three-dimensional spoiled gradient-echo fat-saturated sequence (50/7; flip angle, 30°; matrix, 192 × 192; section thickness, 1.2 mm; field of view, 8 cm; acquisition time, 12 minutes).
Figure 2:
Schematic overview of MRI signal effects of ferumoxytol-labeled mesenchymal stromal cells (MSCs) and cartilage repair outcomes. A, MSCs are labeled with ferumoxytol nanoparticles, causing hypointense signal at T2-weighted MRI. B, Ferumoxytol-labeled viable and apoptotic MSCs are implanted into full-thickness cartilage defects. C, Cartilage defects with apoptotic implants lose the iron signal earlier than viable implants, presumably because of macrophage clearance. D, MSC implants that show persistent iron signal at 2 weeks are expected to show successful cartilage repair. MSC implants that lose their iron signal at 2 weeks are expected to show unsuccessful cartilage repair.
To analyze the MRI data, we generated T2 relaxation time maps using custom software (Cinetool; GE Healthcare Technologies, Baltimore, Md) and measured T2 relaxation times in each implant in operator-defined regions of interest (19). T2 values were measured by one 4th year radiology resident (A.J.T.). MOCART scores were determined by a radiologist (H.E.D.) and a radiology resident (A.J.T.) in consensus.
We evaluated each cartilage defect on 4-, 12-, and 24-week MRI studies. The MOCART score is a nine-variable and 29-item scoring system with a final cartilage repair tissue score between 0 and 100 points, with 0 representing the worst score and 100 representing the best score (23,24), The nine variables include defect fill, cartilage interface, surface, adhesions, structure, signal intensity, subchondral lamina, subchondral bone, and effusion.
Histopathologic Analysis
Animals were sacrificed at 12 weeks (n = 6) or at 24 weeks (n = 4) after MSC implantation. Cartilage regeneration outcomes were assessed in consensus by one senior research scientist with 10 years of experience (H.N.) and one radiology resident (A.J.T.) using the Pineda score (a histologic scoring system from 0 = best to 14 = worst, based on scores for the following four factors: percentage filling of the defect, reconstruction of the osteochondral junction, matrix staining, and cell morphology) and histopathologic quantification of collagen 2 production in the cartilage defect. Results of histopathologic analysis are detailed in Appendix E1 (online).
Statistical Analysis
Data were analyzed by using R, version 3.4.4 (www.r-project.org) and Stata, release 15.1 (Stata, College Station, Tex). For comparisons of quantitative in vitro data between ferumoxytol-labeled and unlabeled MSCs, an unpaired Wilcoxon rank-sum test was performed. Quantitative measurements from in vivo T2 relaxation times, MOCART scores, Pineda scores, and results of immunohistochemical image analysis were compared for significant differences between labeled and unlabeled MASIs by using an unpaired Wilcoxon rank-sum test, adjusting for clustering within each pig. Differences between locomotion scores of pigs with labeled and those with unlabeled MASIs were analyzed with the Fisher exact test.
Within-animal comparison of ferumoxytol-labeled viable and apoptotic MASIs in terms of T2 relaxation times and MRI scores at different time points was performed by using longitudinal linear regression models adjusted for within-animal clustering. We correlated the MRI data of viable and apoptotic MASIs at 2 weeks with respective outcomes at 12 and 24 weeks using the Pearson correlation coefficient. If research results were described as “no difference,” a two-sided test result was reported; if research results were described as “better” or “greater,” then a one-sided test result was reported. A significance level of P < .05 was used. Because there were 16 tests performed in the in vivo studies, the Hommel correction procedure (25) for multiple testing was used. Unadjusted P values are reported; in only two cases was their significance level affected by adjustment, as noted in the text.
For power calculation, we used data from previous studies in rodents and preliminary pilot studies in pigs to generate an estimate of the sample sizes needed for the main arm of the study. For the comparison of ferumoxytol-labeled and unlabeled MASIs with a Wilcoxon rank-sum test, a power analysis assuming an effect size of 2 standard deviations and an intraclass correlation of 0.50 indicated that sample sizes of 10 viable labeled and five viable unlabeled MASIs would provide 80% power at 5% error to detect such an effect between experimental groups. For the cluster-adjusted linear regression analysis of MRI data of labeled and unlabeled MASIs, a power analysis assuming a partial correlation of 0.70 and intraclass correlation of 0.70 indicated that sample sizes of 10 viable labeled and 10 apoptotic labeled MASIs would provide 80% power at 5% error to detect the effect.
Results
Ferumoxytol Labeling of MSCs Does Not Impair Cartilage Regeneration in Joints of Clinically Relevant Size
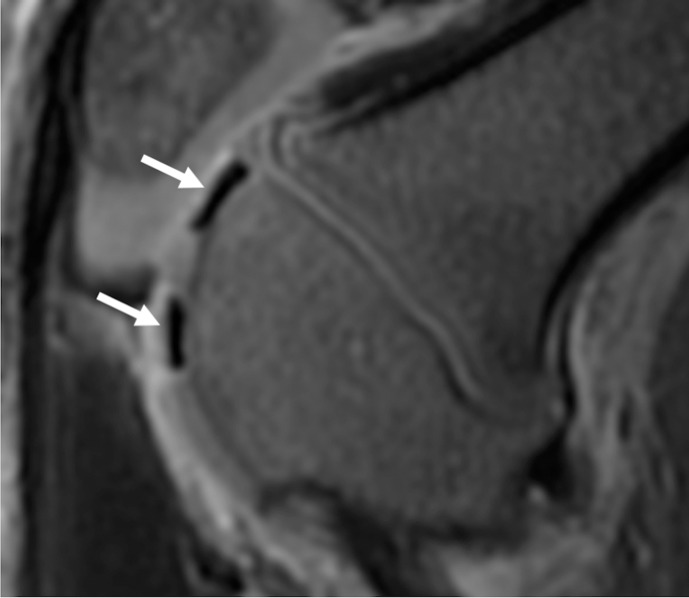
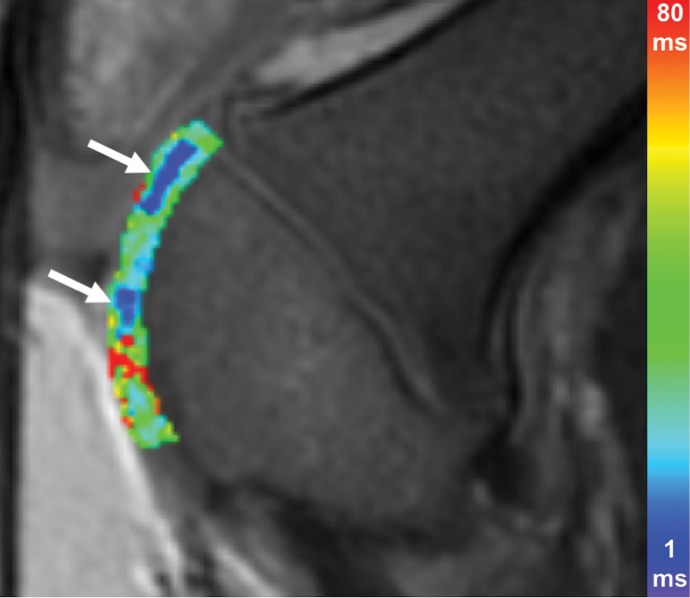
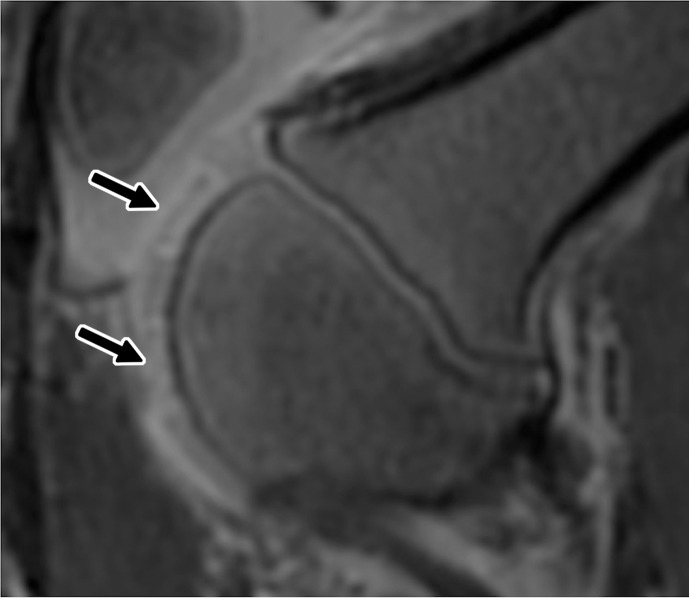
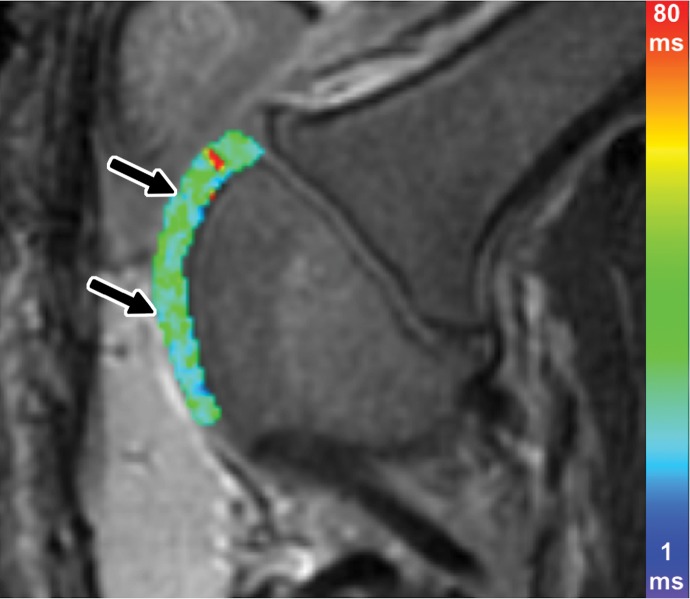
To evaluate whether ferumoxytol labeling of MASIs impairs cartilage engraftment outcomes, we implanted ferumoxytol-labeled and unlabeled viable MSCs into cartilage defects of pig knee joints. We found different MRI signal effects of ferumoxytol-labeled compared with unlabeled cell implants: At week 1, ferumoxytol-labeled MASIs showed marked hypointense (dark) signal effects on proton density–weighted and T2-weighted images, while unlabeled MASIs showed isointense-to-hyperintense signal compared with adjacent cartilage (Fig 3a–3f). Labeled and unlabeled MASIs had significantly different T2 relaxation times at week 1 (22.2 msec ± 3.2 vs 27.9 msec ± 1.8; P < .001). The iron label in labeled MASIs was slowly metabolized and disappeared over time. The cartilage MRI signal and T2 relaxation times did not differ between ferumoxytol-labeled MASIs and unlabeled controls at 4 weeks (26.1 msec ± 4.0 vs 27.0 msec ± 0.3; P = .34), 12 weeks (26.2 msec ± 4.4 vs 28.9 msec ± 4.5; P = .34), and 24 weeks (24.0 msec ± 3.3 vs 23.7 msec ± 0.9; P = .52).
Figure 3a:
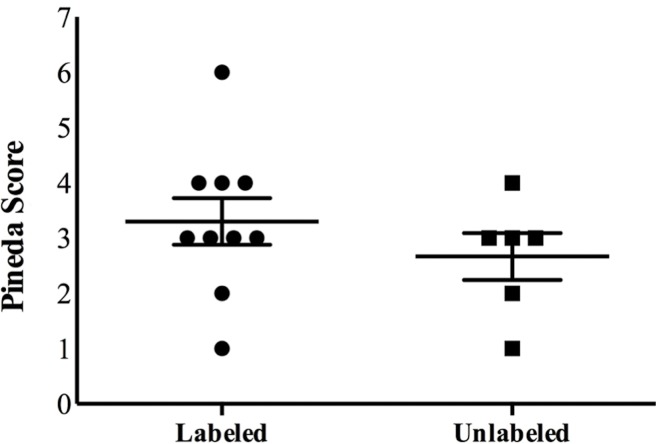
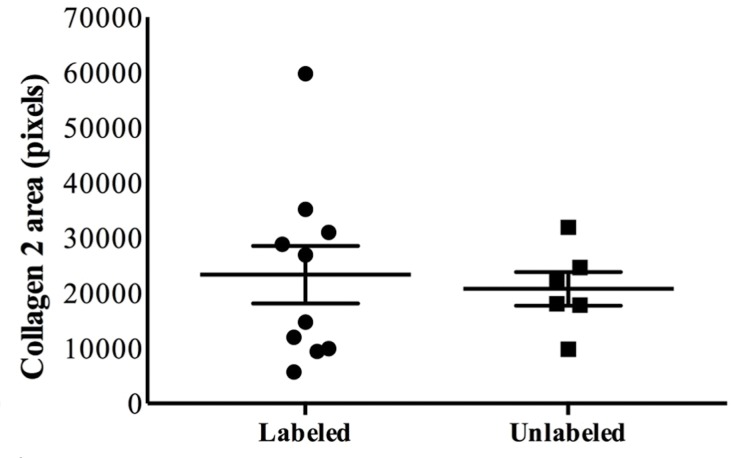
Ferumoxytol-labeled and unlabeled matrix-associated stem cell implants (MASIs) in a Göttingen minipig. (a) Sagittal image from proton density–weighted MRI (repetition time msec/echo time msec, 3700/30) of the distal femur with ferumoxytol-labeled MASIs in cartilage defects (arrows) shows hypointense signal in the MASIs compared with the adjacent healthy cartilage. (b) Corresponding color-encoded T2 map overlaid on a sagittal T2-weighted spin-echo image (3500/60) shows shortened T2 relaxation times of ferumoxytol-labeled MASIs (arrows) compared with the adjacent cartilage. (c) Corresponding photograph of macroscopic specimen of the same knee joint at 12 weeks after surgical implantation shows partial cartilage regeneration of the defects (circles). (d) Sagittal image from proton density–weighted MRI (3700/30) of the distal femur with unlabeled MASIs (arrows) shows iso- to hyperintense signal compared with the adjacent healthy cartilage. (e) Corresponding color-encoded T2 map overlaid on a sagittal T2-weighted spin-echo image (3500/60) shows similar T2 relaxation times of unlabeled MASIs (arrows) compared with the adjacent cartilage. (f) Corresponding photograph of macroscopic specimen at 12 weeks after surgical implantation shows no difference in cartilage regeneration outcomes (circles), indicating no negative effects of the iron label on the MASIs. (g) Scatterplot of results of histopathologic analysis of joint specimen at 12 weeks after implantation of ferumoxytol-labeled and unlabeled MASI, as assessed with the Pineda score (a cartilage histologic scoring system based on four factors of filling defect, reconstruction of the osteochondral junction, matrix staining, and cell morphology) (P = .35, indicating no difference in cartilage defect repair outcomes between labeled and unlabeled MASIs). (h) Scatterplot of results of collagen type 2 staining, measured as positively stained pixels in the histopathologic specimen (P = .79, showing no difference in cartilage defect repair outcomes between labeled and unlabeled MASIs). Data are means and standard errors of the mean for labeled and unlabeled MASIs.
Figure 3f:
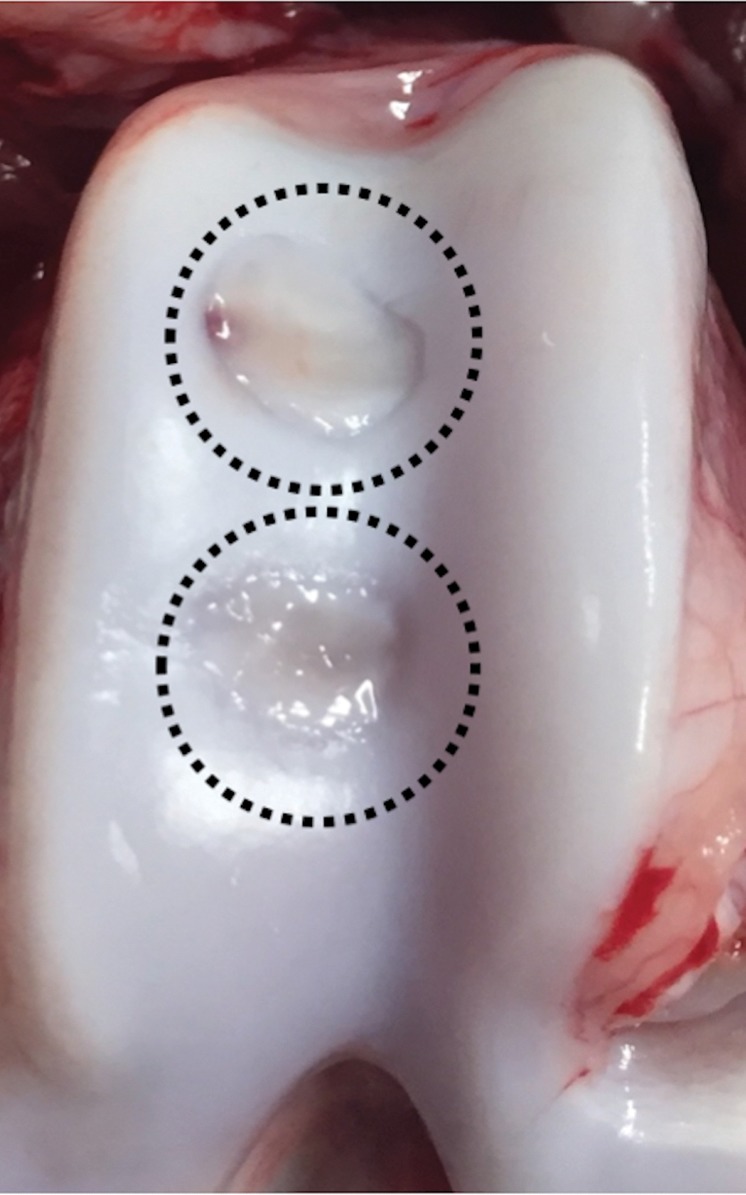
Ferumoxytol-labeled and unlabeled matrix-associated stem cell implants (MASIs) in a Göttingen minipig. (a) Sagittal image from proton density–weighted MRI (repetition time msec/echo time msec, 3700/30) of the distal femur with ferumoxytol-labeled MASIs in cartilage defects (arrows) shows hypointense signal in the MASIs compared with the adjacent healthy cartilage. (b) Corresponding color-encoded T2 map overlaid on a sagittal T2-weighted spin-echo image (3500/60) shows shortened T2 relaxation times of ferumoxytol-labeled MASIs (arrows) compared with the adjacent cartilage. (c) Corresponding photograph of macroscopic specimen of the same knee joint at 12 weeks after surgical implantation shows partial cartilage regeneration of the defects (circles). (d) Sagittal image from proton density–weighted MRI (3700/30) of the distal femur with unlabeled MASIs (arrows) shows iso- to hyperintense signal compared with the adjacent healthy cartilage. (e) Corresponding color-encoded T2 map overlaid on a sagittal T2-weighted spin-echo image (3500/60) shows similar T2 relaxation times of unlabeled MASIs (arrows) compared with the adjacent cartilage. (f) Corresponding photograph of macroscopic specimen at 12 weeks after surgical implantation shows no difference in cartilage regeneration outcomes (circles), indicating no negative effects of the iron label on the MASIs. (g) Scatterplot of results of histopathologic analysis of joint specimen at 12 weeks after implantation of ferumoxytol-labeled and unlabeled MASI, as assessed with the Pineda score (a cartilage histologic scoring system based on four factors of filling defect, reconstruction of the osteochondral junction, matrix staining, and cell morphology) (P = .35, indicating no difference in cartilage defect repair outcomes between labeled and unlabeled MASIs). (h) Scatterplot of results of collagen type 2 staining, measured as positively stained pixels in the histopathologic specimen (P = .79, showing no difference in cartilage defect repair outcomes between labeled and unlabeled MASIs). Data are means and standard errors of the mean for labeled and unlabeled MASIs.
Figure 3b:
Ferumoxytol-labeled and unlabeled matrix-associated stem cell implants (MASIs) in a Göttingen minipig. (a) Sagittal image from proton density–weighted MRI (repetition time msec/echo time msec, 3700/30) of the distal femur with ferumoxytol-labeled MASIs in cartilage defects (arrows) shows hypointense signal in the MASIs compared with the adjacent healthy cartilage. (b) Corresponding color-encoded T2 map overlaid on a sagittal T2-weighted spin-echo image (3500/60) shows shortened T2 relaxation times of ferumoxytol-labeled MASIs (arrows) compared with the adjacent cartilage. (c) Corresponding photograph of macroscopic specimen of the same knee joint at 12 weeks after surgical implantation shows partial cartilage regeneration of the defects (circles). (d) Sagittal image from proton density–weighted MRI (3700/30) of the distal femur with unlabeled MASIs (arrows) shows iso- to hyperintense signal compared with the adjacent healthy cartilage. (e) Corresponding color-encoded T2 map overlaid on a sagittal T2-weighted spin-echo image (3500/60) shows similar T2 relaxation times of unlabeled MASIs (arrows) compared with the adjacent cartilage. (f) Corresponding photograph of macroscopic specimen at 12 weeks after surgical implantation shows no difference in cartilage regeneration outcomes (circles), indicating no negative effects of the iron label on the MASIs. (g) Scatterplot of results of histopathologic analysis of joint specimen at 12 weeks after implantation of ferumoxytol-labeled and unlabeled MASI, as assessed with the Pineda score (a cartilage histologic scoring system based on four factors of filling defect, reconstruction of the osteochondral junction, matrix staining, and cell morphology) (P = .35, indicating no difference in cartilage defect repair outcomes between labeled and unlabeled MASIs). (h) Scatterplot of results of collagen type 2 staining, measured as positively stained pixels in the histopathologic specimen (P = .79, showing no difference in cartilage defect repair outcomes between labeled and unlabeled MASIs). Data are means and standard errors of the mean for labeled and unlabeled MASIs.
Figure 3c:
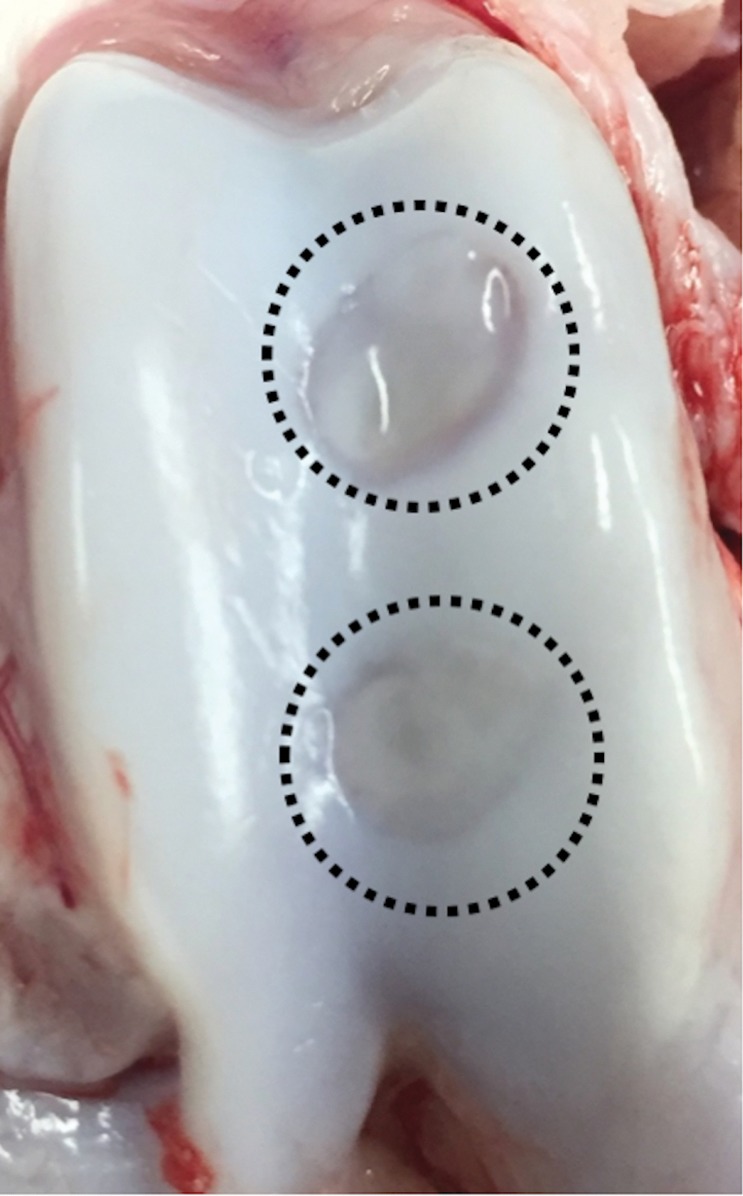
Ferumoxytol-labeled and unlabeled matrix-associated stem cell implants (MASIs) in a Göttingen minipig. (a) Sagittal image from proton density–weighted MRI (repetition time msec/echo time msec, 3700/30) of the distal femur with ferumoxytol-labeled MASIs in cartilage defects (arrows) shows hypointense signal in the MASIs compared with the adjacent healthy cartilage. (b) Corresponding color-encoded T2 map overlaid on a sagittal T2-weighted spin-echo image (3500/60) shows shortened T2 relaxation times of ferumoxytol-labeled MASIs (arrows) compared with the adjacent cartilage. (c) Corresponding photograph of macroscopic specimen of the same knee joint at 12 weeks after surgical implantation shows partial cartilage regeneration of the defects (circles). (d) Sagittal image from proton density–weighted MRI (3700/30) of the distal femur with unlabeled MASIs (arrows) shows iso- to hyperintense signal compared with the adjacent healthy cartilage. (e) Corresponding color-encoded T2 map overlaid on a sagittal T2-weighted spin-echo image (3500/60) shows similar T2 relaxation times of unlabeled MASIs (arrows) compared with the adjacent cartilage. (f) Corresponding photograph of macroscopic specimen at 12 weeks after surgical implantation shows no difference in cartilage regeneration outcomes (circles), indicating no negative effects of the iron label on the MASIs. (g) Scatterplot of results of histopathologic analysis of joint specimen at 12 weeks after implantation of ferumoxytol-labeled and unlabeled MASI, as assessed with the Pineda score (a cartilage histologic scoring system based on four factors of filling defect, reconstruction of the osteochondral junction, matrix staining, and cell morphology) (P = .35, indicating no difference in cartilage defect repair outcomes between labeled and unlabeled MASIs). (h) Scatterplot of results of collagen type 2 staining, measured as positively stained pixels in the histopathologic specimen (P = .79, showing no difference in cartilage defect repair outcomes between labeled and unlabeled MASIs). Data are means and standard errors of the mean for labeled and unlabeled MASIs.
Figure 3d:
Ferumoxytol-labeled and unlabeled matrix-associated stem cell implants (MASIs) in a Göttingen minipig. (a) Sagittal image from proton density–weighted MRI (repetition time msec/echo time msec, 3700/30) of the distal femur with ferumoxytol-labeled MASIs in cartilage defects (arrows) shows hypointense signal in the MASIs compared with the adjacent healthy cartilage. (b) Corresponding color-encoded T2 map overlaid on a sagittal T2-weighted spin-echo image (3500/60) shows shortened T2 relaxation times of ferumoxytol-labeled MASIs (arrows) compared with the adjacent cartilage. (c) Corresponding photograph of macroscopic specimen of the same knee joint at 12 weeks after surgical implantation shows partial cartilage regeneration of the defects (circles). (d) Sagittal image from proton density–weighted MRI (3700/30) of the distal femur with unlabeled MASIs (arrows) shows iso- to hyperintense signal compared with the adjacent healthy cartilage. (e) Corresponding color-encoded T2 map overlaid on a sagittal T2-weighted spin-echo image (3500/60) shows similar T2 relaxation times of unlabeled MASIs (arrows) compared with the adjacent cartilage. (f) Corresponding photograph of macroscopic specimen at 12 weeks after surgical implantation shows no difference in cartilage regeneration outcomes (circles), indicating no negative effects of the iron label on the MASIs. (g) Scatterplot of results of histopathologic analysis of joint specimen at 12 weeks after implantation of ferumoxytol-labeled and unlabeled MASI, as assessed with the Pineda score (a cartilage histologic scoring system based on four factors of filling defect, reconstruction of the osteochondral junction, matrix staining, and cell morphology) (P = .35, indicating no difference in cartilage defect repair outcomes between labeled and unlabeled MASIs). (h) Scatterplot of results of collagen type 2 staining, measured as positively stained pixels in the histopathologic specimen (P = .79, showing no difference in cartilage defect repair outcomes between labeled and unlabeled MASIs). Data are means and standard errors of the mean for labeled and unlabeled MASIs.
Figure 3e:
Ferumoxytol-labeled and unlabeled matrix-associated stem cell implants (MASIs) in a Göttingen minipig. (a) Sagittal image from proton density–weighted MRI (repetition time msec/echo time msec, 3700/30) of the distal femur with ferumoxytol-labeled MASIs in cartilage defects (arrows) shows hypointense signal in the MASIs compared with the adjacent healthy cartilage. (b) Corresponding color-encoded T2 map overlaid on a sagittal T2-weighted spin-echo image (3500/60) shows shortened T2 relaxation times of ferumoxytol-labeled MASIs (arrows) compared with the adjacent cartilage. (c) Corresponding photograph of macroscopic specimen of the same knee joint at 12 weeks after surgical implantation shows partial cartilage regeneration of the defects (circles). (d) Sagittal image from proton density–weighted MRI (3700/30) of the distal femur with unlabeled MASIs (arrows) shows iso- to hyperintense signal compared with the adjacent healthy cartilage. (e) Corresponding color-encoded T2 map overlaid on a sagittal T2-weighted spin-echo image (3500/60) shows similar T2 relaxation times of unlabeled MASIs (arrows) compared with the adjacent cartilage. (f) Corresponding photograph of macroscopic specimen at 12 weeks after surgical implantation shows no difference in cartilage regeneration outcomes (circles), indicating no negative effects of the iron label on the MASIs. (g) Scatterplot of results of histopathologic analysis of joint specimen at 12 weeks after implantation of ferumoxytol-labeled and unlabeled MASI, as assessed with the Pineda score (a cartilage histologic scoring system based on four factors of filling defect, reconstruction of the osteochondral junction, matrix staining, and cell morphology) (P = .35, indicating no difference in cartilage defect repair outcomes between labeled and unlabeled MASIs). (h) Scatterplot of results of collagen type 2 staining, measured as positively stained pixels in the histopathologic specimen (P = .79, showing no difference in cartilage defect repair outcomes between labeled and unlabeled MASIs). Data are means and standard errors of the mean for labeled and unlabeled MASIs.
Because the iron signal had disappeared by week 4, it did not interfere with assessments of the MOCART score, which is typically used for cartilage repair assessments in a clinical setting. At 4 weeks (P = .51) and 12 weeks (P = .27), unlabeled and labeled MASIs showed no differences in MOCART score (Table).
Animals with labeled MASIs and those with unlabeled MASIs showed no impairment (P > .99) in joint function at 1 week and 2, 4, 8, 12, and 24 weeks compared with a baseline examination before surgery (Table E1 [online]).
At histopathologic analysis (Fig 3g, 3h), unlabeled and labeled MASIs showed no difference in cartilage defect repair outcomes, as measured by the Pineda score (Fig 3g, P = .35) and collagen type 2 production (Fig 3h, P = .79). Taken together, these data suggest that ferumoxytol labeling of MASIs does not impair cartilage repair outcomes.
Figure 3g:
Ferumoxytol-labeled and unlabeled matrix-associated stem cell implants (MASIs) in a Göttingen minipig. (a) Sagittal image from proton density–weighted MRI (repetition time msec/echo time msec, 3700/30) of the distal femur with ferumoxytol-labeled MASIs in cartilage defects (arrows) shows hypointense signal in the MASIs compared with the adjacent healthy cartilage. (b) Corresponding color-encoded T2 map overlaid on a sagittal T2-weighted spin-echo image (3500/60) shows shortened T2 relaxation times of ferumoxytol-labeled MASIs (arrows) compared with the adjacent cartilage. (c) Corresponding photograph of macroscopic specimen of the same knee joint at 12 weeks after surgical implantation shows partial cartilage regeneration of the defects (circles). (d) Sagittal image from proton density–weighted MRI (3700/30) of the distal femur with unlabeled MASIs (arrows) shows iso- to hyperintense signal compared with the adjacent healthy cartilage. (e) Corresponding color-encoded T2 map overlaid on a sagittal T2-weighted spin-echo image (3500/60) shows similar T2 relaxation times of unlabeled MASIs (arrows) compared with the adjacent cartilage. (f) Corresponding photograph of macroscopic specimen at 12 weeks after surgical implantation shows no difference in cartilage regeneration outcomes (circles), indicating no negative effects of the iron label on the MASIs. (g) Scatterplot of results of histopathologic analysis of joint specimen at 12 weeks after implantation of ferumoxytol-labeled and unlabeled MASI, as assessed with the Pineda score (a cartilage histologic scoring system based on four factors of filling defect, reconstruction of the osteochondral junction, matrix staining, and cell morphology) (P = .35, indicating no difference in cartilage defect repair outcomes between labeled and unlabeled MASIs). (h) Scatterplot of results of collagen type 2 staining, measured as positively stained pixels in the histopathologic specimen (P = .79, showing no difference in cartilage defect repair outcomes between labeled and unlabeled MASIs). Data are means and standard errors of the mean for labeled and unlabeled MASIs.
Figure 3h:
Ferumoxytol-labeled and unlabeled matrix-associated stem cell implants (MASIs) in a Göttingen minipig. (a) Sagittal image from proton density–weighted MRI (repetition time msec/echo time msec, 3700/30) of the distal femur with ferumoxytol-labeled MASIs in cartilage defects (arrows) shows hypointense signal in the MASIs compared with the adjacent healthy cartilage. (b) Corresponding color-encoded T2 map overlaid on a sagittal T2-weighted spin-echo image (3500/60) shows shortened T2 relaxation times of ferumoxytol-labeled MASIs (arrows) compared with the adjacent cartilage. (c) Corresponding photograph of macroscopic specimen of the same knee joint at 12 weeks after surgical implantation shows partial cartilage regeneration of the defects (circles). (d) Sagittal image from proton density–weighted MRI (3700/30) of the distal femur with unlabeled MASIs (arrows) shows iso- to hyperintense signal compared with the adjacent healthy cartilage. (e) Corresponding color-encoded T2 map overlaid on a sagittal T2-weighted spin-echo image (3500/60) shows similar T2 relaxation times of unlabeled MASIs (arrows) compared with the adjacent cartilage. (f) Corresponding photograph of macroscopic specimen at 12 weeks after surgical implantation shows no difference in cartilage regeneration outcomes (circles), indicating no negative effects of the iron label on the MASIs. (g) Scatterplot of results of histopathologic analysis of joint specimen at 12 weeks after implantation of ferumoxytol-labeled and unlabeled MASI, as assessed with the Pineda score (a cartilage histologic scoring system based on four factors of filling defect, reconstruction of the osteochondral junction, matrix staining, and cell morphology) (P = .35, indicating no difference in cartilage defect repair outcomes between labeled and unlabeled MASIs). (h) Scatterplot of results of collagen type 2 staining, measured as positively stained pixels in the histopathologic specimen (P = .79, showing no difference in cartilage defect repair outcomes between labeled and unlabeled MASIs). Data are means and standard errors of the mean for labeled and unlabeled MASIs.
Rapid Loss of Ferumoxytol MASI Signal at MRI Predicts Unfavorable Clinical Outcome
Ferumoxytol labeling of MASI provided additional information at MRI that was not attainable with standard MRI.
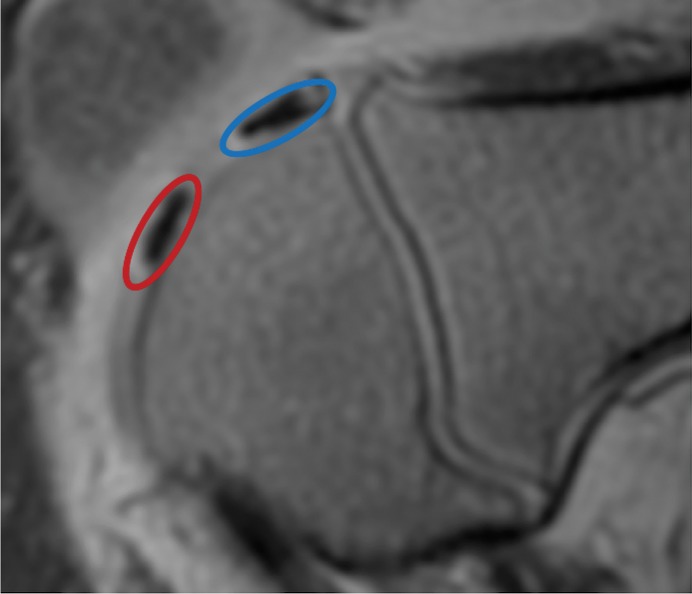
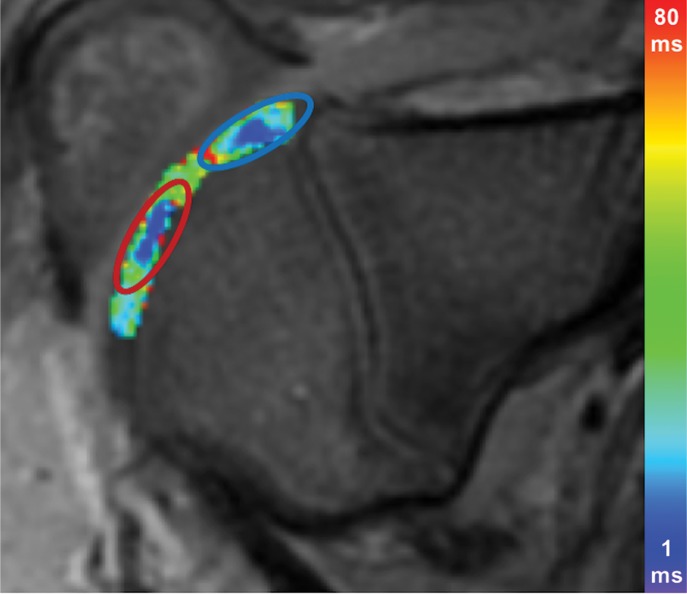
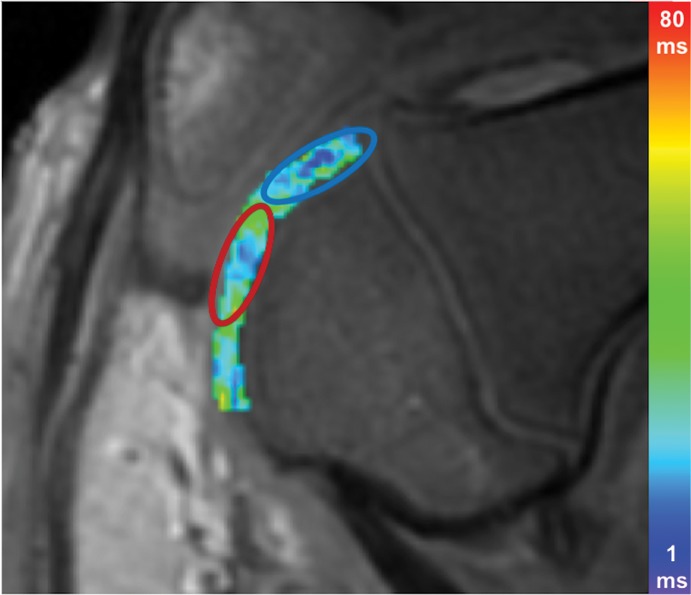
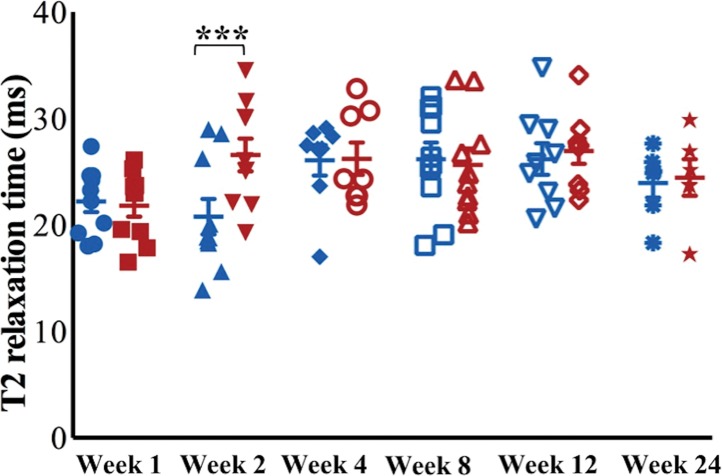
At week 1, ferumoxytol-labeled viable and apoptotic MASIs showed similar hypointense signal at T2-weighted MRI (T2 relaxation times, 22.2 msec ± 3.2 vs 21.8 msec ± 3.3; P = .65 [Fig 4a, 4b]). At week 2, viable MASIs showed persistent iron signal, while apoptotic MASIs showed loss of iron signal (Fig 4d, 4e), as quantified by shorter T2 relaxation times of viable ferumoxytol-labeled implants (20.8 msec ± 5.3) compared with apoptotic ferumoxytol-labeled implants (26.6 msec ± 4.9; P = .001; Fig 4g).
Figure 4a:
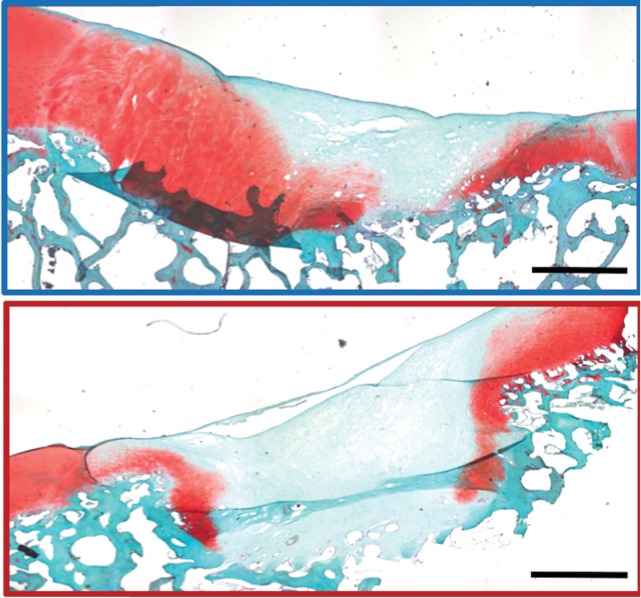
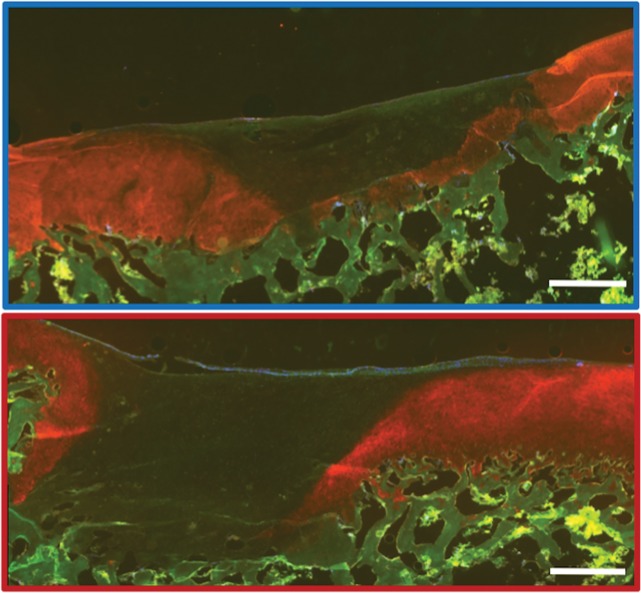
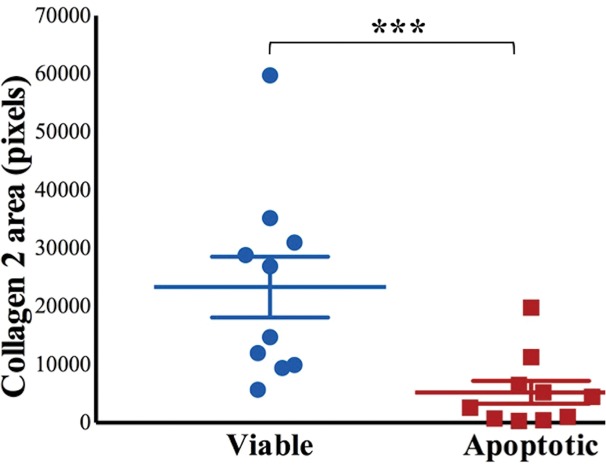
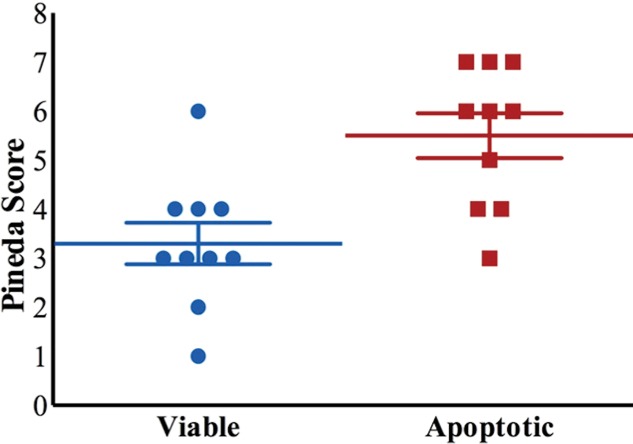
MRI and histologic assessment of labeled viable and apoptotic matrix-associated stem cell implants (MASIs) in cartilage defects of Göttingen minipigs. (a) Sagittal image from proton density–weighted MRI and (b) corresponding color-encoded T2 map overlaid on a T2-weighted spin-echo image obtained 1 week after implantation show similar iron signals and T2 relaxation times for ferumoxytol-labeled viable (blue circle) and apoptotic (red circle) MASIs. (c) Safranin O staining 3 months after the MASI procedure shows better regeneration of the cartilage defect that was implanted with a viable MASI (blue frame) compared with the cartilage defect that was implanted with an apoptotic MASI (red frame). Scale bars = 1000 µm. (d) Sagittal image from proton density–weighted MRI and (e) corresponding color-encoded T2 map overlaid on an image from T2-weighted spin-echo MRI performed at week 2 after implantation show loss of iron signal and increased T2 relaxation time in the apoptotic implant (red circle) but not in the viable transplant (blue circle). (f) Immunofluorescent staining of collagen1 (green) and collagen 2 (red) 3 months after the MASI procedure show better regeneration of the cartilage defect that was implanted with a viable MASI (blue frame) compared with the cartilage defect that was implanted with an apoptotic MASI (red frame). Scale bars = 1000 µm. (g) Scatterplot shows corresponding T2 relaxation times at week 1 and weeks 2, 4, 8, 12, and 24 after implantation of viable (blue) and apoptotic (red) ferumoxytol-labeled MASIs. Mean data in the two groups were significantly different at week 2 (P = .001). (h, i) Scatterplots of (h) quantitative measures of collagen 2 production of viable (blue) and apoptotic (red) MASIs at 3 months and (i) Pineda scores of viable (blue) and apoptotic (red) MASIs at 3 months show better cartilage regeneration outcomes for viable MASIs than for apoptotic MASIs (P < .001 and P = .03, respectively). Data are means and standard errors of the mean.
Figure 4b:
MRI and histologic assessment of labeled viable and apoptotic matrix-associated stem cell implants (MASIs) in cartilage defects of Göttingen minipigs. (a) Sagittal image from proton density–weighted MRI and (b) corresponding color-encoded T2 map overlaid on a T2-weighted spin-echo image obtained 1 week after implantation show similar iron signals and T2 relaxation times for ferumoxytol-labeled viable (blue circle) and apoptotic (red circle) MASIs. (c) Safranin O staining 3 months after the MASI procedure shows better regeneration of the cartilage defect that was implanted with a viable MASI (blue frame) compared with the cartilage defect that was implanted with an apoptotic MASI (red frame). Scale bars = 1000 µm. (d) Sagittal image from proton density–weighted MRI and (e) corresponding color-encoded T2 map overlaid on an image from T2-weighted spin-echo MRI performed at week 2 after implantation show loss of iron signal and increased T2 relaxation time in the apoptotic implant (red circle) but not in the viable transplant (blue circle). (f) Immunofluorescent staining of collagen1 (green) and collagen 2 (red) 3 months after the MASI procedure show better regeneration of the cartilage defect that was implanted with a viable MASI (blue frame) compared with the cartilage defect that was implanted with an apoptotic MASI (red frame). Scale bars = 1000 µm. (g) Scatterplot shows corresponding T2 relaxation times at week 1 and weeks 2, 4, 8, 12, and 24 after implantation of viable (blue) and apoptotic (red) ferumoxytol-labeled MASIs. Mean data in the two groups were significantly different at week 2 (P = .001). (h, i) Scatterplots of (h) quantitative measures of collagen 2 production of viable (blue) and apoptotic (red) MASIs at 3 months and (i) Pineda scores of viable (blue) and apoptotic (red) MASIs at 3 months show better cartilage regeneration outcomes for viable MASIs than for apoptotic MASIs (P < .001 and P = .03, respectively). Data are means and standard errors of the mean.
Figure 4d:
MRI and histologic assessment of labeled viable and apoptotic matrix-associated stem cell implants (MASIs) in cartilage defects of Göttingen minipigs. (a) Sagittal image from proton density–weighted MRI and (b) corresponding color-encoded T2 map overlaid on a T2-weighted spin-echo image obtained 1 week after implantation show similar iron signals and T2 relaxation times for ferumoxytol-labeled viable (blue circle) and apoptotic (red circle) MASIs. (c) Safranin O staining 3 months after the MASI procedure shows better regeneration of the cartilage defect that was implanted with a viable MASI (blue frame) compared with the cartilage defect that was implanted with an apoptotic MASI (red frame). Scale bars = 1000 µm. (d) Sagittal image from proton density–weighted MRI and (e) corresponding color-encoded T2 map overlaid on an image from T2-weighted spin-echo MRI performed at week 2 after implantation show loss of iron signal and increased T2 relaxation time in the apoptotic implant (red circle) but not in the viable transplant (blue circle). (f) Immunofluorescent staining of collagen1 (green) and collagen 2 (red) 3 months after the MASI procedure show better regeneration of the cartilage defect that was implanted with a viable MASI (blue frame) compared with the cartilage defect that was implanted with an apoptotic MASI (red frame). Scale bars = 1000 µm. (g) Scatterplot shows corresponding T2 relaxation times at week 1 and weeks 2, 4, 8, 12, and 24 after implantation of viable (blue) and apoptotic (red) ferumoxytol-labeled MASIs. Mean data in the two groups were significantly different at week 2 (P = .001). (h, i) Scatterplots of (h) quantitative measures of collagen 2 production of viable (blue) and apoptotic (red) MASIs at 3 months and (i) Pineda scores of viable (blue) and apoptotic (red) MASIs at 3 months show better cartilage regeneration outcomes for viable MASIs than for apoptotic MASIs (P < .001 and P = .03, respectively). Data are means and standard errors of the mean.
Figure 4e:
MRI and histologic assessment of labeled viable and apoptotic matrix-associated stem cell implants (MASIs) in cartilage defects of Göttingen minipigs. (a) Sagittal image from proton density–weighted MRI and (b) corresponding color-encoded T2 map overlaid on a T2-weighted spin-echo image obtained 1 week after implantation show similar iron signals and T2 relaxation times for ferumoxytol-labeled viable (blue circle) and apoptotic (red circle) MASIs. (c) Safranin O staining 3 months after the MASI procedure shows better regeneration of the cartilage defect that was implanted with a viable MASI (blue frame) compared with the cartilage defect that was implanted with an apoptotic MASI (red frame). Scale bars = 1000 µm. (d) Sagittal image from proton density–weighted MRI and (e) corresponding color-encoded T2 map overlaid on an image from T2-weighted spin-echo MRI performed at week 2 after implantation show loss of iron signal and increased T2 relaxation time in the apoptotic implant (red circle) but not in the viable transplant (blue circle). (f) Immunofluorescent staining of collagen1 (green) and collagen 2 (red) 3 months after the MASI procedure show better regeneration of the cartilage defect that was implanted with a viable MASI (blue frame) compared with the cartilage defect that was implanted with an apoptotic MASI (red frame). Scale bars = 1000 µm. (g) Scatterplot shows corresponding T2 relaxation times at week 1 and weeks 2, 4, 8, 12, and 24 after implantation of viable (blue) and apoptotic (red) ferumoxytol-labeled MASIs. Mean data in the two groups were significantly different at week 2 (P = .001). (h, i) Scatterplots of (h) quantitative measures of collagen 2 production of viable (blue) and apoptotic (red) MASIs at 3 months and (i) Pineda scores of viable (blue) and apoptotic (red) MASIs at 3 months show better cartilage regeneration outcomes for viable MASIs than for apoptotic MASIs (P < .001 and P = .03, respectively). Data are means and standard errors of the mean.
Figure 4g:
MRI and histologic assessment of labeled viable and apoptotic matrix-associated stem cell implants (MASIs) in cartilage defects of Göttingen minipigs. (a) Sagittal image from proton density–weighted MRI and (b) corresponding color-encoded T2 map overlaid on a T2-weighted spin-echo image obtained 1 week after implantation show similar iron signals and T2 relaxation times for ferumoxytol-labeled viable (blue circle) and apoptotic (red circle) MASIs. (c) Safranin O staining 3 months after the MASI procedure shows better regeneration of the cartilage defect that was implanted with a viable MASI (blue frame) compared with the cartilage defect that was implanted with an apoptotic MASI (red frame). Scale bars = 1000 µm. (d) Sagittal image from proton density–weighted MRI and (e) corresponding color-encoded T2 map overlaid on an image from T2-weighted spin-echo MRI performed at week 2 after implantation show loss of iron signal and increased T2 relaxation time in the apoptotic implant (red circle) but not in the viable transplant (blue circle). (f) Immunofluorescent staining of collagen1 (green) and collagen 2 (red) 3 months after the MASI procedure show better regeneration of the cartilage defect that was implanted with a viable MASI (blue frame) compared with the cartilage defect that was implanted with an apoptotic MASI (red frame). Scale bars = 1000 µm. (g) Scatterplot shows corresponding T2 relaxation times at week 1 and weeks 2, 4, 8, 12, and 24 after implantation of viable (blue) and apoptotic (red) ferumoxytol-labeled MASIs. Mean data in the two groups were significantly different at week 2 (P = .001). (h, i) Scatterplots of (h) quantitative measures of collagen 2 production of viable (blue) and apoptotic (red) MASIs at 3 months and (i) Pineda scores of viable (blue) and apoptotic (red) MASIs at 3 months show better cartilage regeneration outcomes for viable MASIs than for apoptotic MASIs (P < .001 and P = .03, respectively). Data are means and standard errors of the mean.
MASIs with persistent T2 signal at 2 weeks showed higher MOCART scores at 4 weeks (P = .004), 12 weeks (P = .01, nonsignificant after correction), and 24 weeks (P = .003) than MSC implants that had lost their T2 signal at 2 weeks (Table 1). In addition, T2 signal at 2 weeks correlated with MOCART score at 12 and 24 weeks (P = .03; Fig E2a [online]).
MOCART Scores of Ferumoxytol-labeled and Unlabeled Matrix-associated Stem Cell Implants

Note.—Data are means ± standard deviations. MOCART = MR observation of cartilage repair tissue (range, 0–100).
Histologic assessment at 12 and 24 weeks demonstrated better cartilage repair for MASIs with persistent T2 signal at 2 weeks than for MASIs that had lost their T2 signal at 2 weeks (Fig 4c, 4f). MASIs with persistent T2 signal at 2 weeks demonstrated higher extracellular matrix and higher collagen 2 production at Safranin O staining and immunohistochemistry, respectively (23 350 pixels ± 16 531 vs 5230 pixels ± 6185; P < .001 for both; Fig 4h), indicating hyaline cartilage production. Conversely, MASIs that had lost their T2 signal at 2 weeks demonstrated incomplete cartilage defect repair at 12 and 24 weeks with persistent defect, lack of chondrogenic matrix production at Safranin O staining, and predominant collagen type 1 production at immunohistochemical analysis. The Pineda score was lower in MASIs with persistent T2 signal at 2 weeks than in MASIs that had lost their T2 signal at 2 weeks (3.3 ± 1.3 vs 5.5 ± 1.4; P = .03, nonsignificant after correction; Fig 4i). T2 signal at 2 weeks correlated with collagen 2 production at immunohistochemical analysis (P < .001; Fig E2b [online]) and did not show a difference with the Pineda score (P = .05; Fig E2c [online]).
Figure 4c:
MRI and histologic assessment of labeled viable and apoptotic matrix-associated stem cell implants (MASIs) in cartilage defects of Göttingen minipigs. (a) Sagittal image from proton density–weighted MRI and (b) corresponding color-encoded T2 map overlaid on a T2-weighted spin-echo image obtained 1 week after implantation show similar iron signals and T2 relaxation times for ferumoxytol-labeled viable (blue circle) and apoptotic (red circle) MASIs. (c) Safranin O staining 3 months after the MASI procedure shows better regeneration of the cartilage defect that was implanted with a viable MASI (blue frame) compared with the cartilage defect that was implanted with an apoptotic MASI (red frame). Scale bars = 1000 µm. (d) Sagittal image from proton density–weighted MRI and (e) corresponding color-encoded T2 map overlaid on an image from T2-weighted spin-echo MRI performed at week 2 after implantation show loss of iron signal and increased T2 relaxation time in the apoptotic implant (red circle) but not in the viable transplant (blue circle). (f) Immunofluorescent staining of collagen1 (green) and collagen 2 (red) 3 months after the MASI procedure show better regeneration of the cartilage defect that was implanted with a viable MASI (blue frame) compared with the cartilage defect that was implanted with an apoptotic MASI (red frame). Scale bars = 1000 µm. (g) Scatterplot shows corresponding T2 relaxation times at week 1 and weeks 2, 4, 8, 12, and 24 after implantation of viable (blue) and apoptotic (red) ferumoxytol-labeled MASIs. Mean data in the two groups were significantly different at week 2 (P = .001). (h, i) Scatterplots of (h) quantitative measures of collagen 2 production of viable (blue) and apoptotic (red) MASIs at 3 months and (i) Pineda scores of viable (blue) and apoptotic (red) MASIs at 3 months show better cartilage regeneration outcomes for viable MASIs than for apoptotic MASIs (P < .001 and P = .03, respectively). Data are means and standard errors of the mean.
Figure 4f:
MRI and histologic assessment of labeled viable and apoptotic matrix-associated stem cell implants (MASIs) in cartilage defects of Göttingen minipigs. (a) Sagittal image from proton density–weighted MRI and (b) corresponding color-encoded T2 map overlaid on a T2-weighted spin-echo image obtained 1 week after implantation show similar iron signals and T2 relaxation times for ferumoxytol-labeled viable (blue circle) and apoptotic (red circle) MASIs. (c) Safranin O staining 3 months after the MASI procedure shows better regeneration of the cartilage defect that was implanted with a viable MASI (blue frame) compared with the cartilage defect that was implanted with an apoptotic MASI (red frame). Scale bars = 1000 µm. (d) Sagittal image from proton density–weighted MRI and (e) corresponding color-encoded T2 map overlaid on an image from T2-weighted spin-echo MRI performed at week 2 after implantation show loss of iron signal and increased T2 relaxation time in the apoptotic implant (red circle) but not in the viable transplant (blue circle). (f) Immunofluorescent staining of collagen1 (green) and collagen 2 (red) 3 months after the MASI procedure show better regeneration of the cartilage defect that was implanted with a viable MASI (blue frame) compared with the cartilage defect that was implanted with an apoptotic MASI (red frame). Scale bars = 1000 µm. (g) Scatterplot shows corresponding T2 relaxation times at week 1 and weeks 2, 4, 8, 12, and 24 after implantation of viable (blue) and apoptotic (red) ferumoxytol-labeled MASIs. Mean data in the two groups were significantly different at week 2 (P = .001). (h, i) Scatterplots of (h) quantitative measures of collagen 2 production of viable (blue) and apoptotic (red) MASIs at 3 months and (i) Pineda scores of viable (blue) and apoptotic (red) MASIs at 3 months show better cartilage regeneration outcomes for viable MASIs than for apoptotic MASIs (P < .001 and P = .03, respectively). Data are means and standard errors of the mean.
Figure 4h:
MRI and histologic assessment of labeled viable and apoptotic matrix-associated stem cell implants (MASIs) in cartilage defects of Göttingen minipigs. (a) Sagittal image from proton density–weighted MRI and (b) corresponding color-encoded T2 map overlaid on a T2-weighted spin-echo image obtained 1 week after implantation show similar iron signals and T2 relaxation times for ferumoxytol-labeled viable (blue circle) and apoptotic (red circle) MASIs. (c) Safranin O staining 3 months after the MASI procedure shows better regeneration of the cartilage defect that was implanted with a viable MASI (blue frame) compared with the cartilage defect that was implanted with an apoptotic MASI (red frame). Scale bars = 1000 µm. (d) Sagittal image from proton density–weighted MRI and (e) corresponding color-encoded T2 map overlaid on an image from T2-weighted spin-echo MRI performed at week 2 after implantation show loss of iron signal and increased T2 relaxation time in the apoptotic implant (red circle) but not in the viable transplant (blue circle). (f) Immunofluorescent staining of collagen1 (green) and collagen 2 (red) 3 months after the MASI procedure show better regeneration of the cartilage defect that was implanted with a viable MASI (blue frame) compared with the cartilage defect that was implanted with an apoptotic MASI (red frame). Scale bars = 1000 µm. (g) Scatterplot shows corresponding T2 relaxation times at week 1 and weeks 2, 4, 8, 12, and 24 after implantation of viable (blue) and apoptotic (red) ferumoxytol-labeled MASIs. Mean data in the two groups were significantly different at week 2 (P = .001). (h, i) Scatterplots of (h) quantitative measures of collagen 2 production of viable (blue) and apoptotic (red) MASIs at 3 months and (i) Pineda scores of viable (blue) and apoptotic (red) MASIs at 3 months show better cartilage regeneration outcomes for viable MASIs than for apoptotic MASIs (P < .001 and P = .03, respectively). Data are means and standard errors of the mean.
Figure 4i:
MRI and histologic assessment of labeled viable and apoptotic matrix-associated stem cell implants (MASIs) in cartilage defects of Göttingen minipigs. (a) Sagittal image from proton density–weighted MRI and (b) corresponding color-encoded T2 map overlaid on a T2-weighted spin-echo image obtained 1 week after implantation show similar iron signals and T2 relaxation times for ferumoxytol-labeled viable (blue circle) and apoptotic (red circle) MASIs. (c) Safranin O staining 3 months after the MASI procedure shows better regeneration of the cartilage defect that was implanted with a viable MASI (blue frame) compared with the cartilage defect that was implanted with an apoptotic MASI (red frame). Scale bars = 1000 µm. (d) Sagittal image from proton density–weighted MRI and (e) corresponding color-encoded T2 map overlaid on an image from T2-weighted spin-echo MRI performed at week 2 after implantation show loss of iron signal and increased T2 relaxation time in the apoptotic implant (red circle) but not in the viable transplant (blue circle). (f) Immunofluorescent staining of collagen1 (green) and collagen 2 (red) 3 months after the MASI procedure show better regeneration of the cartilage defect that was implanted with a viable MASI (blue frame) compared with the cartilage defect that was implanted with an apoptotic MASI (red frame). Scale bars = 1000 µm. (g) Scatterplot shows corresponding T2 relaxation times at week 1 and weeks 2, 4, 8, 12, and 24 after implantation of viable (blue) and apoptotic (red) ferumoxytol-labeled MASIs. Mean data in the two groups were significantly different at week 2 (P = .001). (h, i) Scatterplots of (h) quantitative measures of collagen 2 production of viable (blue) and apoptotic (red) MASIs at 3 months and (i) Pineda scores of viable (blue) and apoptotic (red) MASIs at 3 months show better cartilage regeneration outcomes for viable MASIs than for apoptotic MASIs (P < .001 and P = .03, respectively). Data are means and standard errors of the mean.
Two implants dislocated, and this complication could be diagnosed on the basis of a lack of iron signal in the cartilage defect on the first postsurgical MRI study. Postmortem histologic assessment confirmed that both defects were macroscopically empty, with minimal Safranin O staining, signs of collagen 1 production, and fibrocartilage formation (Fig E3 [online]).
Discussion
Our data show that ferumoxytol labeling of matrix-associated stem cell implants (MASIs) does not negatively affect cartilage repair processes in joints of clinically relevant size. This information is crucial for clinical translation of ferumoxytol-based cell tracking studies. In addition, we found that ferumoxytol labeling provided important information about stem cell engraftment, which is not attainable without labeling: A persistent iron signal in the cartilage defect 2 weeks after the MASI procedure indicated favorable cartilage repair outcomes, while loss of iron signal indicated unfavorable cartilage repair outcomes.
Ferumoxytol labeling enabled detection of MASI failure at 2 weeks after implantation, when a MOCART score did not yet provide a distinction. To date, successful cartilage repair is diagnosed at MRI on the basis of the morphology and signal intensity of the treated cartilage defect at several months after implantation (26), as quantified by the MOCART score (23,24). Previous techniques for in vivo detection of cell viability have used pH-sensitive alginate-based nanosensors (27) and MRI-detectable peptides and proteins (28). In addition, iron oxide nanoparticles (29) and a caspase-3 activatable contrast agent (21) for detection of stem cell apoptosis have been studied. However, none of these are currently approved by the U.S. Food and Drug Administration (FDA) . Our ferumoxytol-MRI approach has the distinct advantage that it is readily clinically applicable through an “off-label” use of the iron supplement ferumoxytol.
Our results showed that ferumoxytol in MASIs is metabolized over 2 weeks and thereby does not affect the MOCART score later, after 1–6 months (24). Because iron oxide nanoparticles can produce a “blooming effect” (ie, a dark MRI signal void that is larger than the iron-labeled graft), our orthopedic surgeons were concerned whether the iron label could impair the usual clinical MRI assessment of cartilage repair at 12–24 weeks with the MOCART score. We previously tailored the MRI sequence parameters toward limiting blooming effects of ferumoxytol-labeled MSCs (15,19).
To date, to the authors’ knowledge, there is no published evidence regarding the use of ferumoxytol-labeled MSCs for the treatment of cartilage defects in a large-animal model. Kamei et al used ferucarbotran-labeled MSCs to deliver therapeutic cells magnetically to knee cartilage defects in minipigs, with arthroscopic follow-up (30). In accordance with our study, the authors did not find any adverse effects of the iron label on chondrogenic differentiation and regeneration outcomes compared with unlabeled cells.
We showed that ferumoxytol labeling can facilitate an early diagnosis of failing MASIs in full-thickness cartilage defects. It has been previously demonstrated in rodents that a rapid disappearance of iron-labeled MSCs from the transplant site is associated with unsuccessful cartilage repair outcomes (12,31). The apoptotic ferumoxytol-labeled MASIs apparently disappeared because of macrophage clearance (16). However, joint defects in rodents usually represent osteochondral defects, which extend into the underlying bone marrow. This facilitates macrophage migration into MASIs, similar to that occurring in a large microfracture. It was not clear whether previous findings in osteochondral defects would apply to cartilage defects in a large joint with an intact subchondral endplate. In addition, we noted MRI signal alterations within the bone marrow above the cartilage defect, which we had not noted in previous studies in rodents. This observation is in accordance with previous reports in patients of edema-like signal in the bone marrow above full-thickness cartilage defects with intact subchondral endplates (26). This edema-like signal effect is different from the tissue defect of an osteochondral defect or microfracture, where the subchondral endplate has been disrupted and marrow cells have a direct path to migrate into the cartilage defect.
We found that apoptotic MASIs lost their iron signal faster than viable MASIs. This is in accordance with previous studies in rodents, which showed a relatively slower ferumoxytol metabolization in viable MSCs (19) and faster metabolization of iron by macrophages, which had phagocytosed apoptotic labeled MSCs (16). We labeled our MSCs with less than 10 pg iron per cell to preserve cartilage repair outcomes of labeled implants. While it would be desirable to track ferumoxytol-labeled cells for a longer time period than 2 weeks, this would require a higher initial iron load and would pose a risk to cartilage repair outcomes. Kostura et al (17) and Roeder et al (17) reported an iron dose–dependent impaired chondrogenesis of MSCs after iron labeling. Other investigators reported no impairment in MSC chondrogenesis if the cells were labeled with less than 10 pg iron per cell (19,32). Using different nanoparticle compounds or more sensitive MRI sequences might enable us to extend the time interval during which iron-labeled MSCs can be detected with MRI. In a previous study, we were able to track cells for up to 6 weeks when the cells were labeled with the larger superparamagnetic iron oxide compound ferumoxides (31). Unfortunately, ferumoxides (Feridex/Endorem) has been taken off the market and is no longer available for clinical applications.
We recognize several limitations of our study. Ferumoxytol is FDA-approved as an iron supplement. Applications as a contrast agent occur through an “off-label” use and have to be approved by institutional review boards and/or hospital boards. Intravenous ferumoxytol administration can lead to anaphylactic reactions in 0.02% of patients, which is on the order of the rate of anaphylactic reactions to ionic iodinated contrast agents but is significantly higher than the frequency of anaphylactic reactions to small molecular gadolinium chelates (33). We previously investigated the safety of ferumoxytol in patients (34) and have used ferumoxytol in four different clinical trials (35–38), including a trial that tracks iron-labeled MSCs in patients (38). We have not encountered severe anaphylactic reactions in our patients thus far, and it is unknown if the small amount of iron delivered locally with labeled MASIs could lead to systemic allergic reactions.
We observed differences between viable and apoptotic MASIs at a single time point, 2 weeks after implantation. Applications in patients will have to define a time interval around the previously noted 2-week time point during which differences between viable and apoptotic MASIs can be noted at clinical MRI. Future additions of advanced MRI pulse sequences such as quantitative susceptibility mapping might help increase the sensitivity of our approach.
It is debated whether MSCs contribute to cartilage repair processes directly (by differentiation into chondrocytes) or indirectly (by providing growth factors) (39). Our studies could not provide an answer to this question, because in either case, we could not find MSCs in the cartilage defect at 3 months. We previously confirmed in a rodent model that viable stem cells persisted in osteochondral defects for at least 4 weeks after their transplantation (15).
In summary, ferumoxytol labeling provides important information about matrix-associated stem cell implant (MASI) engraftment that is not attainable with conventional MRI. Information about lost MRI signal at 2 weeks after MASI could be used to avoid further follow-up studies of lost transplants and to refer patients with failing implants to alternative treatment options. Our imaging approach can be directly translated to clinical studies and can potentially be used to detect complications at an early stage, when corrective interventions are still possible.
APPENDIX
SUPPLEMENTAL FIGURES
Acknowledgments
Acknowledgments
We thank all members of the veterinary service center at Stanford for animal handling, caretaking, and valuable teamwork regarding this project.
A.J.T. and H.N. contributed equally to this work.
Supported by the National Institute of Arthritis and Musculoskeletal and Skin Diseases (R01 AR054458).
Disclosures of Conflicts of Interest: A.J.T. disclosed no relevant relationships. H.N. disclosed no relevant relationships. O.L. disclosed no relevant relationships. K.Y. disclosed no relevant relationships. K.L. disclosed no relevant relationships. L.K. disclosed no relevant relationships. C.W. disclosed no relevant relationships. J.T. disclosed no relevant relationships. R.B. Activities related to the present article: disclosed no relevant relationships. Activities not related to the present article: is a consultant for and receives royalties from Stryker. Other relationships: disclosed no relevant relationships. T.L. disclosed no relevant relationships. S.F. Activities related to the present article: disclosed no relevant relationships. Activities not related to the present article: is a consultant for the Association for Assessment and Accreditation of Laboratory Animal Care International; institution has grants or grants pending from Stanford University and the American College of Laboratory Animal Medicine (ACLAM) Foundation; is a member of the ACLAM Exam Committee; has received payment from Thermo Fisher Scientific Consulting and In-Vivo Science International Consulting. Other relationships: disclosed no relevant relationships. H.E.D. disclosed no relevant relationships.
Abbreviations:
- FDA
- Food and Drug Administration
- MASI
- matrix-associated stem cell implant
- MOCART
- MR observation of cartilage repair tissue
- MSC
- mesenchymal stromal cell
References
- 1.Glyn-Jones S, Palmer AJ, Agricola R, et al. Osteoarthritis. Lancet 2015;386(9991):376–387. [DOI] [PubMed] [Google Scholar]
- 2.Helmick CG, Felson DT, Lawrence RC, et al. Estimates of the prevalence of arthritis and other rheumatic conditions in the United States. Part I. Arthritis Rheum 2008;58(1):15–25. [DOI] [PubMed] [Google Scholar]
- 3.Lawrence RC, Felson DT, Helmick CG, et al. Estimates of the prevalence of arthritis and other rheumatic conditions in the United States: part II. Arthritis Rheum 2008;58(1):26–35. [DOI] [PMC free article] [PubMed] [Google Scholar]
- 4.Bornes TD, Adesida AB, Jomha NM. Mesenchymal stem cells in the treatment of traumatic articular cartilage defects: a comprehensive review. Arthritis Res Ther 2014;16(5):432. [DOI] [PMC free article] [PubMed] [Google Scholar]
- 5.Wakitani S, Imoto K, Yamamoto T, Saito M, Murata N, Yoneda M. Human autologous culture expanded bone marrow mesenchymal cell transplantation for repair of cartilage defects in osteoarthritic knees. Osteoarthritis Cartilage 2002;10(3):199–206. [DOI] [PubMed] [Google Scholar]
- 6.Kuroda R, Ishida K, Matsumoto T, et al. Treatment of a full-thickness articular cartilage defect in the femoral condyle of an athlete with autologous bone-marrow stromal cells. Osteoarthritis Cartilage 2007;15(2):226–231. [DOI] [PubMed] [Google Scholar]
- 7.Giannini S, Buda R, Battaglia M, et al. One-step repair in talar osteochondral lesions: 4-year clinical results and t2-mapping capability in outcome prediction. Am J Sports Med 2013;41(3):511–518. [DOI] [PubMed] [Google Scholar]
- 8.Haleem AM, Singergy AA, Sabry D, et al. The clinical use of human culture-expanded autologous bone marrow mesenchymal stem cells transplanted on platelet-rich fibrin glue in the treatment of articular cartilage defects: a pilot study and preliminary results. Cartilage 2010;1(4):253–261. [DOI] [PMC free article] [PubMed] [Google Scholar]
- 9.de Windt TS, Welsch GH, Brittberg M, et al. Is magnetic resonance imaging reliable in predicting clinical outcome after articular cartilage repair of the knee? a systematic review and meta-analysis. Am J Sports Med 2013;41(7):1695–1702. [DOI] [PubMed] [Google Scholar]
- 10.Guermazi A, Roemer FW, Alizai H, et al. State of the art: MR imaging after knee cartilage repair surgery. Radiology 2015;277(1):23–43. [DOI] [PubMed] [Google Scholar]
- 11.Trattnig S, Winalski CS, Marlovits S, Jurvelin JS, Welsch GH, Potter HG. Magnetic resonance imaging of cartilage repair: a review. Cartilage 2011;2(1):5–26. [DOI] [PMC free article] [PubMed] [Google Scholar]
- 12.Hunziker EB. Articular cartilage repair: basic science and clinical progress—a review of the current status and prospects. Osteoarthritis Cartilage 2002;10(6):432–463. [DOI] [PubMed] [Google Scholar]
- 13.Vasiliadis HS, Wasiak J, Salanti G. Autologous chondrocyte implantation for the treatment of cartilage lesions of the knee: a systematic review of randomized studies. Knee Surg Sports Traumatol Arthrosc 2010;18(12):1645–1655. [DOI] [PubMed] [Google Scholar]
- 14.Castaneda RT, Khurana A, Khan R, Daldrup-Link HE. Labeling stem cells with ferumoxytol, an FDA-approved iron oxide nanoparticle. J Vis Exp 2011;(57):e3482. [DOI] [PMC free article] [PubMed] [Google Scholar]
- 15.Khurana A, Nejadnik H, Chapelin F, et al. Ferumoxytol: a new, clinically applicable label for stem-cell tracking in arthritic joints with MRI. Nanomedicine (Lond) 2013;8(12):1969–1983. [DOI] [PMC free article] [PubMed] [Google Scholar]
- 16.Nejadnik H, Lenkov O, Gassert F, Fretwell D, Lam I, Daldrup-Link HE. Macrophage phagocytosis alters the MRI signal of ferumoxytol-labeled mesenchymal stromal cells in cartilage defects. Sci Rep 2016;6(1):25897. [DOI] [PMC free article] [PubMed] [Google Scholar]
- 17.Kostura L, Kraitchman DL, Mackay AM, Pittenger MF, Bulte JW. Feridex labeling of mesenchymal stem cells inhibits chondrogenesis but not adipogenesis or osteogenesis. NMR Biomed 2004;17(7):513–517. [DOI] [PubMed] [Google Scholar]
- 18.Roeder E, Henrionnet C, Goebel JC, et al. Dose-response of superparamagnetic iron oxide labeling on mesenchymal stem cells chondrogenic differentiation: a multi-scale in vitro study. PLoS One 2014;9(5):e98451. [DOI] [PMC free article] [PubMed] [Google Scholar]
- 19.Khurana A, Chapelin F, Beck G, et al. Iron administration before stem cell harvest enables MR imaging tracking after transplantation. Radiology 2013;269(1):186–197. [DOI] [PMC free article] [PubMed] [Google Scholar]
- 20.Cheng MH, Cheng HT, Lin SS, et al. Apoptotic death mode of mitomycin C-treated HeLa cells and cellular localization of mitomycin C-induced P-glycoprotein. Drug Chem Toxicol 2009;32(2):158–168. [DOI] [PubMed] [Google Scholar]
- 21.Nejadnik H, Ye D, Lenkov OD, et al. Magnetic resonance imaging of stem cell apoptosis in arthritic joints with a caspase activatable contrast agent. ACS Nano 2015;9(2):1150–1160. [DOI] [PMC free article] [PubMed] [Google Scholar]
- 22.Feet first swine locomotion scoring system. Zinpro. https://www.zinpro.com/lameness/swine/locomotion-scoring. Accessed September 14, 2018.
- 23.Welsch GH, Zak L, Mamisch TC, et al. Advanced morphological 3D magnetic resonance observation of cartilage repair tissue (MOCART) scoring using a new isotropic 3D proton-density, turbo spin echo sequence with variable flip angle distribution (PD-SPACE) compared to an isotropic 3D steady-state free precession sequence (True-FISP) and standard 2D sequences. J Magn Reson Imaging 2011;33(1):180–188. [DOI] [PubMed] [Google Scholar]
- 24.Welsch GH, Zak L, Mamisch TC, Resinger C, Marlovits S, Trattnig S. Three-dimensional magnetic resonance observation of cartilage repair tissue (MOCART) score assessed with an isotropic three-dimensional true fast imaging with steady-state precession sequence at 3.0 Tesla. Invest Radiol 2009;44(9):603–612. [DOI] [PubMed] [Google Scholar]
- 25.Hommel G. A stagewise rejective multiple test procedure based on a modified Bonferroni test. Biometrika 1988;75(2):383–386. [Google Scholar]
- 26.Trattnig S, Ba-Ssalamah A, Pinker K, Plank C, Vecsei V, Marlovits S. Matrix-based autologous chondrocyte implantation for cartilage repair: noninvasive monitoring by high-resolution magnetic resonance imaging. Magn Reson Imaging 2005;23(7):779–787. [DOI] [PubMed] [Google Scholar]
- 27.Chan KW, Liu G, Song X, et al. MRI-detectable pH nanosensors incorporated into hydrogels for in vivo sensing of transplanted-cell viability. Nat Mater 2013;12(3):268–275. [DOI] [PMC free article] [PubMed] [Google Scholar]
- 28.Zhao M, Beauregard DA, Loizou L, Davletov B, Brindle KM. Non-invasive detection of apoptosis using magnetic resonance imaging and a targeted contrast agent. Nat Med 2001;7(11):1241–1244. [DOI] [PubMed] [Google Scholar]
- 29.Nedopil A, Klenk C, Kim C, et al. MR signal characteristics of viable and apoptotic human mesenchymal stem cells in matrix-associated stem cell implants for treatment of osteoarthritis. Invest Radiol 2010;45(10):634–640. [DOI] [PMC free article] [PubMed] [Google Scholar]
- 30.Kamei G, Kobayashi T, Ohkawa S, et al. Articular cartilage repair with magnetic mesenchymal stem cells. Am J Sports Med 2013;41(6):1255–1264. [DOI] [PubMed] [Google Scholar]
- 31.Henning TD, Gawande R, Khurana A, et al. Magnetic resonance imaging of ferumoxide-labeled mesenchymal stem cells in cartilage defects: in vitro and in vivo investigations. Mol Imaging 2012;11(3):197–209. [PMC free article] [PubMed] [Google Scholar]
- 32.Daldrup-Link HE, Nejadnik H. MR imaging of stem cell transplants in arthritic joints. J Stem Cell Res Ther 2014;4(2):165. [DOI] [PMC free article] [PubMed] [Google Scholar]
- 33.Toth GB, Varallyay CG, Horvath A, et al. Current and potential imaging applications of ferumoxytol for magnetic resonance imaging. Kidney Int 2017;92(1):47–66. [DOI] [PMC free article] [PubMed] [Google Scholar]
- 34.Muehe AM, Feng D, von Eyben R, et al. Safety report of ferumoxytol for magnetic resonance imaging in children and young adults. Invest Radiol 2016;51(4):221–227. [DOI] [PMC free article] [PubMed] [Google Scholar]
- 35.Klenk C, Gawande R, Uslu L, et al. Ionising radiation-free whole-body MRI versus (18)F-fluorodeoxyglucose PET/CT scans for children and young adults with cancer: a prospective, non-randomised, single-centre study. Lancet Oncol 2014;15(3):275–285. [DOI] [PubMed] [Google Scholar]
- 36.Muehe AM, Theruvath AJ, Lai L, et al. How to provide gadolinium-free PET/MR cancer staging of children and young adults in less than 1 h: the Stanford approach. Mol Imaging Biol 2018;20(2):324–335. [DOI] [PMC free article] [PubMed] [Google Scholar]
- 37.Aghighi M, Theruvath AJ, Pareek A, et al. Magnetic resonance imaging of tumor-associated macrophages: clinical translation. Clin Cancer Res 2018;24(17):4110–4118. [DOI] [PMC free article] [PubMed] [Google Scholar]
- 38.Theruvath AJ, Nejadnik H, Muehe AM, et al. Tracking cell transplants in femoral osteonecrosis with magnetic resonance imaging: a proof-of-concept study in patients. Clin Cancer Res 2018;24(24):6223–6229. [DOI] [PMC free article] [PubMed] [Google Scholar]
- 39.Lee WY, Wang B. Cartilage repair by mesenchymal stem cells: clinical trial update and perspectives. J Orthop Translat 2017;9:76–88. [DOI] [PMC free article] [PubMed] [Google Scholar]
Associated Data
This section collects any data citations, data availability statements, or supplementary materials included in this article.


