

Abstract
Rationale & Objective:
A large residual risk for atherosclerotic cardiovascular disease (ASCVD) remains in the setting of chronic kidney disease (CKD) despite treatment with statins. We sought to evaluate the associations of lipid and apolipo-protein levels with risk for ASCVD in individuals with CKD.
Study Design:
Prospective cohort study.
Settings & Participants:
Adults aged 21 to 74 years with non—dialysis-dependent CKD at baseline enrolled in the Chronic Renal Insufficiency Cohort (CRIC) Study in 7 clinical study centers in the United States.
Predictor:
Baseline total cholesterol, non—high-density lipoprotein cholesterol (non—HDL-C), very low-density lipoprotein cholesterol (VLDL-C), triglycerides, low-density lipoprotein cholesterol (LDL-C), apolipoprotein B (Apo-B), HDL-C, and apolipoprotein AI (Apo-AI) values stratified into tertiles.
Outcome:
A composite ASCVD event of myocardial infarction or ischemic stroke.
Analytic Approach:
Multivariable Cox proportional hazards regression to estimate the risk for ASCVD for each tertile of lipoprotein predictor.
Results:
Among 3,811 CRIC participants (mean age, 57.7 years; 41.8% white), there were 451 ASCVD events during a median follow-up of 7.9 years. There was increased ASCVD risk among participants with VLDL-C levels in the highest tertile (HR, 1.28; 95% CI, 1.01–1.64), Apo-B levels in the middle tertile (HR, 1.30; 95% CI, 1.03–1.64), HDL-C levels in the middle and lowest tertiles (HRs of 1.40 [95% CI, 1.08–1.83] and 1.77 [95% CI, 1.35–2.33], respectively), and Apo-AI levels in the middle and lowest tertiles (HRs of 1.77 [95% CI, 1.02–1.74] and 1.77 [95% CI, 1.36–2.32], respectively). LDL-C level was not significantly associated with the ASCVD outcome in this population (HR, 1.00 [95% CI, 0.77–1.30] for the highest tertile).
Limitations:
Associations based on observational data do not permit inferences about causal associations.
Conclusions:
Higher VLDL-C and Apo-B levels, as well as lower HDL-C and Apo-AI levels, are associated with increased risk for ASCVD. These findings support future investigations into pharmacologic targeting of lipoproteins beyond LDL-C, such as triglyceride-rich lipoproteins, to reduce residual risk for ASCVD among individuals with CKD.
Chronic kidney disease (CKD) affects almost 1 in 7 adults in the United States1 and is associated with increased rates of cardiovascular disease.2 More people with CKD will die of a cardiovascular cause than progress to end-stage kidney disease.3 Reduced kidney function is associated with accelerated atherosclerosis, along with disruptions in the morphology and metabolism of lipids.4–6 The resulting dyslipidemia in CKD is typically characterized by high triglyceride and low high-density lipoprotein cholesterol (HDL-C) levels.7
Attempts to reduce atherosclerotic disease in CKD have generally been extensions of strategies used in the general population,8 namely with HMG-CoA (β-Hydroxy β-methylglutaryl coenzyme A) reductase inhibitors (statins),9 which lower low-density lipoprotein cholesterol (LDL-C) levels. SHARP (The Study of Heart and Renal Protection)10 remains the largest clinical trial of lipidlowering agents in CKD. The trial demonstrated a significant 17% atherosclerotic cardiovascular disease (ASCVD) risk reduction with simvastatin plus ezetimibe compared to placebo. However, 11.3% of the treatment group still experienced a major cardiovascular event during the 4.9-year follow-up. This residual risk grows in later stages of CKD. A recent meta-analysis11 of 13 randomized controlled trials of statins in CKD found that the response to statins diminishes in later stages of CKD, with pooled data showing that 13% of treatment groups with CKD stage 3 experienced a major cardiovascular event, 10% with stage 4, and 22% with stage 5. There is obvious room for greater reduction in ASCVD risk in CKD beyond LDL-C lowering with statins, highlighting the need for other therapeutic targets.
Prior studies12–15 evaluating associations between specific lipid and lipoprotein levels with adverse outcomes in CKD are limited in scope and generalizability. Results from these studies are mixed but generally suggest a null to inverse association between LDL-C level and ASCVD risk in CKD.13,14 In the present study, we use the Chronic Renal Insufficiency Cohort (CRIC), the largest established prospectively followed up cohort of adults with CKD in the United States, to explore the association between different lipid and apolipoprotein measures with ASCVD outcomes, specifically myocardial infarction (MI) and ischemic stroke.
Methods
Study Design and Population
The CRIC Study has been described extensively.16–19 Briefly, 3,939 participants aged 21 to 74 years were recruited from 7 clinical centers located across the United States according to age-based estimated glomerular filtration rate (eGFR) inclusion criteria. Exclusion criteria included history of New York Heart Association class III/ IV heart failure, cirrhosis, human immunodeficiency virus (HIV) infection, multiple myeloma, renal carcinoma, polycystic kidney disease, organ transplant, dialysis therapy, immunotherapy, and chemotherapy. The institutional review board at each study site approved the study protocol. Participants provided written informed consent.
Data Collection
As previously described,16,17 participants completed an in-person baseline visit, with collection of blood and 24-hour urine samples. Participants returned annually for visits and were contacted by telephone at 6-month intervals for interim health updates. Plasma lipids were measured on fasting blood samples before freezing. Total cholesterol, HDL-C, and triglycerides were measured using the enzymatic colorimetric method; LDL-C and very low-density lipoprotein cholesterol (VLDL-C) were measured using β-quantification; and apolipoprotein B (Apo-B) and apolipoprotein AI (Apo-AI) were measured using immu-noturbidimetric assays. Non—HDL-C was calculated by subtracting HDL-C from total cholesterol. eGFR was calculated using an equation derived from CRIC participants using serum creatinine and cystatin C levels, age, sex, and race.20
Assessment of Outcomes
Hospitalizations ascertained through participant self-report were confirmed by review of medical records for International Classification of Diseases, Ninth Revision and Current Procedural Terminology codes, which were adjudicated by 2 physicians. The primary end point was fatal and nonfatal MI or ischemic stroke, whichever occurred first. Participants were censored at the time of death, withdrawal from the study, or upon database lock in mid-2014.
Statistical Analysis
Baseline characteristics were described using mean with standard deviation (SD) or median with interquartile range for continuous variables and frequency and percent for categorical variables. Skewed variables were natural log—transformed. Group comparisons were conducted using Wilcoxon rank sum or Kruskal-Wallis tests for continuous variables and χ2 tests for categorical variables. All analyses were performed using Stata, version 14 (StataCorp). All tests were 2 sided, with P < 0.05 considered significant.
Participants with available baseline lipid measurements were stratified into tertiles for each lipid measure based on level. Crude event rates were compared using log-rank test.
A Cox proportional hazards model was used to determine hazard ratios (HRs) with associated confidence intervals (CIs) for the outcome for each lipid parameter. The lowest lipid or apolipoprotein tertile was used as the reference except with HDL-C and Apo-AI, for which the highest tertile was used. The proportional hazards assumption was met based on Schoenfeld residuals for all parameters using the fully adjusted Cox model. Covariates were selected a priori on the basis of previously described risk factors for ASCVD. First, the association was evaluated using an unadjusted univariate analysis (model 1). Model 2 adjusted for age, sex, race, clinical site, baseline systolic blood pressure, body mass index, tobacco use (yes/no), diabetes mellitus (yes/no), and statin use (yes/no). Model 3 additionally adjusted for eGFR and 24-hour urine protein excretion. The final model was repeated using continuous measures for each lipid.
In sensitivity analyses, follow-up time was restricted to 3 or 5 years. Further sensitivity analyses were performed modeling each lipoprotein predictor as a restricted cubic spline, with knots at the 10th, 50th, and 90th percentiles, to assess for nonlinear associations with the outcome. In secondary analyses, to evaluate for independent associations between lipid tertiles and the outcome, the final model for each lipid was additionally adjusted for the other lipid parameters not in high correlation (correlation coefficient < 0.80); non—HDL-C level was not adjusted for because it was calculated from total cholesterol and HDL-C levels.
To explore for effect modification by the other lipid or apolipoprotein on the association between select lipoprotein predictors and the outcome, interaction terms with a 2-category form (low vs high, with a cutoff at the median) of each of the other 6 lipids or apolipoproteins were included 1 at a time into the final model. In other exploratory analyses, the final model for each lipoprotein predictor was repeated after stratifying by subgroups of baseline eGFR, urine protein excretion, and statin use and tested for interaction by subgroup. Low eGFR was defined as eGFR less than the median (45 mL/min/1.73 m2). Proteinuria was defined as 24-hour urine protein excretion ≥ 150 mg.
In other secondary analyses, participants with a history of MI, cardiac revascularization, or a cerebrovascular event at baseline were excluded. Cerebrovascular events from the medical history were not further classified into subtypes, so all were excluded, given that >80% of strokes are expected to be ischemic.21,22
Results
Study Participants
Of the 3,939 CRIC Study participants, 128 were excluded due to incomplete baseline lipid profiles (Fig S1). Characteristics of excluded participants were similar to those included in the analyses except in distributions of race and body mass index (Table S1). Baseline characteristics for the study cohort overall and by tertiles of triglycerides are described in Table 1. The mean age of the study cohort was 57.7 years, 55.1% were men, and 41.8% were non-Hispanic white. Distributions of each lipid or apolipoprotein level overall and stratified by baseline eGFR, proteinuria, and statin use are illustrated in Figure S2.
Table 1.
Baseline Characteristics for CRIC Study Participants Overall and Stratified by Tertile of Triglycerides
| Triglyceride Tertile |
|||||
|---|---|---|---|---|---|
| Characteristics | Overall (N = 3,811) |
<103 mg/dL (n = 1,271) |
103–160 mg/dL (n = 1,273) |
>160 mg/dL (n = 1,267) |
P |
| Demographics | |||||
| Age, y | 57.7 ± 11.0 | 57.3 ± 11.7 | 58.6 ± 10.4 | 57.1 ± 10.9 | 0.002 |
| Male sex | 2,101 (55.1%) | 651 (51.2%) | 678 (53.3%) | 772 (60.9%) | <0.001 |
| Race/ethnicity | <0.001 | ||||
| Non-Hispanic white | 1,591 (41.8%) | 499 (39.3%) | 515 (40.5%) | 577 (45.5%) | |
| Non-Hispanic black | 1,576 (41.4%) | 651 (51.2%) | 537 (42.2%) | 388 (30.6%) | |
| Hispanic | 490 (12.9%) | 75 (5.9%) | 175 (13.8%) | 240 (18.9%) | |
| Other | 154 (4.0%) | 46 (3.6%) | 46 (3.6%) | 62 (4.9%) | |
| High school graduate | 3,012 (79.1%) | 1,042 (82.0%) | 979 (76.9%) | 991 (78.3%) | 0.005 |
| Medical History | |||||
| Current smoker | 494 (13.0%) | 146 (11.5%) | 170 (13.4%) | 178 (14.1%) | 0.1 |
| >100 cigarettes in lifetime | 2,086 (54.7%) | 653 (51.4%) | 678 (53.3%) | 755 (59.6%) | <0.001 |
| Current alcohol use | 2,392 (62.8%) | 809 (63.7%) | 784 (61.6%) | 799 (63.1%) | 0.5 |
| Prior MI/revascularization | 832 (21.8%) | 238 (18.7%) | 300 (23.6%) | 294 (23.2%) | 0.004 |
| Prior stroke | 380 (10.0%) | 121 (9.5%) | 146 (11.5%) | 113 (8.9%) | 0.08 |
| Hypertension | 3,281 (86.1%) | 1,048 (82.5%) | 1,122 (88.1%) | 1,111 (87.7%) | <0.001 |
| Diabetes | 1,848 (48.5%) | 543 (42.7%) | 605 (47.5%) | 700 (55.3%) | <0.001 |
| HbA1c, % | 6.6 ± 1.6 | 6.4 ± 1.4 | 6.6 ± 1.5 | 6.8 ± 1.7 | <0.001 |
| Statin use | 2,092 (55.3%) | 646 (51.1%) | 750 (59.3%) | 696 (55.5%) | <0.001 |
| Anthropometric Measurements | |||||
| Systolic BP, mm Hg | 128 ± 22 | 127 ± 22 | 130 ± 23 | 129 ± 22 | <0.001 |
| Diastolic BP, mm Hg | 72 ± 13 | 71 ± 13 | 71 ± 13 | 72 ± 13 | 0.06 |
| BMI, kg/m2 | 32.1 ± 7.8 | 30.9 ± 8.3 | 32.4 ± 7.7 | 33.1 ± 7.2 | <0.001 |
| Kidney Function Measures | |||||
| Serum creatinine, mg/dL | 1.84 ± 0.65 | 1.76 ± 0.65 | 1.86 ± 0.64 | 1.90 ± 0.65 | <0.001 |
| Serum cystatin C, mg/L | 1.42 [1.12–1.82] | 1.29 [1.03–1.70] | 1.45 [1.13–1.87] | 1.51 [1.22–1.92] | <0.001 |
| eGFR, mL/min/1.73 m2 | 44.9 ± 16.8 | 48.6 ± 18.1 | 43.8 ± 16.4 | 42.2 ± 15.3 | <0.001 |
| Urine protein, g/d | 0.18 [0.07–0.91] | 0.13 [0.07–0.54] | 0.19 [0.07–0.87] | 0.29 [0.08–1.65] | <0.001 |
| Plasma Lipid Levels | |||||
| Total cholesterol, mg/dL | 184 ± 45 | 169 ± 38 | 182 ± 41 | 199 ± 50 | <0.001 |
| Non—HDL-C, mg/dL | 136 ± 43 | 114 ± 32 | 135 ± 36 | 159 ± 47 | <0.001 |
| VLDL-C, mg/dL | 27 [17–42] | 14 [9–19] | 27 [22–34] | 50 [39–68] | <0.001 |
| Triglycerides, mg/dL | 129 [89–187] | 78 [64−90] | 129 [115–143] | 224 [187–293] | <0.001 |
| LDL-C, mg/dL | 103 ± 35 | 100 ± 31 | 107 ± 36 | 101 ± 39 | <0.001 |
| Apolipoprotein B, mg/dL | 84 ± 24 | 73 ± 19 | 85 ± 22 | 95 ± 27 | <0.001 |
| HDL-C, mg/dL | 47 ± 15 | 55 ± 17 | 47 ± 13 | 41 ± 12 | <0.001 |
| Apolipoprotein AI, mg/dL | 136 ± 29 | 142 ± 31 | 136 ± 27 | 131 ± 29 | <0.001 |
Note: Continuous data expressed as mean ± standard deviation or median [interquartile range]; categorical data expressed as count (percentage). Conversion factors for units: cholesterol from mg/dL to mmol/L, ×0.0259; serum creatinine in mg/dL to μmol/L, ×88.4.
Abbreviations: BMI, body mass index; BP, blood pressure; CRIC, Chronic Renal Insufficiency Cohort; eGFR, estimated glomerular filtration rate; HbA1c, hemoglobin A1c; HDL-C, high-density lipoprotein cholesterol; LDL-C, low-density lipoprotein cholesterol; MI, myocardial infarction; non—HDL-C, non high-density lipoprotein cholesterol; VLDL-C, very low-density lipoprotein cholesterol.
Association of Lipid and Apolipoprotein Levels With ASCVD Outcomes
During a median follow-up of 7.9 years, 451 participants experienced an ASCVD event (MI or ischemic stroke). Event rates differed significantly across tertiles for VLDL-C, triglycerides, HDL-C, and Apo-AI (Fig 1; Table S2). HRs with 95% CIs for ASCVD risk per tertile of each lipid subclass are shown in Table 2. After adjusting for cova-riates, the highest tertile of VLDL-C was associated with 28% increased ASCVD risk and the middle tertile of Apo-B was associated with 30% increased risk. Further, there were 40% and 77% increased ASCVD risks for the middle and lowest tertiles of HDL-C, respectively, and 77% increased risk for both the middle and lowest tertiles of Apo-AI. Restricting follow-up time to the first 3 or 5 years did not significantly change results, and associations between triglyceride, VLDL-C, HDL-C, and Apo-AI levels with the outcome were consistent with results using maximally available follow-up time (Table S3).
Figure 1.

Unadjusted event rates for atherosclerotic cardiovascular disease (ASCVD) per 1,000 person-years by tertiles of very lowdensity lipoprotein cholesterol (VLDL-C), triglycerides, high-density lipoprotein cholesterol (HDL-C), and apolipoprotein AI. Error bars represent 95% confidence intervals. P values for trends shown. Conversion factor for cholesterol from mg/dL to mmol/L, ×0.0259.
Table 2.
Association Between Tertiles of Baseline Lipid and Apolipoprotein Levels With Atherosclerotic Cardiovascular Disease in the CRIC Study Cohort
| Model 1a |
Model 2b |
Model 3c |
||||
|---|---|---|---|---|---|---|
| HR (95% CI) | P | HR (95% CI) | P | HR (95% CI) | P | |
| Total Cholesterol | ||||||
| T1 (<162 mg/dL) | 1.00 (reference) | 1.00 (reference) | 1.00 (reference) | |||
| T2 (162–198 mg/dL) | 0.94 (0.75–1.17) | 0.5 | 1.04 (0.83–1.31) | 0.7 | 1.01 (0.80–1.26) | 0.9 |
| T3 (>198 mg/dL) | 0.83 (0.66–1.05) | 0.1 | 1.10 (0.86–1.41) | 0.5 | 0.94 (0.73–1.23) | 0.7 |
| Non—HDL-C | ||||||
| T1 (<115 mg/dL) | 1.00 (reference) | 1.00 (reference) | 1.00 (reference) | |||
| T2 (115–147 mg/dL) | 1.13 (0.91–1.42) | 0.3 | 1.26 (1.00–1.58) | 0.05 | 1.21 (0.96–1.53) | 0.1 |
| T3 (>147 mg/dL) | 1.01 (0.80–1.27) | 0.9 | 1.29 (1.01–1.65) | 0.04 | 1.14 (0.88–1.47) | 0.3 |
| VLDL-C | ||||||
| T1 (<21 mg/dL) | 1.00 (reference) | 1.00 (reference) | 1.00 (reference) | |||
| T2 (21–36 mg/dL) | 1.14 (0.90–1.45) | 0.3 | 1.13 (0.89–1.44) | 0.3 | 1.09 (0.86–1.40) | 0.5 |
| T3 (>36 mg/dL) | 1.53 (1.22–1.92) | <0.001 | 1.48 (1.17–1.87) | 0.001 | 1.28 (1.01–1.64) | 0.04 |
| Triglycerides | ||||||
| T1 (<103 mg/dL) | 1.00 (reference) | 1.00 (reference) | 1.00 (reference) | |||
| T2 (103–160 mg/dL) | 1.32 (1.04–1.67) | 0.02 | 1.18 (0.93–1.50) | 0.2 | 1.10 (0.86–1.41) | 0.4 |
| T3 (>160 mg/dL) | 1.50 (1.19–1.89) | 0.001 | 1.42 (1.11–1.81) | 0.005 | 1.26 (0.98–1.62) | 0.07 |
| LDL-C | ||||||
| T1 (<85 mg/dL) | 1.00 (reference) | 1.00 (reference) | 1.00 (reference) | |||
| T2 (85–113 mg/dL) | 0.96 (0.77–1.19) | 0.7 | 1.04 (0.84–1.31) | 0.7 | 1.06 (0.84–1.33) | 0.6 |
| T3 (>113 mg/dL) | 0.77 (0.61–0.97) | 0.03 | 1.04 (0.81–1.33) | 0.8 | 1.00 (0.77–1.30) | 0.9 |
| Apolipoprotein B | ||||||
| T1 (<73 mg/dL) | 1.00 (reference) | 1.00 (reference) | 1.00 (reference) | |||
| T2 (73–91 mg/dL) | 1.22 (0.97–1.53) | 0.09 | 1.29 (1.03–1.62) | 0.03 | 1.30 (1.03–1.64) | 0.03 |
| T3 (>91 mg/dL) | 1.15 (0.91–1.45) | 0.2 | 1.41 (1.11–1.80) | 0.005 | 1.26 (0.98–1.63) | 0.07 |
| HDL-C | ||||||
| T1 (<40 mg/dL) | 1.77 (1.39–2.25) | <0.001 | 1.74 (1.33–2.27) | <0.001 | 1.77 (1.35–2.33) | <0.001 |
| T2 (40–51 mg/dL) | 1.43 (1.12–1.83) | 0.004 | 1.39 (1.08–1.79) | 0.01 | 1.40 (1.08–1.83) | 0.01 |
| T3 (>51 mg/dL) | 1.00 (reference) | 1.00 (reference) | 1.00 (reference) | |||
| Apolipoprotein AI | ||||||
| T1 (<123 mg/dL) | 1.78 (1.41–2.25) | <0.001 | 1.72 (1.33–2.22) | <0.001 | 1.77 (1.36–2.32) | <0.001 |
| T2 (123–144 mg/dL) | 1.36 (1.07–1.74) | 0.01 | 1.33 (1.03–1.72) | 0.03 | 1.77 (1.02–1.74) | 0.03 |
| T3 (>144 mg/dL) | 1.00 (reference) | 1.00 (reference) | 1.00 (reference) | |||
Note: Conversion factor for cholesterol from mg/dL to mmol/L, ×0.0259.
Abbreviations: CI, confidence interval; CRIC, Chronic Renal Insufficiency Cohort; HDL-C, high-density lipoprotein cholesterol; HR, hazard ratio; LDL-C, low-density lipoprotein cholesterol; non—HDL-C, non high-density lipoprotein cholesterol; T, tertile; VLDL-C, very low-density lipoprotein cholesterol.
Model 1: unadjusted.
Model 2: adjusted for age, sex, race/ethnicity, clinical site, smoking, diabetes mellitus, body mass index, systolic blood pressure, and statin use.
Model 3: adjusted for age, sex, race/ethnicity, clinical site, smoking, diabetes mellitus, body mass index, systolic blood pressure, statin use, estimated glomerular filtration rate, and 24-hour urine protein excretion.
When the multivariable-adjusted model was repeated using continuous measures for each lipid or apolipopro-tein level (Table 3), significant associations were seen per 1-SD change in triglyceride, HDL-C, and Apo-AI levels. Using adjusted restricted cubic splines, nonlinear associations with the outcome were detected for HDL-C and Apo-AI levels (Fig 2). All remaining lipid parameters displayed largely linear associations with the outcome (Fig S3).
Table 3.
Association Between Baseline Lipid and Apolipoprotein Levels and Atherosclerotic Cardiovascular Disease
| HR (95% CI) | P | |
|---|---|---|
| Total cholesterol, per 1 SD greater | 1.0S (0.92–1.14) | 0.6 |
| Non—HDL-C, per 1 SD lower | 1.09 (0.99–1.21) | 0.07 |
| VLDL-C,a per 1 SD greater | 1.09 (0.99–1.21) | 0.07 |
| Triglycerides,a per 1 SD greater | 1.14 (1.0S-1.25) | 0.01 |
| LDL-C, per 1 SD greater | 1.05 (0.94–1.16) | 0.4 |
| Apolipoprotein B, per 1 SD greater | 1.09 (0.99–1.21) | 0.08 |
| HDL-C, per 1 SD greater | 1.28 (1.09–1.59) | 0.002 |
| Apolipoprotein AI, per 1 SD lower | 1.25 (1.07–1.45) | 0.004 |
Note: Model adjusted for age, sex, race/ethnicity, clinical site, smoking, diabetes mellitus, body mass index, systolic blood pressure, statin use, estimated glomerular filtration rate, and 24-hour urine protein excretion.
Abbreviations: CI, confidence interval; HDL-C, high-density lipoprotein cholesterol; HR, hazard ratio; LDL-C, low-density lipoprotein cholesterol; non—HDL-C, non lowdensity lipoprotein cholesterol.
Values were natural-log transformed.
Figure 2.

Adjusted restricted cubic splines analysis for the associations between high-density lipoprotein cholesterol (HDL-C) and apolipoprotein AI with atherosclerotic cardiovascular disease (ASCVD). Model adjusted for age, sex, race/ethnicity, clinical site, smoking, diabetes mellitus, body mass index, systolic blood pressure, statin use, estimated glomerular filtration rate, and 24-hour urine protein excretion. Dashed lines represent 95% confidence intervals. Conversion factor for cholesterol from mg/dL to mmol/L, ×0.0259.
The final model for each lipid and apolipoprotein was further adjusted for lipid and apolipoprotein levels not in high correlation with the one being tested (Table S4). The second tertile of Apo-B remained significantly associated with the outcome after further adjusting for VLDL-C, triglyceride, HDL-C, and Apo-AI levels (HR, 1.28; 95% CI, 1.01–1.63). HRs for the lowest tertiles of HDL-C and Apo-AI remained significant after additionally adjusting for total cholesterol, VLDL-C, triglyceride, LDL-C, and Apo-B levels (HRs of 1.61 [95% CI, 1.10–2.36] and 1.65 [95% CI, 1.21–2.24], respectively).
To explore for potential modifying effects between lipid or apolipoprotein levels, interaction terms with the other lipoprotein measures were included one at a time into the final models for HDL-C, VLDL-C, and triglyceride levels. There were significant interactions for HDL-C level with total cholesterol (P for interaction = 0.004), non—HDL-C (P = 0.01), LDL-C (P = 0.02), and Apo-B (P = 0.04) levels. HRs for ASCVD risk for the lower tertiles of HDL-C were generally higher for lower levels of each of these other lipoprotein measures (Table S5). There were no significant interactions between any of the lipids or apolipoproteins on the association between VLDL-C level and the outcome (P for all interaction terms > 0.05). HDL-C level was the only significant effect modifier on the association between triglyceride levels and the outcome (P = 0.04).
Baseline eGFR was a significant effect modifier on associations between non—HDL-C and HDL-C levels with ASCVD using the final model (Fig 3; Table S6). Proteinuria was a significant effect modifier only for the association between HDL-C level with ASCVD risk (P for interaction = 0.04; Fig S4). The magnitude of the association between low HDL-C level and ASCVD risk was higher for participants without proteinuria (HRs of 2.01 [95% CI, 1.32–3.08] for the middle tertile and 1.79 [95% CI, 1.12–2.87] for the lowest tertile) compared with those with proteinuria at baseline (HR of 1.64 [95% CI, 1.16–2.30] for the lowest tertile). Statin use was not a significant effect modifier on the association between any of the lipid levels and ASCVD risk (P for all interaction terms > 0.05; Fig S5).
Figure 3.
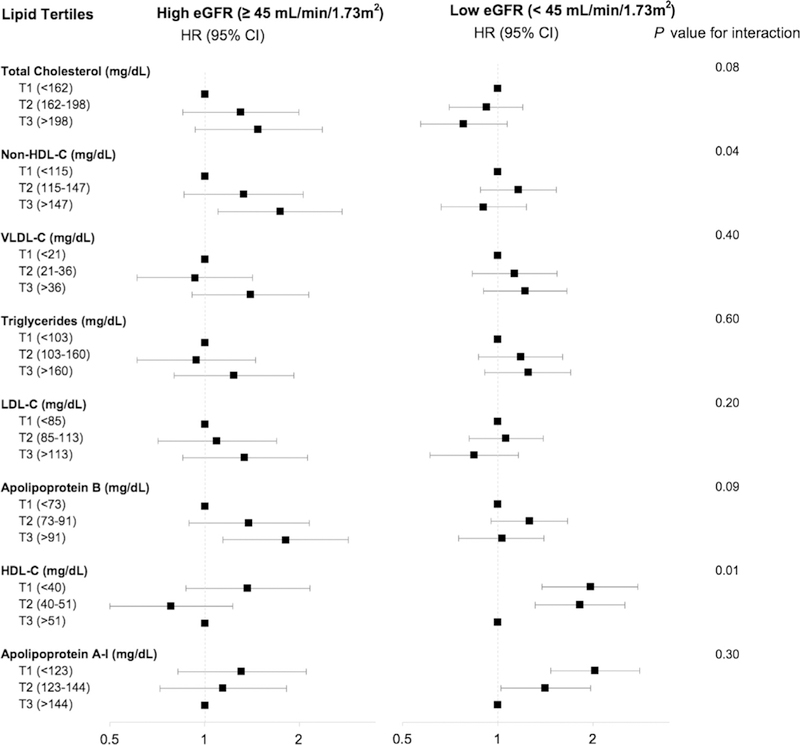
Effect modification by baseline estimated glomerular filtration rate (eGFR) on the associations between lipid and apolipoprotein levels and atherosclerotic cardiovascular disease. Model adjusted for age, sex, race/ethnicity, clinical site, smoking, diabetes mellitus, body mass index, systolic blood pressure, statin use, and 24-hour urine protein excretion. Abbreviations: CI, confidence interval; HDL-C, high-density lipoprotein cholesterol; HR, hazard ratio; LDL-C, low-density lipoprotein cholesterol; non—HDL-C, non high-density lipoprotein cholesterol; VLDL-C, very low-density lipoprotein cholesterol. Conversion factor for cholesterol from mg/dL to mmol/L, ×0.0259.
After excluding 1,060 participants with a history of ASCVD at baseline, associations that were significant in the full cohort generally increased in magnitude. The HR was 1.50 (95% CI, 1.05–2.15; P = 0.03) for the highest tertile of VLDL-C, 1.53 (95% CI, 1.08–2.19; P = 0.02) for the middle tertile of Apo-B, 2.20 (95% CI, 1.49–3.26; P < 0.001) for the lowest tertile of HDL-C, 1.69 (95% CI, 1.15–2.50; P = 0.01) for the middle tertile of Apo-AI, and 95% CI, 1.63–3.61; P < 0.001) for the lowest tertile of Apo-AI. Additionally, the middle and highest tertiles of non—HDL-C were significantly and borderline associated, respectively, with incident ASCVD (HRs of 1.53 [95% CI, 1.06–2.20; P = 0.02] and 1.44 [95% CI, 0.99–2.10; P = 0.05]), respectively).
Discussion
This study describes associations between baseline lipid and apolipoprotein levels with clinically significant ASCVD in a large diverse cohort of adults with non—dialysis-dependent CKD. Unlike in the general population, there was no association between LDL-C level and ASCVD risk in the CRIC population. Instead, higher VLDL-C and Apo-B levels, as well as lower HDL-C and Apo-AI levels, were significantly associated with increased ASCVD risk. These results suggest mechanisms beyond the LDL-C pathway in modulating atherosclerotic risk in CKD, particularly pathways involving HDL-C or triglyceride-rich lipoproteins (TRLs) like VLDL-C.
Prior studies12–15 evaluating dyslipidemia in CKD are limited and report mixed results. A 2005 study12 of participants with CKD from the Cardiovascular Health Study failed to find an association between HDL-C, LDL-C, or triglyceride levels with cardiovascular disease mortality. Similarly, a 2007 study13 of male veterans with CKD did not show an association between total cholesterol, LDL-C, triglyceride, or HDL-C levels with all-cause and cardiovascular mortality in the fully adjusted model. In a 2010 study14 of participants with CKD in the Modification of Diet in Renal Disease (MDRD) Study, no association with all-cause or cardiovascular disease mortality was found with total cholesterol, non—HDL-C, triglyceride, or HDL-C levels.
More similar to our study, a 2014 study15 of participants with CKD (n = 1,217) from the Atherosclerosis Risk in Communities (ARIC) Study showed increased coronary heart disease risk per 1-SD increase in non—HDL-C (HR, 1.19; 95% CI, 1.01–1.40), non—HDL-C:HDL-C ratio (HR, 1.30; 95% CI, 1.07–1.57), and Apo-B:Apo-AI ratio (HR, 1.22; 95% CI, 1.02–1.46). As in our study, there was no significant association between LDL-C level and the outcome. In a 2018 study using principal component analysis of participants with CKD (n = 577) from the Multi-Ethnic Study of Atherosclerosis (MESA) cohort, the authors determined that a phenotype of elevated values for triglycerides, VLDL, small LDL particles, and reductions in HDL particles was strongly associated with coronary heart disease.23 Results from ARIC and MESA are enhanced by our findings in CRIC, a substantially larger and more diverse cohort that is specific for non—dialysis-dependent CKD. Forty percent of the CRIC population was African American, compared to 15% in ARIC and 26% in MESA. The MESA population largely represents an older age group, with an average age of 74 years compared to 58 years for the CRIC population. Further, our results are independent of baseline eGFR and urine protein, which these prior studies did not adjust for. Our study additionally included important exploration of possible effect modification by several key factors.
Triglyceride levels are elevated in the setting of reduced kidney function.7 About 33% of CRIC participants had a triglyceride level > 160mg/dL, while only 25% of the general adult population in the United States has levels ≥150 mg/dL.24 Even though the higher triglyceride tertiles were not significantly associated with ASCVD using the fully adjusted model (although the association was significant before adjusting for eGFR and urine protein), there was a significant 26% higher risk per 1-SD increase in the log-transformed continuous form of the variable. Elevated triglyceride levels may correlate to high levels of cholesterol in TRLs.25 TRLs are a subset of the Apo-B—containing lipoproteins and include VLDL-C, intermediate-density lipoprotein cholesterol, and chylomicrons. In the non—CKD setting, large epidemiologic studies and meta-analyses have concluded that TRLs are associated with a direct increase in ASCVD risk independent of other lipid measures.25 Several molecular mechanisms may explain the observed increase in TRLs in CKD, including reduced lipoprotein lipase enzyme activity and increased Apo-CIII concentrations.26 The increased ASCVD risk with high VLDL-C and non—HDL-C levels in this study could implicate TRLs in the residual risk for atherosclerosis in CKD. In a 2016 study from Japan27 of 365 patients with CKD with type 2 diabetes mellitus, study authors measured remnant-like lipoprotein particle cholesterol, which consists of products of metabolized TRLs. Patients with remnant-like lipoprotein particle cholesterol levels above the median (4.3 mg/dL) had a significant 30% increased risk for a major cardiovascular event. Future studies are needed to evaluate the impact of TRLs and their circulating remnants on disease outcomes in a more heterogeneous population to better define the nature of the relationship between these lipid fractions and atherosclerotic disease in CKD.
The highest risk for ASCVD outcomes was seen in CRIC participants in the lower 2 tertiles of HDL-C and Apo-AI. These associations were independent of total cholesterol, VLDL-C, triglyceride, LDL-C, and Apo-B levels. Further, our results suggest that low HDL-C level is a stronger predictor of risk when Apo-B—containing lipoprotein levels are lower. Recent studies have brought to light the limitations of using HDL-C level as a causal mediator of ASCVD risk.28–30 Attempts to affect cardiovascular outcomes by pharmacologic altering of HDL-C levels have been unsuccessful.31–33 In a post hoc analysis of the AIM-HIGH trial,34 participants with CKD treated with niacin showed a significant increase in HDL-C levels, but without improvement in cardiovascular outcomes. Nonetheless, the substantial increase in independent ASCVD risk observed with low HDL-C and Apo-AI levels in the CRIC population suggests an important role of HDL-C—mediated pathways in identifying patients with CKD at risk. Reduced kidney function is associated with defective maturation of HDL particles, impaired Apo-AI—mediated cholesterol efflux, and limited reverse cholesterol transport.26 Further, HDL modulates inflammatory pathways, but the combined effect of increased inflammation as marked by elevated concentrations of factors such as high-sensitivity C-reactive protein and fibroblast growth factor 23, compounded by the presence of defective HDL in CKD, may contribute to increased atherosclerosis.7 It is also very likely that low HDL-C and Apo-AI levels are markers of an increase in the highly atherogenic TRLs.35
In secondary analyses, stratifying by baseline eGFR revealed significant effect modification on the association for HDL-C level with ASCVD risk; the lower 2 tertiles were significantly associated with increased risk in those with lower eGFRs (n=2,081), but not those with higher eGFRs (n= 1,730). Although eGFR was not a significant effect modifier for total cholesterol and LDL-C levels, the associations with ASCVD in those with more preserved eGFRs trended in the direction found in the general population, specifically, toward increased risk for higher levels of both measures. In contrast, in those with reduced eGFRs, HRs for the highest tertiles of total cholesterol and LDL-C, while again not significant, were < 1. Similarly, the highest tertile of Apo-B was significantly associated with 81% increased ASCVD risk in those with more preserved eGFRs, while in the group with lower eGFRs, high Apo-B level was not associated with the outcome. Prior studies have suggested that reduced kidney function promotes the formation of small dense LDL particles,36–38 which would not be characterized by measurement of LDL-C and are proathero-genic.39–41 Our results suggest that Apo-B, a marker of the number of proatherogenic particles (including LDL-C) that is independent of particle size is associated with ASCVD risk in earlier, but not later, stages of CKD. This could imply that LDL and other Apo-B—containing lipoproteins play a role in atherosclerosis development during earlier stages ofreduced kidney function. A recent meta-analysis of 28 trials by the Cholesterol Treatment Trialists’ Collaboration showed a trend toward smaller relative risk reductions in ASCVD events for a given absolute reduction in LDL-C levels in patients with more advanced CKD.42 This is also suggested by studies that have shown greater effectiveness of statins in early stages of CKD, compared to little or no effect in reducing ASCVD outcomes in dialysis patients.43,44
Proteinuria was a modifier on only the association between HDL-C level and ASCVD outcomes. Both the group with (n=1,951) and the group without (n=1,675) proteinuria had increased risk for ASCVD for lower HDL-C levels, but the effect size was higher for those without proteinuria. Studies have shown that alterations in lipid metabolism correlate with the magnitude of proteinuria and that nephrotic-range proteinuria (protein excretion > 3.5 g/d) is marked by elevated levels of total cholesterol, Apo-B—containing lipoproteins, and triglycerides, as well as an increase in immature HDL particles and reduced cholesterol efflux.45 Only 493 CRIC participants had nephrotic-range proteinuria; it would be of interest to explore associations between lipoprotein measures and ASCVD in larger cohorts ofpatients with nephrotic syndrome.
This study has several strengths. The CRIC Study cohort is racially and ethnically diverse with a range of eGFRs at baseline, increasing the generalizability of our findings to a larger CKD population compared with previous studies. There was low participant dropout (<2% per year) and a long follow-up period. Given the detailed collection of baseline covariate information, it was possible to perform robust multivariate analyses and subgroup analyses. The analyses also included a wide array of commonly measured lipid parameters that allows us to hypothesize the role of the different lipids and apolipoproteins in the pathogenesis of atherosclerosis in kidney disease. Extensive sensitivity analyses were performed, with the lipid parameters as continuous variables and modeled using restricted cubic splines, all contributing to the robustness of results. Notably, results in our study were independent of baseline eGFR.
Results from this study should be interpreted in the context of some limitations. It is possible that some findings may be due to chance given the multiple comparisons performed in the analyses. Further, the results are observed associations and do not imply causality. Analyses of longitudinal changes in lipid levels may offer insight into the consequences of lipid changes with eGFR decline on risk for atherosclerotic disease development. It would also be of interest for future work to include advanced lipoprofile testing, which has not been performed in the CRIC population to date. Assessing changes in lipoprotein particle features in CKD may shed light on the process of atherosclerosis in this population.
In summary, in this cohort of persons with CKD, higher VLDL-C and Apo-B levels, as well as lower HDL-C and Apo-AI levels, are associated with increased risk for ASCVD. These results suggest a role for TRLs and HDL-C—mediated pathways as a driver of atherosclerotic risk in this population that is stronger for those in later stages of CKD. Future studies further evaluating these associations and the use of therapy directed at TRLs46 and lipid targets other than LDL-C level in persons with CKD are warranted.
Supplementary Material
Acknowledgments
Support: Funding for the CRIC Study was obtained under a cooperative agreement from the National Institute of Diabetes and Digestive and Kidney Diseases (NIDDK; U01DK060990, U01DK060984, U01DK061022, U01DK061021, U01DK061028, U01DK060980, U01DK060963, and U01DK060902). In addition, this work was supported in part by the Perelman School of Medicine at the University of Pennsylvania Clinical and Translational Science Award National Institutes of Health (NIH)/ National Center for Advancing Translational Sciences (NCATS) UL1TR000003, Johns Hopkins University UL1 TR-000424, University of Maryland General Clinical Research Center M01 RR-16500, Clinical and Translational Science Collaborative of Cleveland, UL1TR000439 from the NCATS component of the NIH and NIH roadmap for Medical Research, Michigan Institute for Clinical and Health Research (MICHR) UL1TR000433, University of Illinois at Chicago Clinical and Translational Science Awards UL1RR029879, Tulane Centers of Biomedical Research Excellence for Clinical and Translational Research in Cardiometabolic Diseases P20 GM109036, Kaiser Permanente NIH/National Center for Research Resources UCSF-CTSI UL1 RR-024131. Funding sources for the CRIC Study did not have any role in study design; collection, analysis, and interpretation of data; writing the manuscript; or the decision to submit the manuscript for publication.
Footnotes
Financial Disclosure: Dr Feldman reports grants from NIH-NIDDK during the conduct of the study, and other funding from GlaxoSmithKline and Kyowa Hakko Kirin Co, Ltd. Dr Go reports grants from NIDDK during the conduct of the study and grants from AstraZeneca outside this work. Dr Rahman reports grants from NIH during the conduct of the study. Dr Weir reports personal fees from Relypsa, personal fees from ZS Pharma, during the conduct of the study; personal fees from Akebia, Janssen, Astra-Zeneca, Otsuka, Amgen, MSD, AbbVie, Novartis, and Boston Sandoz, outside the submitted work.
Peer Review: Received June 1, 2018. Evaluated by 3 external peer reviewers and a statistician, with editorial input from an Acting Editor-in-Chief (Editorial Board Member Emmanuel A. Burdmann, MD, PhD). Accepted in revised form November 26, 2018. The involvement of an Acting Editor-in-Chief to handle the peer-review and decision-making processes was to comply with AJKDs procedures for potential conflicts of interest for editors, described in the Information for Authors & Journal Policies.
References
- 1.Saran R, Robinson B, Abbott KC, et al. US Renal Data System 2016 Annual Data Report: epidemiology of kidney disease in the United States. Am J Kidney Dis. 2017;69(3)(suppl 1):A7–A8. [DOI] [PMC free article] [PubMed] [Google Scholar]
- 2.Go AS, Chertow GM, Fan D, McCulloch CE, Hsu C-Y. Chronic kidney disease and the risks of death, cardiovascular events, and hospitalization. N Engl J Med. 2004;351(13):1296–1305. [DOI] [PubMed] [Google Scholar]
- 3.Foley RN. Chronic kidney disease and the risk for cardiovascular disease, renal replacement, and death in the United States Medicare population, 1998 to 1999. J Am Soc Nephrol. 2005;16(2):489–495. [DOI] [PubMed] [Google Scholar]
- 4.Reiss AB, Voloshyna I, De Leon J, Miyawaki N, Mattana J. Cholesterol metabolism in CKD. Am J Kidney Dis. 2015;66(6): 1071–1082. [DOI] [PMC free article] [PubMed] [Google Scholar]
- 5.Florens N, Calzada C, Lyasko E, Juillard L, Soulage CO. Modified lipids and lipoproteins in chronic kidney disease: a new class of uremic toxins. Toxins (Basel). 2016;8(12):E376. [DOI] [PMC free article] [PubMed] [Google Scholar]
- 6.Vaziri ND. Disorders of lipid metabolism in nephrotic syndrome: mechanisms and consequences. Kidney Int. 2016;90(1):41–52. [DOI] [PMC free article] [PubMed] [Google Scholar]
- 7.Keane WF, Tomassini JE, Neff DR. Lipid abnormalities in patients with chronic kidney disease: implications for the pathophysiology of atherosclerosis. J Atheroscler Thromb. 2013;20(2):123–133. [DOI] [PubMed] [Google Scholar]
- 8.US Preventive Services Task Force; Bibbins-Domingo K, Grossman DC, Curry SJ, et al. Statin use for the primary prevention of cardiovascular disease in adults: US Preventive Services Task Force Recommendation Statement. JAMA. 2016;316(19):1997–200. [DOI] [PubMed] [Google Scholar]
- 9.Wanner C, Tonelli M; Kidney Disease: Improving Global Outcomes Lipid Guideline Development Work Group Members. KDIGO clinical practice guideline for lipid management in CKD: summary of recommendation statements and clinical approach to the patient. Kidney Int. 2014;85(6):1303–1309. [DOI] [PubMed] [Google Scholar]
- 10.Baigent C, Landray MJ, Reith C, et al. The effects of lowering LDL cholesterol with simvastatin plus ezetimibe in patients with chronic kidney disease (Study of Heart and Renal Protection): a randomised placebo-controlled trial. Lancet. 2011;377(9784): 2181–2192. [DOI] [PMC free article] [PubMed] [Google Scholar]
- 11.Messow CM, Isles C. Meta-analysis of statins in chronic kidney disease: who benefits? QJM. 2017;110:493–500. [DOI] [PubMed] [Google Scholar]
- 12.Shlipak MG, Fried LF, Cushman M, Manolio TA. Cardiovascular mortality risk in chronic kidney disease: comparison of traditional and novel risk factors. JAMA. 2005;293:1737–1745. [DOI] [PubMed] [Google Scholar]
- 13.Kovesdy CP, Anderson JE, Kalantar-Zadeh K. Inverse association between lipid levels and mortality in men with chronic kidney disease who are not yet on dialysis: effects of case mix and the malnutrition-inflammation-cachexia syndrome. J Am Soc Nephrol. 2007;18(1):304–311. [DOI] [PubMed] [Google Scholar]
- 14.Chawla V, Greene T, Beck GJ, et al. Hyperlipidemia and longterm outcomes in nondiabetic chronic kidney disease. Clin J Am Soc Nephrol. 2010;5(9):1582–158. [DOI] [PMC free article] [PubMed] [Google Scholar]
- 15.Lamprea-Montealegre JA, Sharrett AR, Matsushita K, Selvin E, Szklo M, Astor BC. Chronic kidney disease, lipids and apoli-poproteins, and coronary heart disease: the ARIC study. Atherosclerosis. 2014;234(1):42–46. [DOI] [PubMed] [Google Scholar]
- 16.Feldman HI, Appel LJ, Chertow GM. The Chronic Renal Insufficiency Cohort (CRIC) study: design and methods. J Am Soc Nephrol. 2003;14(suppl 14):S148–S153. [DOI] [PubMed] [Google Scholar]
- 17.Lash JP, Go AS, Appel LJ, et al. Chronic Renal Insufficiency Cohort (CRIC) Study: baseline characteristics and associations with kidney function. Clin J Am Soc Nephrol. 2009;4(8): 1302–1311. [DOI] [PMC free article] [PubMed] [Google Scholar]
- 18.Denker M, Boyle S, Anderson AH, Appel LJ. Chronic Renal Insufficiency Cohort Study (CRIC): overview and summary of selected findings. Clin J Am Soc Nephrol. 2015;10:2073–2083. [DOI] [PMC free article] [PubMed] [Google Scholar]
- 19.Fischer MJ, Go AS, Lora CM, et al. CKD in Hispanics: baseline characteristics from the CRIC (Chronic Renal Insufficiency Cohort) and Hispanic-CRIC Studies. Am J Kidney Dis. 2011;58(2):214–22. [DOI] [PMC free article] [PubMed] [Google Scholar]
- 20.Anderson AH, Yang W, Hsu C-Y, et al. Estimating GFR among participants in the Chronic Renal Insufficiency Cohort (CRIC) Study. Am J Kidney Dis. 2012;60(2):250–261. [DOI] [PMC free article] [PubMed] [Google Scholar]
- 21.Mozaffarian D, Benjamin EJ, Go AS, et al. Heart disease and stroke statistics-2015 update: a report from the American Heart Association. Circulation. 2015;131(4):e29–e322. [DOI] [PubMed] [Google Scholar]
- 22.Sandsmark DK, Messé SR, Zhang X, et al. Proteinuria, but not eGFR, predicts stroke risk in chronic kidney disease: Chronic Renal Insufficiency Cohort Study. Stroke. 2015;46(8):2075–2080. [DOI] [PMC free article] [PubMed] [Google Scholar]
- 23.Lamprea-Montealegre JA, McClelland RL, Grams M, Ouyang P, Szklo M, de Boer IH. Coronary heart disease risk associated with the dyslipidaemia of chronic kidney disease. Heart. 2018;104(17):1455–1460. [DOI] [PubMed] [Google Scholar]
- 24.Carroll M, Kit B, Lacher D. Trends in elevated triglyceride in adults: United States, 2001–2012, NCHS data brief, no 198. Hyattsville, MD: National Center for Health Statistics; 2015. [PubMed] [Google Scholar]
- 25.Nordestgaard BG. Triglyceride-rich lipoproteins and atherosclerotic cardiovascular disease: new insights from epidemiology, genetics, and biology. Circ Res. 2016;118(4):547–563. [DOI] [PubMed] [Google Scholar]
- 26.Moradi H,Vaziri ND. Molecular mechanisms of disorders of lipid metabolism in chronic kidney disease. Front Biosci. 2018;23: 146–161. [DOI] [PubMed] [Google Scholar]
- 27.Nguyen SV, Nakamura T, Uematsu M, et al. Remnant lip-oproteinemia predicts cardiovascular events in patients with type 2 diabetes and chronic kidney disease. J Cardiol. 2017;69(3):529–535. [DOI] [PubMed] [Google Scholar]
- 28.Kingwell BA, Chapman MJ, Kontush A, Miller NE. HDL-targeted therapies: progress, failures and future. Nat Rev Drug Discov. 2014;13(6):445–464. [DOI] [PubMed] [Google Scholar]
- 29.Zanoni P, Khetarpal SA, Larach DB, et al. Rare variant in scavenger receptor BI raises HDL cholesterol and increases risk of coronary heart disease. Science. 2016;351(6278):1166–1171. [DOI] [PMC free article] [PubMed] [Google Scholar]
- 30.Rosenson RS. The high-density lipoprotein puzzle: why classic epidemiology, genetic epidemiology, and clinical trials conflict? Arterioscler Thromb Vasc Biol. 2016;36(5):777–782. [DOI] [PubMed] [Google Scholar]
- 31.Barter PJ, Caulfield M, Eriksson M, et al. Effects of torcetrapib in patients at high risk for coronary events. N Engl J Med. 2007;357(21):2109–2122. [DOI] [PubMed] [Google Scholar]
- 32.Schwartz GG, Olsson AG, Abt M, et al. Effects of dalcetrapib in patients with a recent acute coronary syndrome. N Engl J Med. 2012;367(22):2089–2099. [DOI] [PubMed] [Google Scholar]
- 33.Lincoff AM, Nicholls SJ, Riesmeyer JS, et al. Evacetrapib and cardiovascular outcomes in high-risk vascular disease. N Engl J Med. 2017;376(20):1933–1942. [DOI] [PubMed] [Google Scholar]
- 34.Kalil RS, Wang JH, de Boer IH, et al. Effect of extended-release niacin on cardiovascular events and kidney function in chronic kidney disease: a post hoc analysis of the AIM-HIGH trial. Kidney Int. 2015;87(6):1250–125. [DOI] [PMC free article] [PubMed] [Google Scholar]
- 35.Chapman MJ, Ginsberg HN, Amarenco P, et al. Triglyceride-rich lipoproteins and high-density lipoprotein cholesterol in patients at high risk of cardiovascular disease: evidence and guidance for management. Eur Heart J. 2011;32(11):1345–1361. [DOI] [PMC free article] [PubMed] [Google Scholar]
- 36.Chu M, Wang AY, Chan IH, Chui SH, Lam CW. Serum small-dense LDL abnormalities in chronic renal disease patients. Br J Biomed Sci. 2012;69(3):99–102. [PubMed] [Google Scholar]
- 37.Deighan CJ, Caslake MJ, McConnell M, Boulton-Jones JM, Packard CJ. The atherogenic lipoprotein phenotype: small dense LDL and lipoprotein remnants in nephrotic range proteinuria. Atherosclerosis. 2001;157(1):211–220. [DOI] [PubMed] [Google Scholar]
- 38.Bowden RG, Wilson RL, Beaujean AA. LDL particle size and number compared with LDL cholesterol and risk categorization in end-stage renal disease patients. J Nephrol. 2011;24(6):771–77. [DOI] [PMC free article] [PubMed] [Google Scholar]
- 39.St-Pierre AC, Cantin B, Dagenais GR, et al. Low-density lipoprotein subfractions and the long-term risk of ischemic heart disease in men: 13-year follow-up data from the Québec Cardiovascular Study. Arterioscler Thromb Vasc Biol. 2005;25(3):553–559. [DOI] [PubMed] [Google Scholar]
- 40.Williams PT, Zhao X-Q, Marcovina SM, Brown BG, Krauss RM. Levels of cholesterol in small LDL particles predict atherosclerosis progression and incident CHD in the HDL-Atherosclerosis Treatment Study (HATS). PLoS One. 2013;8(2):e56782. [DOI] [PMC free article] [PubMed] [Google Scholar]
- 41.Hoogeveen RC, Gaubatz JW, Sun W. Small dense low-density lipoprotein-cholesterol concentrations predict risk for coronary heart disease. Arterioscler Thromb Vasc Biol. 2014;34:1069–107. [DOI] [PMC free article] [PubMed] [Google Scholar]
- 42.Cholesterol Treatment Trialists’ Collaboration. Impact of renal function on the effects of LDL cholesterol lowering with statin-based regimens: a meta-analysis of individual participant data from 28 randomised trials. Lancet Diabetes Endocrinol. 2016;4(10):829–839. [DOI] [PubMed] [Google Scholar]
- 43.Palmer SC, Navaneethan SD, Craig JC, et al. HMG CoA reductase inhibitors (statins) for people with chronic kidney disease not requiring dialysis. Cochrane Database Syst Rev. 2014;5:CD007784. [DOI] [PubMed] [Google Scholar]
- 44.Palmer SC, Navaneethan SD, Craig JC, et al. HMG CoA reductase inhibitors (statins) for dialysis patients. ed. Cochrane Database Syst Rev. 2013;9:CD004289. [DOI] [PMC free article] [PubMed] [Google Scholar]
- 45.Agrawal S, Zaritsky JJ, Fornoni A, Smoyer WE. Dyslipidaemia in nephrotic syndrome: mechanisms and treatment. Nat Rev Nephrol. 2018;14(1):57–70. [DOI] [PMC free article] [PubMed] [Google Scholar]
- 46.Pechlaner R, Tsimikas S, Yin X, et al. Very-low-density lipoprotein-associated apolipoproteins predict cardiovascular events and are lowered by inhibition of APOC-III. J Am Coll Cardiol. 2017;69(7):789–800. [DOI] [PMC free article] [PubMed] [Google Scholar]
Associated Data
This section collects any data citations, data availability statements, or supplementary materials included in this article.