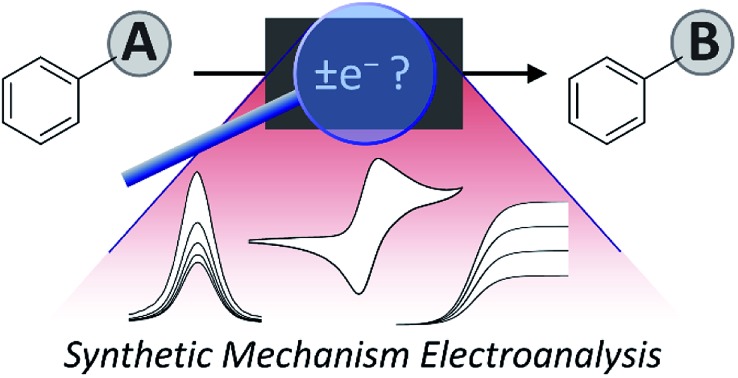
 A range of electroanalytical tools can be applied to studying redox reactions, probing key mechanistic questions in synthetic chemistry.
Abstract
Monitoring reactive intermediates can provide vital information in the study of synthetic reaction mechanisms, enabling the design of new catalysts and methods. Many synthetic transformations are centred on the alteration of oxidation states, but these redox processes frequently pass through intermediates with short life-times, making their study challenging. A variety of electroanalytical tools can be utilised to investigate these redox-active intermediates: from voltammetry to in situ spectroelectrochemistry and scanning electrochemical microscopy. This perspective provides an overview of these tools, with examples of both electrochemically-initiated processes and monitoring redox-active intermediates formed chemically in solution. The article is designed to introduce synthetic organic and organometallic chemists to electroanalytical techniques and their use in probing key mechanistic questions.
1. Introduction
The manipulation of oxidation states in organic molecules is pivotal to the conversion of functional groups and the synthesis of new structural motifs. Furthermore, the ability to access various oxidation states of organometallic complexes enables catalysis to construct new bonds. Thus, the addition or removal of an electron (or electrons) from an organic or organometallic molecule is frequently a key step in such processes. However, the charged or radical species formed by an electron-transfer reaction is often highly reactive and has a short half-life in solution,1 which makes these intermediates difficult to study and characterise.
In recent years, the expansion of photoredox2 and electrochemical3 organic reaction methodologies has led to an impressive growth in synthetic processes involving electron transfer. This proliferation is in part due to the ability to tune the thermodynamics and/or kinetics of the electron transfer – chemoselectively forming reactive intermediates via careful manipulation of oxidation states of specific functional groups at rates commensurate with keeping radicals at low concentrations. The ability to understand how to fine-tune the reactivity and concentration is clearly related to knowledge of the feasibility and kinetics of the electron-transfer event. The development and application of techniques to interrogate such phenomena is at the heart of achieving high yields and selectivities in redox driven transformations.
As such, electroanalytical methods provide wide-ranging opportunities to gain knowledge of fundamental interactions, lifetimes, and reactivities underpinning redox processes.4 However, these tools have not been widely adopted by the organic synthetic community, generally remaining as methods in the domain of physical and analytical chemists. This perspective aims to summarise the key techniques for an audience of synthetic chemists, suggesting methods to obtain valuable answers to mechanistic questions. Information summarised herein will exemplify electrochemistry as a tool to identify speciation, equilibria and binding, oxidation states of metals, catalytic turnover, and kinetics. Knowledge of how these factors affect a mechanism will allow greater understanding of organic and organometallic processes, and aid in the development of new synthetic methodologies.
The case studies selected throughout this review are aimed at highlighting singular modern mechanistic studies for each technique. We would encourage the interested reader to access more detailed reviews on each method referenced throughout and summarised in the conclusion for a thorough theoretical and mathematical background to the experiment. Additionally, the reader should note that this review is not designed as a hands-on guide to the techniques and will not discuss experimental details set-up, rather concentrating on the mechanistic information garnered by various methods.
2. Cyclic voltammetry
2.1. Introduction, reduction potentials and diagnostic analysis
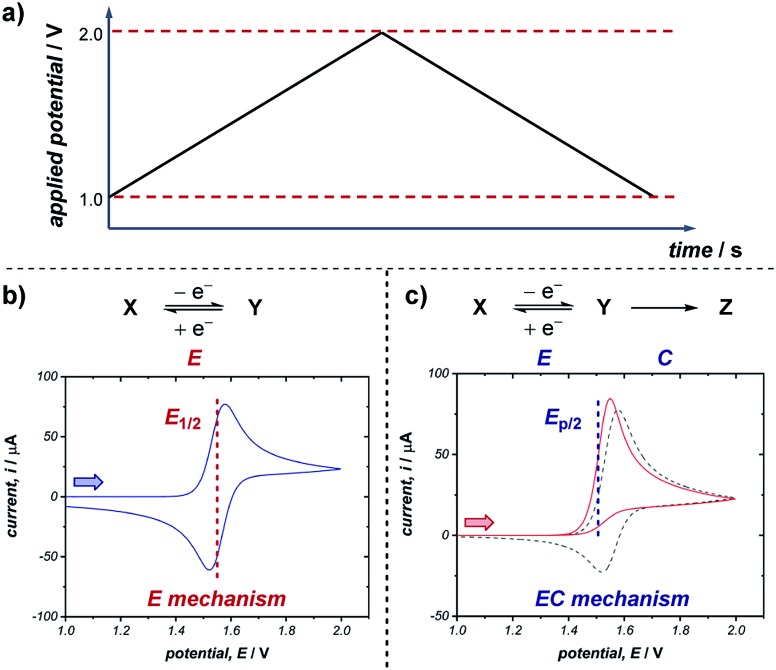
A commonly applied electroanalytical tool is cyclic voltammetry (CV).5 Cyclic voltammetry uses a triangular potential waveform (Fig. 1a) – initially the potential is scanned linearly over time, resulting in a chemical species undergoing oxidation or reduction at the electrode surface when the potential reach a sufficiently negative/positive potential, yielding an electrical current. This current is measured during the potential scan to quantify the amount of a chemical species which is undergoing a redox process per unit time. For an oxidation reaction, as the electrode potential is scanned in a positive direction, oxidation of the redox-active species occurs at the electrode surface, resulting in the observation of an oxidative (or anodic) current starting at the onset potential of the redox event (where the background-subtracted current becomes non-zero). As the potential continues to rise through the half-wave potential (E1/2) of the redox-active species, oxidation becomes more thermodynamically favourable and the current continues to increase, until the oxidation process eventually becomes limited by diffusion of species to the electrode surface, resulting in a diffusional tail characterised by a drop in the current (Fig. 1b). The potential sweep of the electrode is then reversed and scanned in the opposite direction until the initial potential is reached. For a chemically reversible electron-transfer process (denoted an E mechanism), the reduction of the electrochemically generated species results in a cathodic (reductive) current, leading to the voltammogram displayed in Fig. 1b. By varying the rate at which the potential is scanned (ν, the scan rate) and monitoring the differences in the current response, valuable kinetic parameters can be obtained (see below for more detail).
Fig. 1. (a) Example of a triangular potential waveform applied in the generation of a cyclic voltammogram. Representative CV responses for (b) a chemically reversible electron transfer (E mechanism), and (c) a chemically irreversible electron transfer in which the redox event is followed by a chemical reaction (EC mechanism). Two lines in (c) represent different rates of the following chemical reaction, where the dashed grey line has a rate constant of 0.1 s–1 and the solid red line a rate constant of 10 s–1 (with Ep/2 labelled for the latter). Arrows in figures demonstrate the direction of the scan, positive current represents oxidation.
For a redox process with fast electron-transfer kinetics, the concentration of the oxidized and reduced halves of the redox couple are related to the electrode potential, E, by the Nernst eqn (1),4a,5b
 |
1 |
where E0′ is the formal (thermodynamic) reduction potential, R is the gas constant, T is the temperature, n is the number of electrons transferred in the redox event, F is Faraday's constant, and [Ox] and [Red] are the interfacial concentrations of the oxidised and reduced species respectively (assuming activity coefficients of unity for all species). During the potential scan of CV, the concentrations of redox-active species at the electrode interface change over time by undergoing electron transfer to attain the equilibrium position as defined by the Nernst equation, which results in the observed change in current response.
For an electrochemically reversible process, E1/2 is measured as halfway between the anodic and cathodic peak potentials, and is approximately equal to E0′. Additionally, the separation of the two peak potentials for a reversible redox event with fast electron-transfer kinetics is equal to ∼60/n mV at room temperature, where n is the number of electrons transferred in the redox event.4a A peak separation significantly greater than this value is an indication that the electron-transfer kinetics are slow on the time scale of the potential sweep, which is favored at fast CV scan rates. Accordingly, the variation in peak separation upon changing the CV scan rate can be used to quantify the heterogeneous electron transfer rate constant between the electrode and redox-active species.5a
Cyclic voltammetry can be used as a rapid way to assess the ability of a molecule to undergo electron transfer. The thermodynamic driving force needed to generate different redox species can be compared, enabling selection of a suitable catalyst,6 mediator,7 sensitizer,8 or terminal reductant/oxidant.9 However, when comparing E1/2 values, care should be taken if the measurements were conducted under different conditions – measured against a different reference electrode, or in a different solvent or electrolyte, the E1/2 observed will vary.
Many organic compounds undergo chemically irreversible electron transfer, forming a highly reactive charged or radical species with a short half-life. These compounds may be unstable on the CV timescale, reacting in a homogenous chemical reaction with other substrates, intermediates, solvent, oxygen or water. The subsequent chemical step (denoted C in an EC mechanism) results in the loss of product electrogenerated on the forward scan, resulting in a decrease in the magnitude of the peak current on the reverse sweep. The shape of the voltammogram for an EC reaction with two different rates of the chemical step is shown in Fig. 1c. Importantly, the shape of the CV response can provide information on the stability and lifetime of the intermediate – if a CV response appears irreversible with no peak observed on the reverse scan in the absence of substrate, then the species will likely not be a good catalyst or mediator since it may decompose before the desired transformation can occur.
Quantitative data on the kinetics of the chemical step can also be obtained by measuring the voltammetric shape as a function of the scan rate, with the voltammogram appearing more reversible at higher scan rates (see Section 2.5). The characteristic half-peak potential (Ep/2) for an EC reaction is a function of the rate constant of the chemical reaction following the initial electron-transfer step, and thus generally cannot be employed to approximate E0′, as in the case of using E1/2 values for chemically reversible electron-transfer reactions. Nevertheless, Ep/2 can be used as a predictive tool for comparing relative thermodynamic redox potentials, with reference to the data tabulated by Nicewicz and co-workers.10
2.2. Speciation and consecutive redox events
With multiple redox-active species in solution, the CV waveshape can become complicated and more difficult to qualitatively analyse. Nevertheless, CV responses obtained with differing relative concentrations of species can provide a rapid method to investigate speciation or ligand exchange in solution by monitoring for an increase/decrease in relative currents of known redox couples.11 Additionally, multiple peaks in the CV response can also arise when the same redox-active species is able to undergo sequential electron transfer events, as in EE mechanisms. When observing multiple peaks, it is important to consider both of these scenarios.
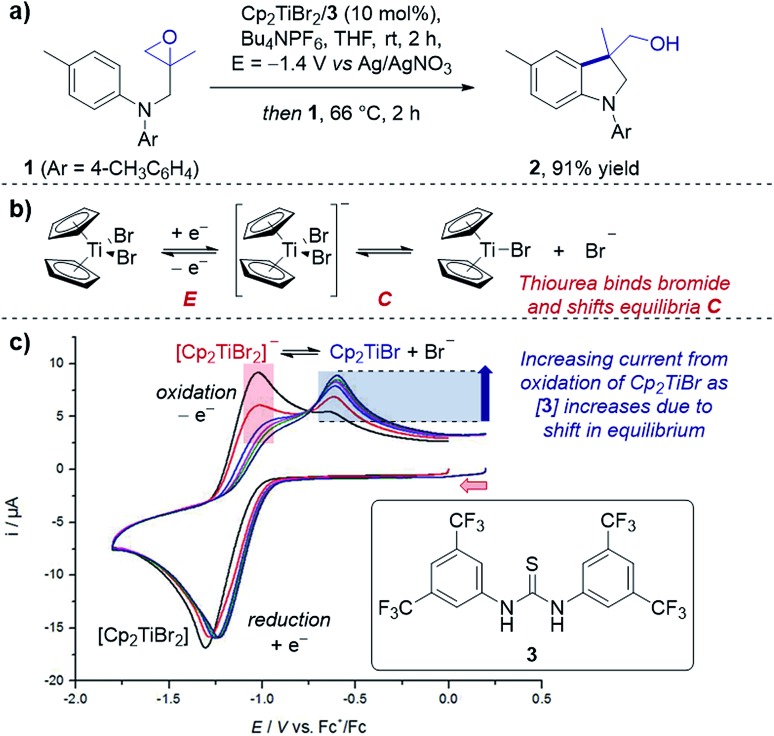
Case study 1: determining speciation in a CV. Gansäuer and co-workers utilised CV to enhance the concentration of the active catalyst for a titanocene(iii)-catalysed radical arylation of an intramolecular epoxide (Fig. 2).12 Electrochemical reduction of Cp2TiBr2 led to an equilibrium between the resting state of the catalyst, [Cp2TiBr2]–, and the active catalyst, Cp2TiBr. The authors observed that increasing the presence of thiourea 3 increased the peak current for oxidation of Cp2TiBr relative to [Cp2TiBr2]–, consistent with abstraction of the bromide anion by the hydrogen-bond donor motif. This change in speciation was most pronounced between 0 and 1 equivalent of 3, indicating the optimum reaction stoichiometry of titanium : 3 of 1 : 1. It is also of note that the presence of the thiourea shifts the reduction peak to a more positive potential, indicating the equilibrium formation of an adduct (see Section 2.3 for more information on equilibria in CV responses).
Fig. 2. (a) An example of CV used to monitor the speciation of the active titanocene catalyst (Cp2TiBr), depending on the equivalents of thiourea 3 added, utilised in a radical epoxide arylation by Gansäuer and co-workers. (b) Depiction of EC mechanism of titanocene catalyst. (c) CV responses with varying concentration of thiourea 3. Red arrow in figure demonstrates the direction of the scan, positive current represents oxidation. (c) Adapted with permission from ref. 12a. Copyright 2018 John Wiley and Sons.
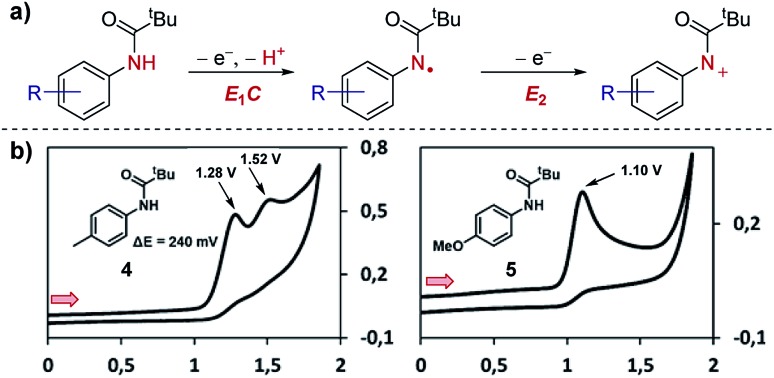
Case study 2: ECE mechanisms. Further to the identification of multiple species, CV can also be used to identify consecutive redox features of the same substrate. In work by Waldvogel and co-workers,13 the oxidation of anilides was determined to occur through two consecutive electron-transfer processes separated by a chemical deprotonation (denoted as an ECE mechanism), first oxidation and deprotonation to the amidyl radical and then further oxidation to the corresponding cation (Fig. 3). For the para-methylphenyl substrate 4, the CV response displays two distinct irreversible oxidation peaks separated by 240 mV (the irreversibility of the CV response is consistent with a chemical deprotonation following the electron transfer).
Fig. 3. CV responses displaying the dependence of the separation in potential of the two electron oxidation processes on the structure of the anilide, reported by Waldvogel and co-workers. (a) Depiction of the ECE mechanism of anilide oxidation. (b) CV responses of anilides 4 and 5. Red arrows in figures demonstrate the direction of the scan, positive current represents oxidation. (b) Adapted with permission from ref. 13. Copyright 2017 American Chemical Society.
In contrast, only one irreversible oxidation is observed for the para-methoxyphenyl substrate 5. In this case, the redox potential is less positive than for substrate 4 since the mesomerically electron-donating methoxy group increases the electron density located on the aromatic ring and nitrogen lone pair. Furthermore, since the amino cation obtained from substrate 5 is stabilised by conjugation, and the second oxidation occurs at a potential either equal to or less positive than the first oxidation. Consequently, only one 2e anodic peak is observed in the CV of compound 5. Knowledge of how to access the radical and/or cationic intermediates could then be utilised by the authors for differentiated reactivity.
2.3. Equilibria and binding
Cyclic voltammetry can be a powerful tool to observe equilibria in solution. The addition of additives or impact of a following chemical reaction can result in the change in position of an electron transfer equilibrium, thereby shifting the observed potentials of redox events. Knowledge of these factors can allow manipulation of the thermodynamics of reactions.
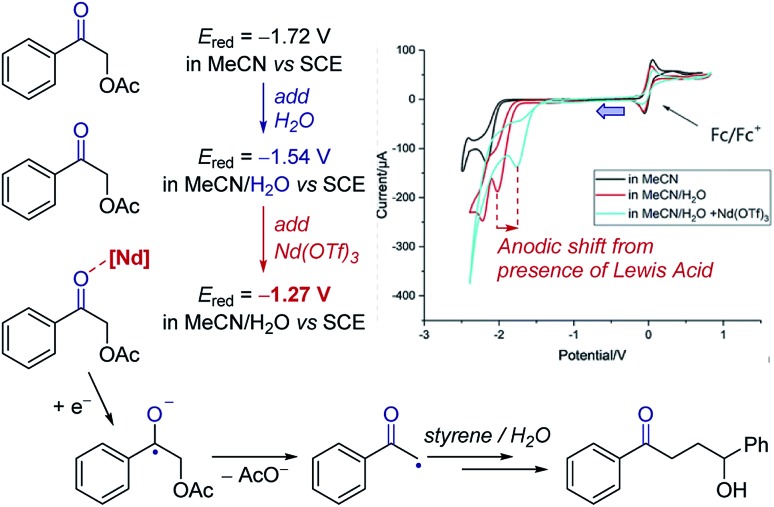
Case study 3: identifying the effect of additives on the thermodynamics of electron transfer. In extreme cases, binding can be used to change the thermodynamics of a reaction from endergonic to exergonic – for example, the coordination of Nd(OTf)3 to a ketone was found by Zeitler and co-workers to shift the reduction potential of the ketone by over 250 mV (Fig. 4).14 This shift is consistent with the Lewis acidic neodymium binding to the ketone, which lowers the LUMO and facilitates reduction to the ketyl radical anion. Furthermore, the authors observed that the addition of water to the solvent mixture also lowers the redox potential of the ketone. In combination, using water and Nd(OTf)3 shifted the potential by 450 mV, making reduction by the photoexcited state of Ir(ppy)3 (E1/2 = –1.73 V) significantly more exergonic to enhance subsequent reactivity.
Fig. 4. Effect of the binding of Nd(OTf)3 to a ketone on the redox potential facilitating photoredox catalysed reduction, reported by Zeitler and co-workers. Blue arrow in figure demonstrates the direction of the scan, positive current represents oxidation. Adapted with permission from ref. 14. Copyright 2018 The Royal Society of Chemistry.
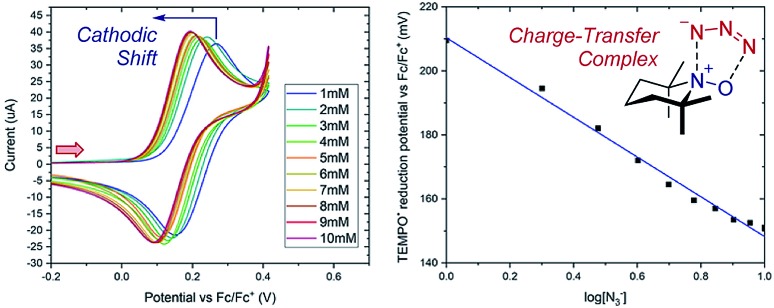
Case study 4: determining the stoichiometry of binding from peak potentials. The peak potentials of a given redox event shift according to the position of the equilibrium (a Nernstian dependence, according to eqn (1)), facilitating quantitative knowledge of binding. Lin and co-workers used this dependence to determine the stoichiometry of an observed charge-transfer complex between TEMPO+ and N3– (Fig. 5).15 It was found that the TEMPO+/TEMPO˙ redox couple displays a cathodic (to a less positive potential) shift upon the addition of sodium azide. By plotting the potential against the base-10 logarithm of the azide concentration, a slope of 62 mV dec–1 was determined. The Nernst eqn (1) can be used to calculate a theoretical slope of 59 mV dec–1 for a 1 : 1 stoichiometry of binding. Since the experimental slope is close to the theoretical value, this provides direct evidence for a 1 : 1 stoichiometry in the complex, demonstrating the existence of a charge-transfer complex. Synthetically, this charge-transfer complex proves useful, since it mediates an electron transfer to form an azide radical, which the authors found to be capable of adding to olefinic substrates.
Fig. 5. Nernstian dependence of the potential of the TEMPO redox couple on the concentration of azide demonstrates a 1 : 1 stoichiometry charge-transfer complex, reported by Lin and co-workers. Red arrow in figure demonstrates the direction of the scan, positive current represents oxidation. Adapted with permission from ref. 15. Copyright 2018 American Chemical Society.
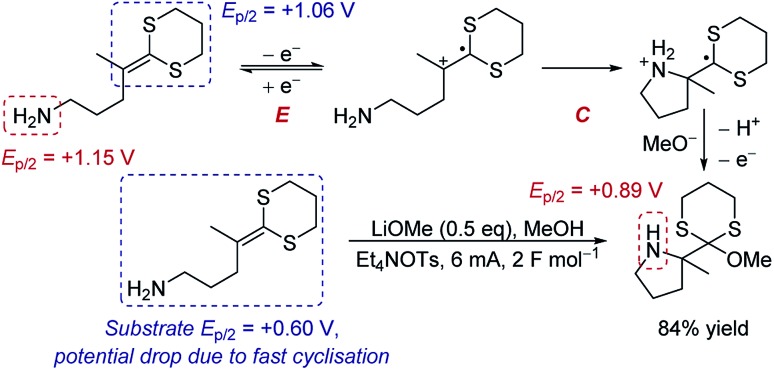
Case study 5: the manipulation of redox potentials by following chemical steps. Xu and Moeller have demonstrated that a chemical step following electron transfer can shift the reduction to a more negative potential to make the entire reaction feasible.16 The intramolecular anodic coupling of an amine with a dithioketene acetal at first appears challenging, since the amine functional group in the product (Ep/2 = +0.89 V) has a lower redox potential than the isolated dithioketene motif that needs to be oxidised (Ep/2 = +1.06 V), suggesting that overoxidation would occur (Scheme 1). However, rapid cyclisation of the nucleophilic amine depletes the equilibrium of the oxidised species through chemical step C. Shifting the equilibrium in this manner changes the redox potential. Indeed, when the redox potential of the substrate was measured by CV, the Ep/2 was found to be only +0.60 V, 460 mV lower than the redox potential of the isolated dithioketene (Ep/2 = +1.06 V, measured in the absence of the amine, such that the cyclisation does not occur and the equilibrium is not perturbed). Since the potential of the substrate (Ep/2 = +0.60 V) is below that of the product (Ep/2 = +0.89 V), the authors determined that the process occurs without overoxidation, and the product was obtained in 84% yield.
Scheme 1. Proposed anodic cyclisation of an amine with a dithioketene acetal, reported by Xu and Moeller [ref. 16a].
2.4. Catalytic currents
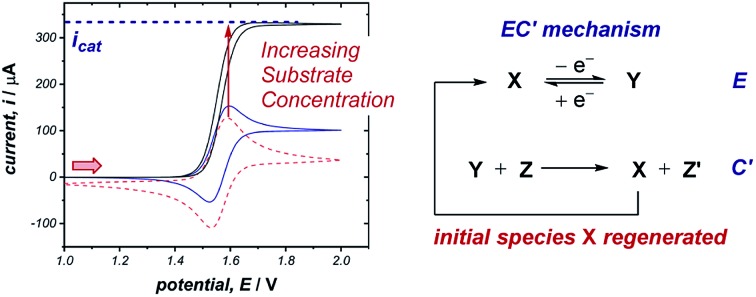
The occurrence of catalysis is another important mechanistic feature, which can be easily observed by CV.4d,f,5a,17 In a catalytic electron-transfer mechanism, reduction/oxidation creates a species that undergoes a chemical step, resulting in the regeneration of the initial redox species capable of further electron transfer (mechanism denoted as EC′, where prime indicates nomenclature means that the initial species is regenerated by the chemical step C). This results in an overall irreversible redox reaction, with the peak on the reverse scan diminished to an extent determined by the kinetics of the chemical step. Additionally, since the catalytical species is regenerated near the electrode interface, the current of the CV response in the forward direction increases (although, it is important to note that this is not the only factor which can cause an increase in current18), and the onset potential becomes lower in magnitude. As the concentration of the substrate increases, catalytic turnover becomes more rapid, leading to a sequential increase in the current of the CV response in the forward direction. At sufficiently high concentrations of substrate, the CV response in the presence of catalysis can appear as a plateau, instead of a peak followed by a diffusional tail (Fig. 6). The plateau height (icat) depends on the concentrations of the catalyst and substrate, and this waveshape occurs when the current is limited by the rate of the chemical (catalytic) step.5a Furthermore, the peak-shaped response returns as the scan rate is increased and the rate of catalyst diffusion to the electrode exceeds the rate of its regeneration and dominates the voltammetric response.
Fig. 6. Representative CV responses for a catalytic (EC′) mechanism, demonstrating the change between peak-shaped response and plateau response as the substrate concentration increases. Simulations run with 0 equivalents (dashed red line), 10 equivalents (solid blue line) and 100 equivalents (solid black line) of substrate respectively. Arrow in figure demonstrates the direction of the scan, positive current represents oxidation.
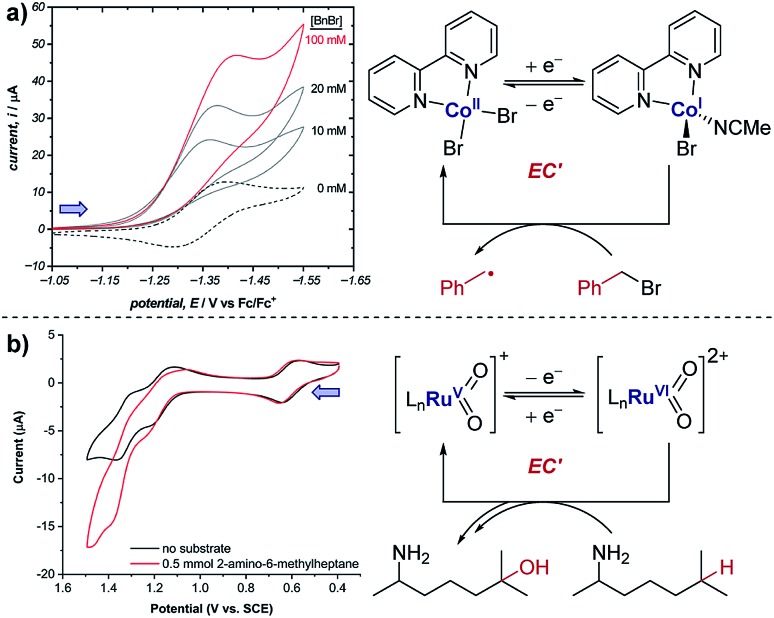
Case study 6: how a catalytic waveform can inform mechanism. Example CV responses of an EC′ mechanism19 are shown in Fig. 7a, reported by the groups of Minteer and Sigman.20 It was found that the ligated Co(ii)/Co(i) displays a chemically reversible CV response (E mechanism) in the absence of substrate at a scan rate of 100 mV s–1 (dashed line). However, sequential additions of benzyl bromide lead increasing catalytic currents as a function of [BnBr]. This is consistent with oxidative addition of Co(i) to BnBr forming a benzyl radical, simultaneously regenerating Co(ii) that is reduced at the cathode.
Fig. 7. (a) Evidence of electrocatalysis (EC′ mechanism) by a ligated Co(ii) species through oxidative addition of benzyl bromide, reported by the groups of Minteer and Sigman. Blue arrow in figure demonstrates the direction of the scan, positive current represents reduction. Adapted with permission from ref. 20. Copyright 2019 American Chemical Society. (b) Determination of catalytic Ru oxidation states from the increase in current due to catalysis, reported by the groups of Du Bois, Waymouth, Sigman and Zare. Blue arrow in figure demonstrates the direction of the scan, positive current represents reduction. Adapted with permission from ref. 21. Copyright 2019 American Chemical Society.
Case study 7: identifying active catalysts. The observation of a catalytic current can allow key mechanistic details to be analysed. For example, the groups of Du Bois, Waymouth, Sigman and Zare used CV studies to elucidate which ruthenium oxidation states can catalyse C–H oxidation of aliphatic substrates.21 Multiple reversible oxidation couples were observed for the different catalyst oxidation states (Fig. 7b). When the substrate was added to the mixture, a current increase was observed for the peaks at 1.20 and 1.35 V, corresponding to the Ru(iv)/Ru(v) and Ru(v)/Ru(vi) couples, respectively. This increase in current is indicative of the oxidised ruthenium complex being catalytically active in the oxidation of the substrate. Since the increase in current is most pronounced for the Ru(v)/Ru(vi) redox couple, this suggests that Ru(vi) is the most catalytically active oxidation state. However, the increase in current for the Ru(iv)/Ru(v) couple is comparatively small and could be the result of the start of the increase in current from the following Ru(v)/Ru(vi) couple, and so further experiments were required to verify the catalytic activity of Ru(v).
The use of CV to measure coupled chemical reactions allows determination of potential catalysts, as well as rapid screening for substrates with which they can react.22 Whilst this technique is used in the screening of homogeneous electrocatalysts, its modern incorporation into other synthetic fields remains limited. For example, in the field of photoredox catalysis, Knowles and co-workers identified that a perester substrate can be reduced by an Ir(ii) photocatalytic intermediate.23 Given the ease of this technique, we envision its wider incorporation in these areas in the near future.
2.5. Kinetic measurements
Cyclic voltammetry is an important technique in determining reaction kinetics – rate constants of following chemical steps can be determined through measuring changes in peak currents and/or peak potentials. In catalytic mechanisms, these kinetic measurements allow comparisons to be made between different catalysts (e.g., comparison of turnover numbers and frequencies), enabling optimisation of reaction outcomes. Additionally, experimentally determined rate constants can be compared with simulations of CV responses (see Section 9) to confirm reaction mechanisms.
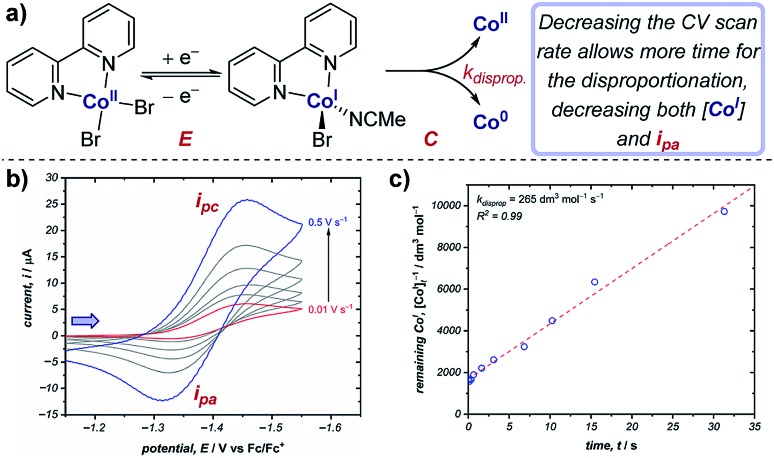
Case study 8: determining rate constants of following chemical steps with peak currents (EC mechanisms). Changing the scan rate of the sweep enables control of the duration of the voltammogram, and can be compared against reactivity. For example, the groups of Minteer and Sigman determined the rate constant for the disproportionation of a range of ligated Co(i) complexes (Fig. 8).20 According to the Randles–Sevcik equation at room temperature (2),24
| ip = (2.69 × 10⁵)n3/2AD1/2Cν1/2 | 2 |
the peak currents (ip) in an electrochemically reversible CV response are directly proportional to the bulk concentration of the species (C) undergoing electron transfer. For a chemically reversible reductive electron transfer, the concentration of the reduced species at the electrode after the forward scan is equal to the initial concentration of the species being reduced before the CV. In this case, the ratio of the peak anodic and cathodic currents (ipa/ipc) is theoretically equal to one (assuming the two redox-active species have the same diffusion coefficient). Since it is not always straightforward to precisely define the peak current on the reverse scan due to the decaying baseline cathodic current,4a,5a the measured ipa/ipc ratio is often not exactly one, but it is important that for a chemically reversible species the value of this ratio is independent of scan rate.
Fig. 8. (a) Kinetic measurements of the Co(i) disproportionation rate constant from CV studies, reported by the groups of Minteer and Sigman. (b) Variable scan rate CV responses demonstrating the changing ipa/ipc ratio due to chemical depletion of Co(i) in the EC mechanism.25 Blue arrow in figure demonstrates the direction of the scan, positive current represents reduction. (c) Second order rate plot used to determine the rate constant. (b and c) Adapted with permission from ref. 20. Copyright 2019 American Chemical Society.
In contrast, for a cathodic EC mechanism, the chemical transformation depletes the concentration of the reduced species, and therefore results in a decrease in the peak anodic current (ipa) when compared to an E mechanism, resulting in a concomitant reduction in the ipa/ipc ratio.25 Changing the scan rate of the CV alters the time taken between the peak cathodic and peak anodic potentials: decreasing the scan rate allows more time for the chemical reaction, resulting in a decreased concentration of Co(i) for the return sweep. This results in greater irreversibility in the CV response and a decrease in the ipa/ipc ratio (Fig. 8b). Plotting the concentration of reduced cobalt remaining after a given time according to second order kinetics thereby allows determination of the rate constant of the disproportionation (Fig. 8c). The authors were able to use this method to calculate the disproportionation rate constants for a range of Co(i) complexes ligated by N,N-bidentate ligands, and used these data to identify possible mechanisms of disproportionation.26
In the domain of catalysis (cf., Fig. 6), the order of each reaction component and rate constants can also be obtained by comparison of the catalytic current (icat) with the peak current in the absence of substrate (ip).4d Kinetic studies of catalysis through electroanalytical techniques have become standard practice in the inorganic community.27
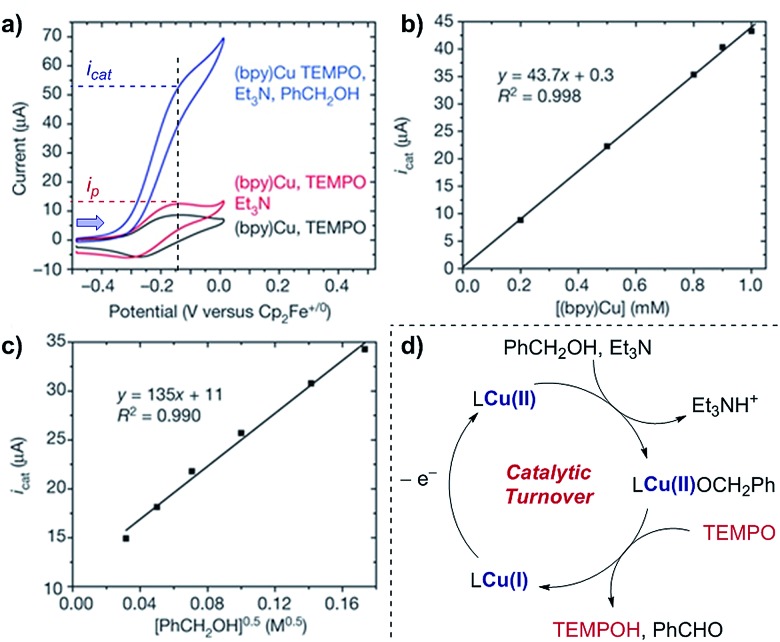
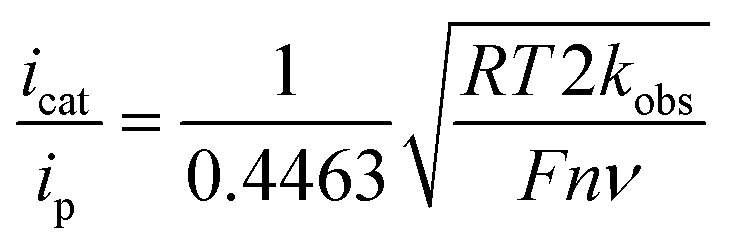
Case study 9: determining catalytic rate constants (EC′ mechanisms). Within organic catalysis, Badalyan and Stahl studied the cooperative catalytic effect of copper and TEMPO on the oxidation of primary alcohols by a number of CV techniques.28 First, changing the concentration of the copper catalyst, (bpy)Cu, the rate was found to exhibit a first-order dependence on the catalytic current (Fig. 9). Similarly, a half-order dependence on the alcohol substrate was observed. With this knowledge in hand, adopting a kinetic framework formulated by Costentin and Savéant,29 the ratio of icat/ip is dependent on the scan rate (ν) according to eqn (3),30
 |
3 |
where kobs is the observed rate constant. Accordingly, the authors determined the rate of the oxidation, demonstrating a 5-fold increase in kobs in the presence of copper due to cooperation of the two catalysts.
Fig. 9. (a–c) Kinetic studies of a cooperative electrocatalytic alcohol oxidation by measuring the catalytic current on a CV response as a function of substrate/catalyst concentration, reported by Badalyan and Stahl. (d) Proposed catalytic cycle for alcohol oxidation. Blue arrow in figure demonstrates the direction of the scan, positive current represents oxidation. (a–c) Adapted with permission from ref. 28. Copyright 2016 Springer Nature.
Since the determination of the order of a reaction with respect to a given substrate in this manner allows identification of the rate-limiting step in catalysis,31 these techniques enable the postulation of reaction mechanisms. Recently, Costentin and Savéant developed a rigorous technique to study the benchmarking and optimisation of molecular catalysts by examining thermodynamic and/or kinetic correlations between properties such as turnover frequency and overpotential.32 The authors illustrated their analysis with an oxygen reduction reaction (ORR, see also Section 5.2),33 but the same techniques can be readily applied for organic transformations.
In addition to quantitative kinetic measurements determined using currents from CV experiments, shifts in potential of a CV response at differing scan rates also allow determination of the relative concentrations of redox-active species, which thereby facilitates calculation of rate constants, as well as mechanistic paths for reactions involving multiple electron transfer and chemical steps.34 The case study below exemplifies this in the scenario of an EC mechanism, but the same process can be applied to determine kinetic measurements of catalytic (EC′) reactions under specific experimental conditions (the ‘total’ catalysis regime).5a,27c
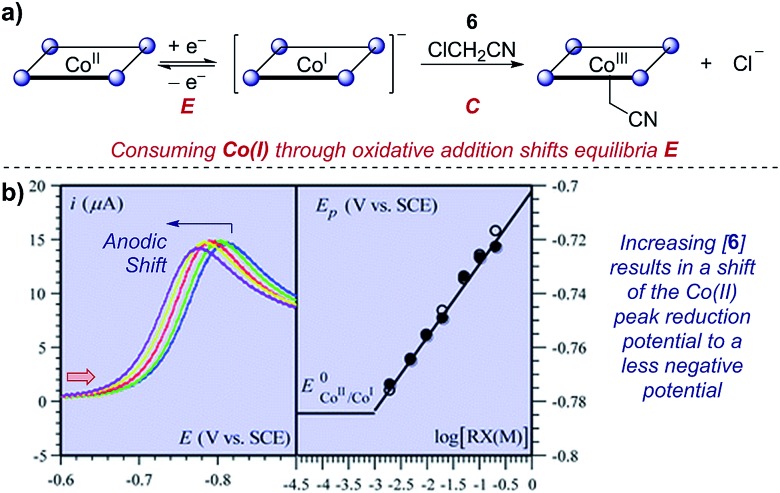
Case study 10: determining rate constants of following chemical steps with peak potentials (EC mechanisms). In a study of proton-coupled electron transfer, Costentin et al. measured the rate constant for oxidative addition of chloroacetonitrile to cobalt(i) tetraphenylporphyrin.35 Given that cobalt is first reduced from the Co(ii) state, oxidative addition depletes the concentration of Co(i) and shifts the equilibrium of the reversible reduction (an EC mechanism). In a similar manner to that discussed in Section 2.3, the peak potential has a dependence on the shift of the equilibrium of the two redox-active species. By increasing the concentration of the chloroacetonitrile 6, an anodic (to a less negative potential) shift is observed (Fig. 10). Plotting the peak potential against the base-10 logarithm of the concentration, the slope is consistent with a pseudo-first order reaction, and the intercept allows determination of the corresponding rate constant.36
Fig. 10. (a) Kinetic studies on the rate of oxidative addition of chloroacetonitrile 6 to cobalt(i) tetraphenylporphyrin (ligand depicted by the four nitrogen binding sites as circles), reported by Costentin et al. (b) The shift in the peak reduction potential by the concentration of chloroacetonitrile (RX) allowed determination of the rate constant. Red arrow in figure demonstrates the direction of the scan, positive current represents reduction. (b) Adapted with permission from ref. 35. Copyright 2013 The Royal Society of Chemistry.
3. Pulsed voltammetric techniques
3.1. Introduction to pulsed voltammetry
Pulsed voltammetric techniques provide a unique alternative to sweep voltammetry methods (such as CV and linear sweep voltammetry).37 The primary benefit to pulsed techniques, such as normal pulsed voltammetry (NPV) and square wave voltammetry (SWV), is the high sensitivity that they afford in terms of both potential and current. This enables the detection of electroactive species at very low concentrations (as low as 10–7 M), and facilitates the resolution of overlapping redox features of multiple electroactive species (typically, any redox peaks separated by >50 mV can be resolved).38 For these reasons, NPV and SWV have most commonly been applied in the area of electrochemical sensing; however, there are examples of SWV being used to study homogeneous reaction mechanisms as well as recent work quantifying the distribution of organometallic ligation states.20,39
In any electrochemical measurement, the current observed upon polarisation of an electrode (e.g., as a potential is applied during CV) is a composite of two factors: (a) the faradaic current, which reports the rate of consumption of an electroactive species at the electrode, and (b) capacitive (non-faradaic) current, which is caused by reorganisation of supporting electrolyte at the electrode–solvent interface and charging of the electric double layer. While faradaic current typically persists on the order of seconds, capacitive current decays completely within a few milliseconds (it should be noted that this time can increase with high-surface area electrodes). Pulse voltammetry methods employ a staircase-shaped waveform (Fig. 11a), in which an initial base applied potential (the reverse pulse) is alternated with pulses of higher applied potential (the forward pulse), and the net current is the difference between currents sampled during the forward and reverse pulse. In this way, the capacitive current can be removed to allow measurement of the desired faradaic current, which results from electron transfer at the electrodes. This net current results in a single uniform peak centred around the midpoint potential of the electroactive species (Fig. 11b), which allows direct measurement of the reduction potential (E1/2) of the species.
Fig. 11. (a) Staircase-shaped waveform of a SWV experiment. (b) “Bell-shaped” curve that results from the signal of a chemically reversible redox couple of an electroactive species in a SWV experiment (cf., representative CV response in Fig. 1b). Red arrow in (b) demonstrates the direction of the scan, positive current represents oxidation.
The two most commonly applied pulse voltammetry techniques, differential pulse voltammetry (DPV) and SWV, differ primarily in the duration of the forward pulse relative to the reverse pulse. While SWV is a specialised form of DPV, standard DPV experiments employ a short forward pulse relative to the backward pulse (typically, the forward pulse is ∼1% of the duration of the reverse pulse) to exhaust capacitive current and undesired redox processes. In contrast, SWV employs forward and reverse pulses of equal duration so that the overall time per waveform is dramatically decreased. The cumulative result is that DPV is limited to substantially slower sweep rates (∼10 mV s–1) than SWV (upper limit ∼1 V s–1). Consequently, SWV is highly preferable when studying short-lived electrochemically generated species.
It should be noted that whilst SWV can be a valuable tool for studying mechanistic aspects of electrochemically-coupled chemical reactions, it often requires the ability to simulate voltammograms to quantify more nuanced kinetic parameters (see Section 9). Nevertheless, some general trends have been ascertained – specifically, the width of a SWV peak at half-height (W1/2) for a reversible redox couple should be 100 mV for a reversible one-electron-transfer process.40 This can be particularly useful in identifying the number of electrons transferred in overlapping SWV peaks.
3.2. Examples of square wave voltammetry for investigating speciation and organic mechanisms
Case study 11: identifying consecutive redox events with SWV. In order to ascertain the possible mechanism in their electrochemical Birch reduction, the groups of Baran, Minteer, Anderson and Neurock utilised SWV to resolve two reduction events (Fig. 12).41 At first, when the SWV of the reduction of naphthalene in the presence of LiBr and dimethylurea was measured with a pulse frequency of 10 Hz, one reduction peak was observed at –3.2 V. However, the observed value for the width of the SWV peak at half-height (W1/2) was substantially greater than the theoretical value of 100 mV for the transfer of only one electron. Combined with experimental data demonstrating the electrochemical reversibility of naphthalene reduction at sufficiently fast scan rates, this data suggested the presence of multiple overlapping electron transfers. Further CV analysis investigating the reversibility of the redox species under different potential windows41 indicated the possibility of an intervening chemical step [a sequential electron transfer, chemical protonation, electron transfer (ECE) mechanism], which would cause the kinetics of the second electron transfer to be dependent on the rate of the intervening protonation. When the SWV experiment was performed with a higher frequency of 100 Hz, the peak potentials in the SWV are shifted cathodically (to a more negative potential) due to slow electron-transfer kinetics under the shorter timescale of the experiment. However, the second reduction displays a larger cathodic shift because it is dependent on the speed of the intervening chemical reaction. By scanning at higher frequencies in this manner, SWV can be used to resolve otherwise overlapping redox peaks.
Fig. 12. (a) SWV study of the electrochemical Birch reduction of naphthalene provides evidence for two sequential electron-transfer steps, consistent with an ECEC mechanism, reported by the groups of Baran, Minteer, Anderson and Neurock. (b) SWV response at two different pulse frequencies. Red arrow in figure demonstrates the direction of the scan, positive current represents reduction. (b) Adapted with permission from ref. 41. Copyright 2019 The American Association for the Advancement of Science.
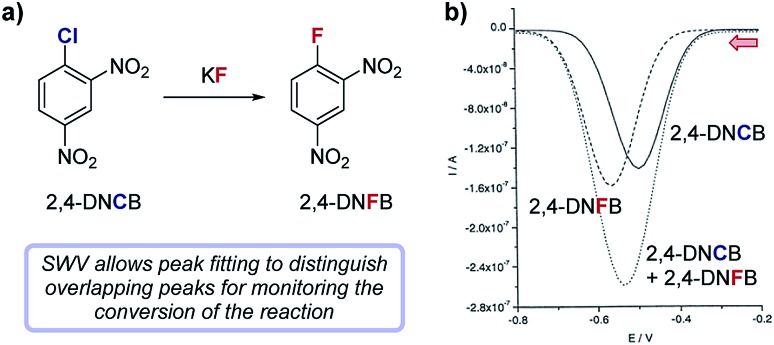
Another method for resolving overlapping SWV peaks involves peak fitting of their component curves. The symmetric nature of SWV peaks enables composite curves to be fitted to the sum of two independent Gaussian curves, facilitating the measurement of relative concentrations of electroactive species, and thereby proving useful for monitoring the progress of organic reactions.
Case study 12: measuring reaction conversion by fitting SWV curves. In a study by Compton and co-workers (Fig. 13), SWV was used to monitor a halogen exchange reaction of 2,4-dinitrochlorobenzene (2,4-DNCB) in the preparation of 2,4-dinitrofluorobenzene (2,4-DNFB),42 a reagent used to label N-terminal amino acid groups of polypeptide chains. Since the reactants and products are structurally similar, monitoring this reaction by TLC proved impractical. Both 2,4-DNCB and 2,4-DNFB can be electrochemically reduced and exhibit reversible redox waves with midpoint potentials at –0.51 V and –0.56 V, respectively. The similarity of redox potentials and the asymmetric nature of sweep voltammetry makes peak fitting of their overlapping CV signals impractical for a reaction mixture; however, SWVs of reversible redox species generally result in symmetric peaks that can be readily fit to a Gaussian curve. Using two Gaussian fits to resolve distinct SWV peaks in aliquots from the halogen exchange reaction, absolute concentrations of each reaction component were conveniently determined at regular time intervals, enabling analysis of the conversion of the reaction as a function of time.
Fig. 13. (a) The conversion of the fluorination of 2,4-dinitrochlorobenzene (2,4-DNCB) can be monitored during the reaction by peak fitting reduction peaks using SWV, reported by Compton and co-workers. (b) The signal for 2,4-DNFB (dashes) can be obtained by subtracting the signal of 2,4-DNCB (solid) from the combined SWV signal (dots). Red arrow in figure demonstrates the direction of the scan, positive current represents oxidation. (b) Adapted with permission from ref. 42. Copyright 2002 John Wiley and Sons.
4. Spectroelectrochemistry
Real-time information on reaction intermediates and product formation in complicated chemical systems can be obtained by the combination of spectroscopy and electrochemistry, referred to as spectroelectrochemistry (SEC).43 Since spectroscopic techniques can be applied in situ within the electrochemical cell, SEC allows simultaneous acquisition of both spectroscopic and electrochemical information. SEC encompasses a wide range of spectroscopic techniques, from NMR and mass spectrometry to IR and UV-Vis,44 enabling direct identification of species in solution. In the case of the most widely utilised IR and UV-Vis techniques, a key component of the SEC set-up is the requirement for an optically transparent electrode – often composed of a metal mesh, honeycomb, or transparent oxide electrode – to allow light of the desired wavelength to pass through the cell.45 Alternatively, with appropriate instrumentation, SEC can operate in reflectance mode.46 Additionally, it should be noted that consideration of the time-scale is necessary when conducting SEC. Depending on the technique and the analyte, it may be necessary to hold a potential for seconds to minutes in order to build up sufficient concentration in the diffusion layer to be spectroscopically detectable, a major hindrance in the examination of short-lived species. Alternatively, adsorption techniques that can probe processes at the femtosecond time-scale are available, with more intensive experimental set-up required.47
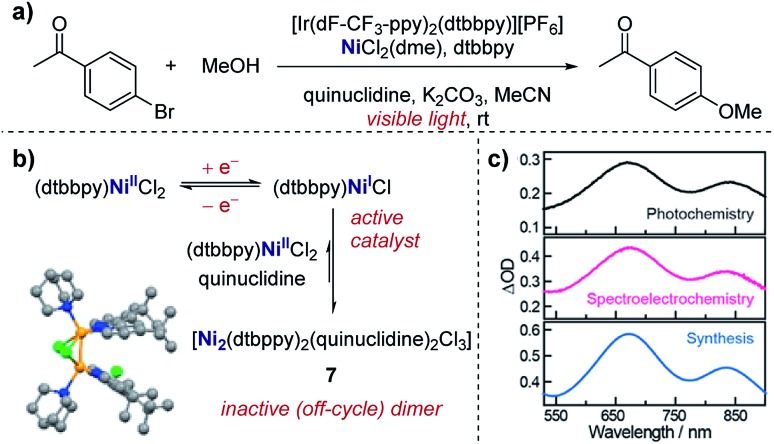
Case study 13: identifying intermediates by UV-Vis spectroelectrochemistry. As an example of the utility of SEC, Nocera and co-workers utilised UV-Vis spectroscopy to validate the presence of a mixed-valent Ni(i/ii) dimer (7) as an off-cycle reaction intermediate in a nickel-catalysed cross-coupling (Fig. 14).48 Dimer 7 was independently synthesised and found to match the UV-Vis absorption profile of the reaction mixture from in situ SEC, providing direct evidence of this species in solution. By the identification of the off-cycle dimer 7, the authors were able to provide a revised mechanism in which the iridium photocatalyst initiates a self-sustaining Ni(i)/Ni(iii) cycle. Additionally, the authors were able to identify conditions which help to reduce the formation of other off-cycle Ni(ii) species, leading to a 15-fold increase in the quantum yield for the photochemical etherification of aryl halides, a reaction originally reported by MacMillan and co-workers.49
Fig. 14. (a) Evidence for the formation of a mixed-valent Ni(i/ii) dimer (7) in the photochemical etherification of arylhalides, reported by Nocera and co-workers. (b) 7 was synthesised independently, and the corresponding UV-Vis profile found to match measurements made of the reaction mixture in both photochemical and spectroelectrochemical settings (c). (b and c) Adapted with permission from ref. 48. Copyright 2019 American Chemical Society.
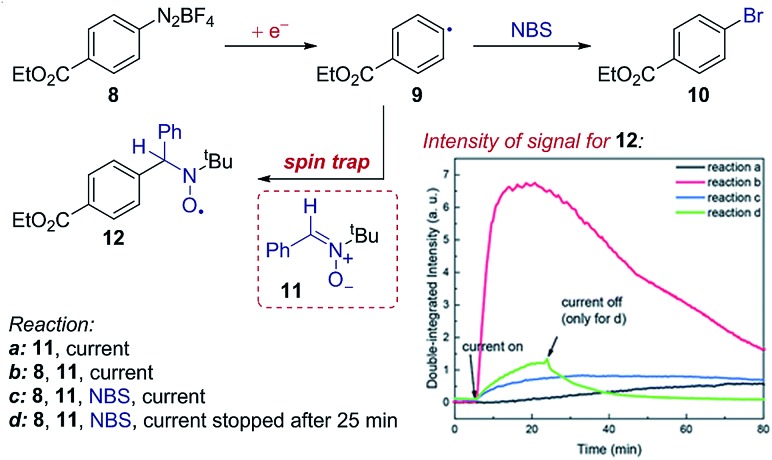
Case study 14: identifying intermediates by EPR spectroelectrochemistry. As another example of the application of SEC to investigate organic mechanisms, EPR spectroelectrochemistry was used by Mo and co-workers to determine the existence of radical intermediates in an electrochemical Sandmeyer reaction (Fig. 15).50 It was found that reduction of aryl diazonium 8 forms an aryl radical 9, which can be trapped by spin-trap 11 to form stable, EPR detectable radical 12. Conveniently, the time evolution of the EPR signal can be measured during the electrochemical reaction – demonstrating rapid formation of the intermediate radical 9, trapping by 11 and competitive bromination of the radical in the presence of N-bromosuccinimide (NBS).
Fig. 15. EPR spectroelectrochemistry provides evidence for the formation of radical 9 following electrochemical reduction, and the subsequent reaction with N-bromosuccinimide (NBS), reported by Mo and co-workers. The formation of radical 9 is measured by the EPR signal of the long-lived radical 12 afforded by spin-trapping. Adapted with permission from ref. 50. Copyright 2018 The Royal Society of Chemistry.
Mass spectrometry also provides a valuable tool to determine intermediates and products. Coupling an electrochemical flow cell to an on-line mass spectrometer has been used widely to determine intermediates and products present in solution following a redox reaction, including in studies of possible metabolic oxidation pathways.51 Alternatively, gaseous or volatile components can be measured by Differential Electrochemical Mass Spectrometry (DEMS) techniques, which have the added capability of directly monitoring rates of product formation.52 Whilst these mass spectrometry techniques have been primarily utilised in the domain of fuel cells and electrolysis, their future prospects for investigating organic mechanisms are exemplified by a report from the groups of Zare and Chen in which the radical cation of N,N-dimethylaniline was detected, an intermediate with a half-life on the order of a microsecond.53
5. Rotating disk and ring-disk electrodes
5.1. Rotating disk electrodes
Rotating disk electrode (RDE) based techniques are powerful tools for investigating a wide range of chemical processes.54 The concept of RDE is predicated on rotating a planar electrode to create a centrifugal force on a thin layer of solution at the electrode interface. The solution that is forced out laterally from the electrode surface is continuously replaced by bulk solution, creating a constant flux of analyte to the electrode. The constant flux results in a steady-state voltammogram that often provides a simpler and more quantitative analysis of the kinetics of electrochemical mechanisms, in comparison with other techniques, such as cyclic voltammetry at a stationary electrode. The steady-state voltammogram that results with an RDE has a limiting current (ilim), which is also observed at microelectrodes (see the waveform in Fig. 18c).
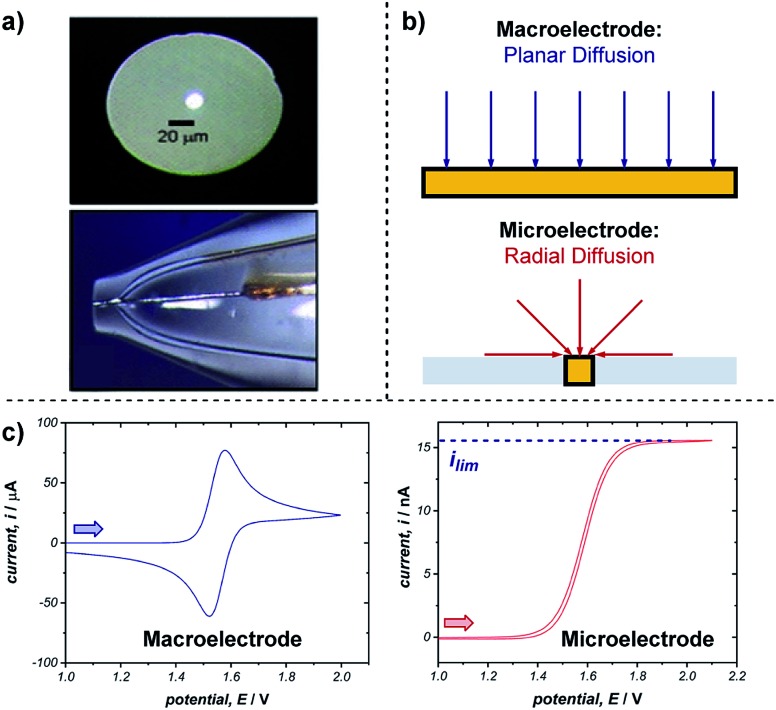
Fig. 18. (a) Optical microscope images of the top and side of an exemplar microelectrode. (b) The difference in transport to a macro- and microelectrode results in differing voltammetric responses, shown for a representative reversible oxidation in (c). Arrows in (c) demonstrate the direction of the scan, positive current represents oxidation. (a) Adapted with permission from ref. 65c. Copyright 2006 Institute of Physics Publishing.
Experiments with an RDE typically use linear sweep voltammetry (LSV): starting at a potential at which no faradaic reaction is occurring, the voltage is then swept over the potential range up to at least 250 mV past the redox potential. Slow sweep rates such as 5 or 10 mV s–1 are often used to ensure steady-state conditions and to reduce capacitive currents (cf., Section 3.1).
According to the Levich eqn (4),55
| ilim = 0.62nFAD2/3ω1/2ν–1/6C | 4 |
the limiting current (ilim in amperes) at an RDE is proportional to the square root of the rotation rate (ω in rad s–1), and is also related to the number of electrons transferred in the electrochemical process (n), as well as the diffusion coefficient of the redox-active species (D in cm2 s–1). By comparison with eqn (2) for the peak current of a CV with a macroelectrode, RDE is a useful tool for the measurement of both n and D when combined with CV studies. Plotting the limiting current as a function of the rotation rate at an RDE, alongside plotting the peak current of a CV at a macroelectrode as a function of the scan rate, provides two slopes which are dependent on different functions of n and D. Additionally, by varying the rotation rate, valuable information on the kinetics of electron transfer (E) and chemical reactions (C) can be obtained, helping to identify multi-step chemical processes by comparing experimental results with mathematical models for a specific reaction mechanism.56
While LSV is commonly used with RDE, constant potential techniques known as chronoamperometry (CA) can also be useful to measure changes in concentration. In a CA experiment, the potential is stepped to a value in the region of interest for a given redox process and then held for a specific amount of time. The region of interest at which the potential is held is typically one at which the current is in the limiting regime, where the current is limited only by the flux of the redox-active species to the electrode (see also Section 6). Since the limiting current in an RDE experiment is directly related to the concentration of a species in solution, it provides the ability to monitor the concentration of a species in real-time.
Case study 15: determining rate constants with rotating disk electrodes. Amatore et al. used chronoamperometry (CA) at a RDE to elucidate competing roles of hydroxide ions in Suzuki cross-coupling reactions (Fig. 16).57 The authors were able to measure the concentration of (Ph3P)3Pd(0) over time (Fig. 16b), with a limiting current (ilim) obtained upon completion of the reaction between Pd(ii) species 13 and phenylboronic acid and full conversion to Pd(0). The data were plotted in the form ln x against time, where x is the fractional conversion of the reaction (Fig. 16b inset), to afford a linear graph consistent with a pseudo-first order kinetic profile in the rate-limiting transmetalation step.58
Fig. 16. RDE experiments provide evidence for a palladium-hydroxyl species as a catalytic intermediate in the Suzuki cross-coupling reaction, reported by Amatore et al. For inset in (b), x is the fractional conversion to Pd(0). (a) Adapted with permission from ref. 58. Copyright 2013 John Wiley and Sons. (b and c) Adapted with permission from ref. 57. Copyright 2011 John Wiley and Sons.
Chronoamperometry was performed with varying amounts of the hydroxide base relative to the arylboronic acid substrate, resulting in a “bell-shaped” relationship between the reaction rate constant and the equivalents of hydroxide (Fig. 16c). At low hydroxide concentrations, the reactive complex 16 is in low concentration and the reaction is slow. Conversely, at high concentrations of hydroxide the boronate complex 15 is formed, which almost entirely retards the reaction, suggesting that the boronate is unreactive in the catalytic cycle. The work provides strong evidence for the existence of a palladium-hydroxide species (14) in the dominant catalytic cycle, a result which has been corroborated by several alternative techniques.59 This insightful work by Amatore et al. was followed with additional investigations combining CA and RDEs to determine the kinetic effects of varying the type of anionic base and countercation in the Suzuki reaction.60
5.2. Rotating ring-disk electrodes
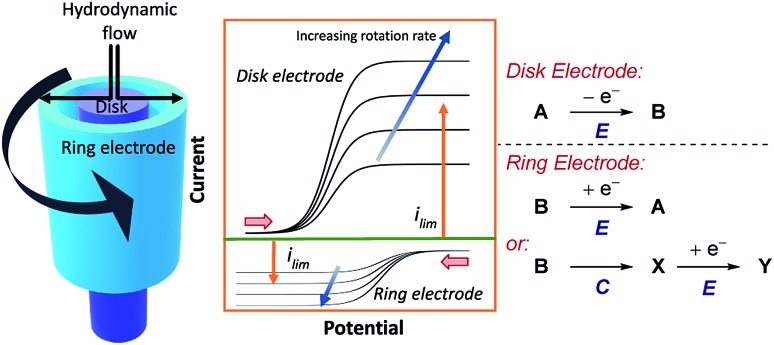
Shortly after RDE was invented, rotating ring-disk electrodes (RRDE) were developed.61 This technique places a second working ring electrode outside of an inner working disk electrode (Fig. 17). When products are formed at the inner disk electrode, they are immediately sent to the second ring working electrode. If the products of the reaction at the disk are electrochemically active, and long lived enough, they can be detected at the second ring, at which a different potential can be applied. By reducing the rotation rate of the electrode, the velocity of the products or intermediates arriving at the ring electrode is decreased. Consequently, more time is allowed for a subsequent chemical reaction (e.g., in an EC mechanism) and the limiting current of the reverse electron transfer will be reduced. The same is also true for increasing the distance between the disk and ring electrodes, although in practice the distance between electrodes is normally fixed. The ability to simultaneously monitor electrolysis of substrates and products in this manner, alongside obtaining quantitative information on reaction kinetics, means that RRDEs can be used to investigate a wide range of chemical mechanisms.62
Fig. 17. Schematic for an RRDE, demonstrating the typical current response at the disk electrode for a hypothetical oxidation reaction, followed by subsequent reduction at the ring. Each set of curves is separately measured by holding the potential at one electrode constant, whilst sweeping the potential at the other electrode across a given range. The figure displayed is thereby a composite of these two sets of experiments. Red arrows in figure demonstrate the direction of the scans, positive current represents oxidation.
One such example of the utility of RDE and RRDE is to benchmark heterogeneous catalysts for the oxygen reduction reaction (ORR),61b,63 since the absence of a homogeneous reaction allows the mass transport to be determined using Koutecký–Levich analysis.4a ORR can either proceed through a two-electron pathway to form peroxide, or via a four-electron pathway which generates water. Using a RRDE allows detection and quantification of peroxide generated in the ORR at the ring electrode, which enables determination of the number of electrons transferred (n), to demonstrate the relative catalyst efficiency for the two-electron pathway against the four-electron pathway.64
6. Microelectrodes
Microelectrodes (often referred to as ultramicroelectrodes, UMEs) are electrodes with at least one dimension below 100 μm. They come in a variety of shapes and sizes, with the most common, and that discussed below, being a conducting disk in an insulating plane (Fig. 18a).65 While microelectrodes may appear merely as smaller versions of their larger ‘macro’ counterparts, their small size leads to characteristically different electrochemical behaviours, creating advantages far beyond measurement in smaller volumes.
The advantages of microelectrodes relative to macroelectrodes stem from differences in transport to and from their surfaces. While transport to macroelectrodes occurs perpendicular to the electrode surface (planar diffusion) and edge effects can be ignored, transport to microelectrodes is dominated by edge effects and species are transported to/from the electrode in all directions (radial diffusion) (Fig. 18b). Radial diffusion leads to much higher mass transport rates and current densities, which facilitates the measurement of faster processes. This difference in transport is apparent from comparing voltammetry using a macro- and microelectrode (Fig. 18c). As discussed in Section 2.1, cyclic voltammetry with a macroelectrode results in a peak current (ip) followed by a diffusional tail, since the reactant has to be transported to the electrode from increasingly farther distances. In contrast, the constant flux to a microelectrode from radial diffusion results in a steady-state response with limiting current (ilim), much like the limiting current observed with rotating disk electrodes (Section 5.1). Additionally, no peak is observed on the reverse scan since the product of the electron transfer diffuses away from the electrode.
In the presence of excess supporting electrolyte, the limiting current at a microelectrode is proportional to the bulk concentration of the redox-active species (C), according to eqn (5),66
| ilim = 4naFDC | 5 |
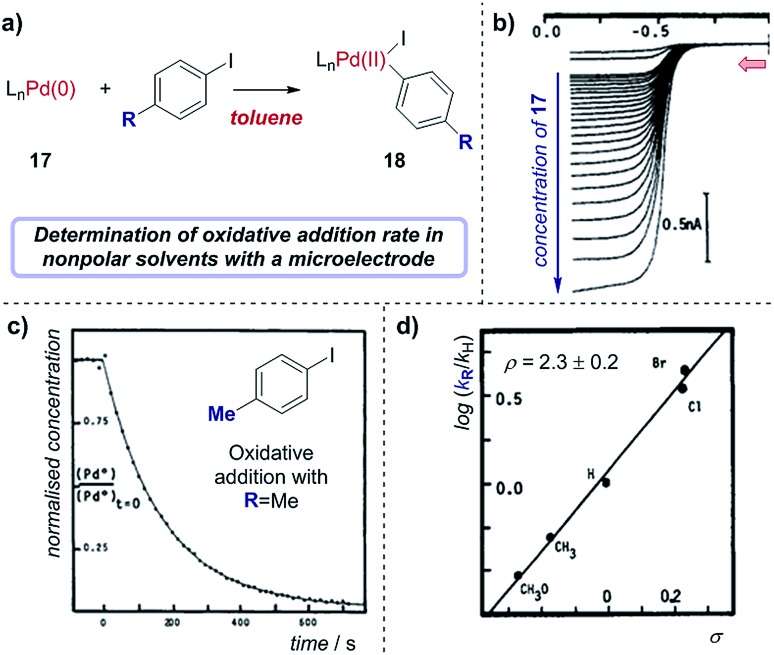
where a is the radius of the microelectrode. Unlike with macroelectrodes, it is of note that the limiting current of a microelectrode is not dependent on the scan rate, which simplifies the measurement of concentration. Furthermore, experiments with RDEs require high dielectric constant solvents with excess supporting electrolyte to prevent high resistivity, whilst the convergent electric field lines (giving rise to radial diffusion) and lower current with microelectrodes allow reliable voltammetric responses in low conductivity solvents such as toluene. This feature allows electroanalytical experiments to be conducted in a wider range of organic solvents, which is of importance when studying redox reactions such as photoredox catalysis.
Case study 16: determining rate constants in nonpolar solvents with microelectrodes. As an example of using microelectrodes, in conjunction with their studies on transmetalation (Fig. 16), Amatore and Pflüger utilised a microelectrode to study the rate of oxidative addition of (Ph3P)4Pd(0) into p-iodotoluene, using toluene as a low dielectric constant solvent (Fig. 19).67 By measuring the limiting current, which results from the oxidation of Pd(0) as a function of time following the addition of the aryliodide, the variation of Pd(0) concentration over time could be plotted (Fig. 19c). Comparing the rate constants obtained with a variety of para-substituted aryliodides enabled the authors to obtain a Hammett correlation with ρ = 2.3 ± 0.2 (Fig. 19d). Interestingly, this Hammett rho value was found to be largely independent of the polarity of the solvent,68 indicating that the transition state of the oxidative addition does not possess significant ionic character.
Fig. 19. (a) Measurement of oxidative addition rates of (Ph3P)4Pd(0), 17, into para-substituted aryliodides in toluene, reported by Amatore and Pflüger. (b) Voltammograms measuring the oxidation of Pd(0) with varying concentrations of 17 at a gold-disk microelectrode. (c) Calculation of the rate constant of oxidative addition for p-iodotoluene by plotting the concentration of 17 against time. (d) Hammett plot of rate constants with different aryliodides. Red arrow in (b) demonstrates the direction of the scan, positive current represents reduction. (b–d) Adapted with permission from ref. 67. Copyright 1990 American Chemical Society.
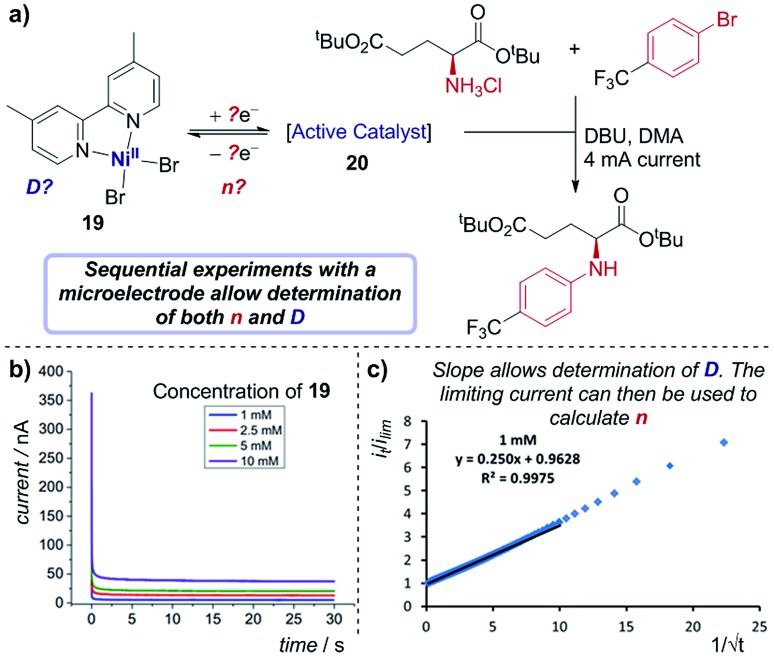
The proportionality in eqn (5) extends beyond just concentration; ilim is also proportional to the number of electrons transferred in the redox event (n) as well as the diffusion coefficient of the redox-active species (D). Therefore, knowledge of two of these parameters allows evaluation of the third. Additionally, following the application of a potential step, a large current is initially observed, before rapidly decaying to the steady-state response (limiting current). Since the time dependent i–t response and the steady state current have different dependencies on D and n, it is possible to determine D by recording the current following a single potential step experiment.69 Knowledge of the diffusion coefficient itself is of significant value in cases where dimers or other higher order complexes may be present.
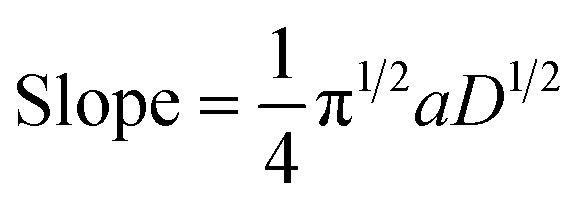
Case study 17: determining the number of electrons transferred in a redox event. The groups of Baran, Minteer, Neurock and White used this process to measure the diffusion coefficient of the nickel precatalyst 19 in their electrochemical aryl amination (Fig. 20),39c and subsequently ascertained the number of electrons transferred in the reduction of the Ni(ii) species. First, the current response of species 19 was recorded upon application of a potential step from a potential at which no redox occurs to a potential sufficient to reduce the complex at a diffusion-limited rate (Fig. 20b). Plotting the variation of current with time (in the form it/ilim against t–1/2, Fig. 20c) gives a straight line with slope given by eqn (6),69
 |
6 |
Fig. 20. (a) Determination of both the diffusion coefficient and number of electrons transferred in the reduction of 19, by the groups of Baran, Minteer, Neurock and White. The current response upon application of a potential step is measured (b), and the slope of the plot in (c) allows determination of the diffusion coefficient. Positive current represents reduction. (b and c) Adapted with permission from ref. 39c. Copyright 2019 American Chemical Society.
With the value of D independently calculated by this method, the authors could then determine that the initial reduction is an apparent two-electron process using eqn (5), which would form the unknown species 20 as a Ni(0) intermediate. Since oxidative addition is postulated to proceed from a Ni(i) species, this suggests that comproportionation of Ni(ii) species 19 and electrogenerated Ni(0) species 20 may lead to the active Ni(i) complex in solution.70
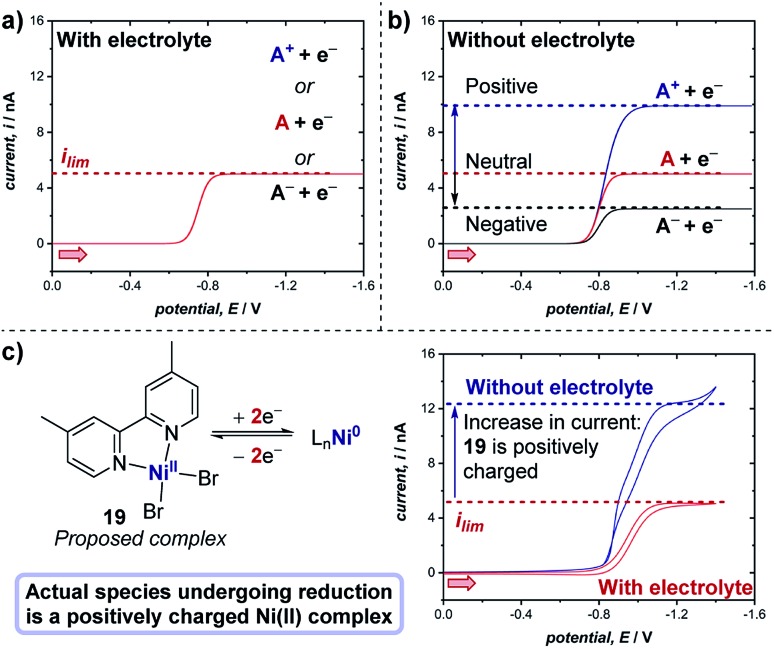
The experiments described above consider the situation in which there is an excess of supporting electrolyte. A unique, especially important and often employed advantage of microelectrodes is the ability to study electrochemical reactions and mechanisms in the absence of any supporting electrolyte. When the supporting electrolyte concentration is lowered, the passage of current through the resistive solution creates an electric field in the solution adjacent to the electrode. For a cathodic reaction (reduction), transport of cationic reactants is enhanced by electrical migration in the field; thus, the limiting current of a positively charged reactant (A+) will increase relative to the limiting current in the presence of excess supporting electrolyte (Fig. 21a and b).71 If the reactant is neutral (A), the voltammetry displays the same limiting current with and without supporting electrolyte. Finally, in the scenario where the reactant in a cathodic reaction is negatively charged (A–), a lower limiting current is observed in experiments without electrolyte.
Fig. 21. Representative microelectrode voltammograms of the reduction of species A with unknown charge at a microelectrode, (a) in the presence of supporting electrolyte, and (b) in the absence of supporting electrolyte, wherein the limiting current of the voltammogram changes depending on the charge of the species undergoing reduction. (c) Measurement of the limiting current of the two-electron reduction of proposed complex 19 (cf., Fig. 20) with and without electrolyte demonstrates that the complex bears a positive charge, by White and co-workers [ref. 72]. Red arrows in figure demonstrate the direction of the scan, positive current represents reduction.
Case study 18: determining the charge of redox-active species. As an example of the utility of this concept in transition metal catalysis, in extension to the study displayed in Fig. 20, White and co-workers studied the two-electron reduction of the purported nickel(ii) complex 19 with and without supporting electrolyte.72 Surprisingly, it was found that the limiting current is higher in the absence of the electrolyte (Fig. 21c), indicating that the complex undergoing reduction is presumably a cationic Ni(ii) species, which does not match the supposed neutral structure of complex 19. Further studies to investigate the precise nature of the Ni(ii) cationic species undergoing reduction are required, but this case study exemplifies the utility of microelectrodes for probing the chemical properties of species in solution.
7. Scanning electrochemical microscopy (SECM)
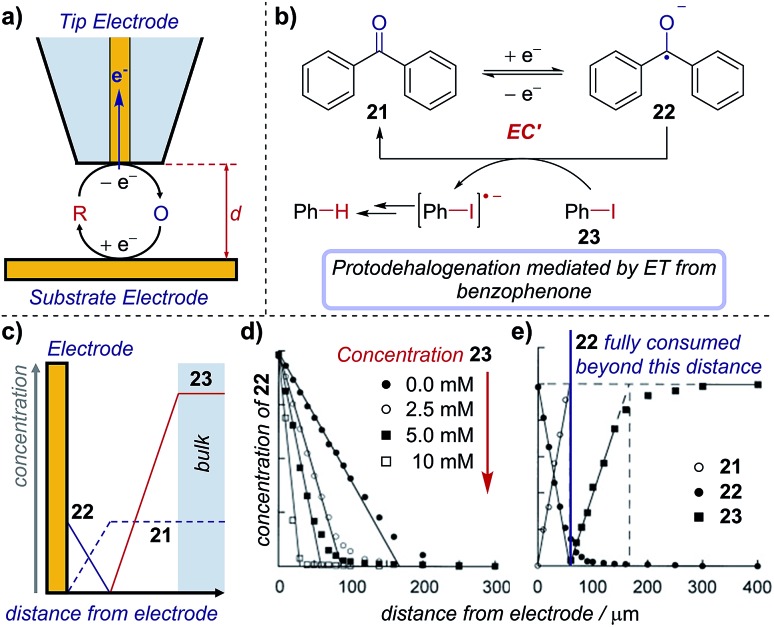
Scanning electrochemical microscopy (SECM) is an electroanalytical tool that allows an experimentalist to position a microelectrode very close to the surface of a second electrode to probe reaction intermediates and/or image active electrocatalytic sites.73 SECM combines the advantages of microelectrodes (see Section 6) with the ability to precisely position the microelectrode ‘tip’ between ∼10 nm and 200 μm from an interface of interest. In an electrosynthetic context, this interface is a second ‘substrate’ electrode (Fig. 22a), where the faradaic current (electron transfer) at the tip functions to probe the concentration/flux of electroactive species. Necessarily, the electrode reaction produces a new species and so the tip can also be considered as a way to ‘inject’ a new species close to the substrate. Appropriate interpretation of the current map close to the substrate electrode gives mechanistic and kinetic insight into reactions and allows the detection of short-lived intermediates that do not make it into bulk solution. To date, while SECM has been used to determine mechanisms of a number of complex inorganic reactions,74 its application in synthetic organic chemistry is essentially untapped.
Fig. 22. (a) Schematic of an SECM set-up, where the distance (d) between the substrate and tip electrodes can be changed to measure concentrations in solution. The concentration profile of species in the mediated reduction of iodobenzene (b), measured by Amatore et al. using SECM. (c) Schematic of concentration profiles. (d) Concentration profile of 22 with varying equivalents of 23, measured by changing the distance (d) between the two electrodes. (e) Comparative concentration profile of various species in solution. (c–e) Adapted with permission from ref. 75. Copyright 2001 John Wiley and Sons.
Case study 19: determining concentration profiles of species in solution. As an illustration of the utility of this technique, Amatore et al. used SECM to monitor the catalytic reduction of aryl halides mediated by benzophenone (Fig. 22b).75 The concentrations of electroactive species close to the substrate electrode are influenced by the electrode redox reaction, further chemical reactions in the solution, and transport processes in solution (for schematic concentration profiles, see Fig. 22c). When benzophenone reduction occurs in the absence of the aryl halide, chemical reactions in the solution need not be considered. The concentration of the intermediate (benzophenone radical anion, 22) is highest at the electrode surface and diminishes towards bulk solution (Fig. 22d, closed black circles), whereas the reactant (benzophenone, 21) displays the opposite trend, being lowest at the electrode surface (typically zero, when the reaction is transport-limited) and increasing to its bulk concentration far away. This control experiment provides information on how species are transported to/from the electrode.
With the introduction of iodobenzene 23, electron transfer from the benzophenone radical anion to iodobenzene decreases the concentration of 22, regenerates the reactant mediator and generates a new species (ArI˙–), which also diffuses away from the electrode. Subsequent cleavage of the carbon–iodine bond affords an aryl radical, which undergoes further reduction and protonation to yield the protodehalogenated arene. Electrochemical quantification of the product of the redox reaction (the benzophenone radical anion, 22) and/or that of any of the following reactions using the tip microelectrode creates a map of the species present at various distances from the electrode, as shown in Fig. 22d and e. Accordingly, it was found that the benzophenone radical anion 22 concentration decreases concomitantly with distance as it reacts with iodobenzene. Additionally, only when the benzophenone radical anion supplied at the electrode is exhausted does the iodobenzene 23 concentration increase above baseline, which occurs further from the electrode (within ∼50 μm, Fig. 22e) with a 5 mM iodobenzene concentration than with 10 mM (∼30 μm, not shown), as would be expected.
With careful analysis, these concentration profiles can be used to probe the mechanism and measure the reaction rate, and also to identify the presence of intermediates. Importantly, the creation of high concentrations of reactive intermediates close to the electrode as seen here must be considered when designing a synthetic electrochemical reaction, especially when compared with other methodologies, such as photoredox catalysis, which create uniformly low concentrations of reactive intermediates in solution. It is also of note that the steady-state diffusion reaction layer, which is formed by this catalytic mechanism, results in the plateau current response observed in a CV of this EC′ system (cf., Section 2.4).
Converting concentration maps to a detailed mechanism often involves creating a model describing the pertinent physical processes (reactions at the electrode/in solution, and transport) and comparing the results to those from experiments (see Section 9). In this process, physical parameters are determined from complementary experiments, and the expected results are calculated for a range of unknown values (e.g., varying the reaction rate). The results are then compared with experiments, with a good match implying a plausible scheme has been successfully determined. The physical model is adjusted to reflect the chemical reactivity and can describe processes such as irreversible reactions, dimerisation, and disproportionation.76 Li and Unwin applied these techniques to measuring the kinetics of electron transfer from a photo-excited *[Ru(bpy)3]2+ species at a liquid/liquid interface,77 demonstrating the potential applicability to the field of photoredox catalysis.
A powerful corollary of placing the tip electrode so close to the substrate electrode is that one can detect short-lived intermediates before they have the opportunity to react. The characteristic distance, L, that a species diffuses in a time t is given by eqn (7),
| L2 = 2Dt | 7 |
such that, for a typical value of a diffusion coefficient (D = 1 × 10⁻⁵ cm2 s–1) and a tip positioned L = 10 nm from a substrate electrode, the technique is sensitive to species with lifetimes in the order of t > 50 ns. Similarly, at a distance of 100 μm the technique is sensitive to species with lifetimes 8 orders of magnitude longer, showcasing the wide dynamic range of this technique.
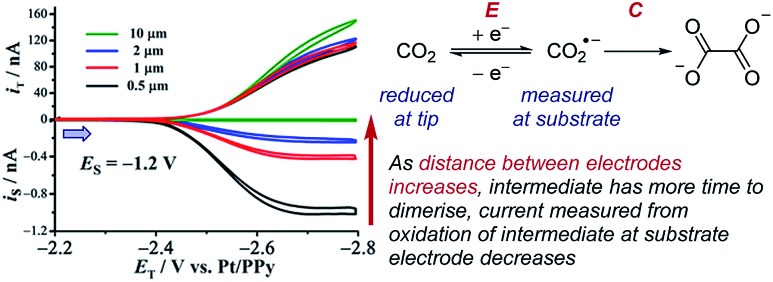
Case study 20: identifying very short-lived species in solution. An example of the observation of a short-lived species is the detection of the CO2˙– radical anion reported by Bard and co-workers (Fig. 23).78 This radical anion dimerises to form oxalate (C2O42–) with a half-life of 10 ns and a rate constant of (6.0 × 10⁸ M–1 s–1), making this measurement inaccessible to many conventional techniques. When the SECM electrodes are separated by 0.5 μm, current at the substrate electrode was observed corresponding to re-oxidation of most of the CO2˙–, which was generated at the tip electrode. However, upon increasing the separation of the electrodes to 10 μm, the substrate electrode current drops to zero as a result of complete dimerisation of the radical anion in the time taken to travel between the two electrodes. SECM is thus an effective way to identify and quantify the reactivity of highly reactive species with short half-lives in solution.
Fig. 23. SECM study of the reduction of carbon dioxide allows detection of the short-lived radical anion intermediate, reported by Bard and co-workers. Blue arrow in figure demonstrates the direction of the scan, positive current represents reduction. Adapted with permission from ref. 78a. Copyright 2017 American Chemical Society.
8. Bipolar electrochemistry
One key constraint in monitoring reactions which are not electrochemical (such as photoredox catalysis, or other redox processes) with electroanalytical techniques is the requirement for large concentrations of supporting electrolyte which may not be present in the native reaction. As such, it's ambiguous whether the mechanism studied under an electroanalytical setting is also applicable to the mechanism in an alternative set-up. In order to use a low concentration of electrolyte, electroanalytical studies may be conducted using a microelectrode (see Section 6). An alternative technique that may serve to overcome this issue is bipolar electrochemistry, in which bipolar electrodes (BPEs) are leveraged.79
A BPE generally refers to a conducting material in an electrolyte solution which, when exposed to an external electrical field applied by driving electrodes, can facilitate both reduction and oxidation at differing positions on its surface (Fig. 24a). A linear potential profile develops when the channel resistance or the solution resistance is high, separating a single BPE into cathodic and anodic poles. This can be achieved either by restricting the cross-sectional area of the solution (e.g., microfluidics) or using a low conductive electrolyte in an open channel. The fraction of the potential dropped over a BPE (ΔUBPE) can be estimated by eqn (8),
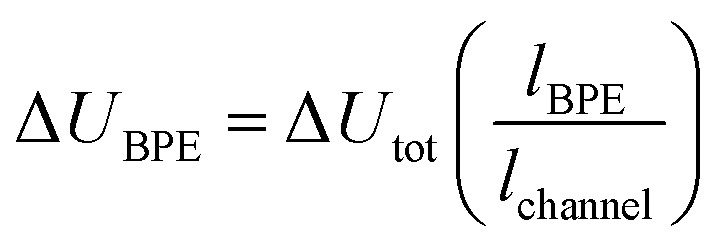 |
8 |
Fig. 24. (a) Schematic of a bipolar electrochemical set-up, demonstrating the formation of anodic and cathodic poles on a bipolar electrode (BPE). (b) Schematic of a split-bipolar electrode in a U-type cell. (c) Fluorination of triphenylmethane can occur at low concentrations of electrolyte solution utilising a BPE set-up, reported by Inagi and co-workers [ref. 83; poly(ethylene glycol) (PEG) additive required to solubilise CsF in acetonitrile].
Reactions occur at the BPE when the magnitude of ΔUBPE provides sufficient overpotential to simultaneously reduce/oxidise available redox species. Bipolar electrochemistry offers advantages in electrocatalyst screening by allowing arrays of multiple ‘wireless’ electrodes to be incorporated in a single device. For instance, it is reported that by using a BPE array, Crooks and co-workers were able to simultaneously screen 33 different heterogeneous electrocatalyst candidates in about 10 min,80 a technique which could be applied to rapid screening and optimization in organic redox catalysis at a surface. Additionally, the interfacial potential difference is highest at the ends of the BPE, whilst attenuating gradually towards the middle, generating molecular gradients for material functionalisation.81
Although BPEs have been investigated in the electrosynthesis of conducting polymers,82 applications in organic synthesis remain rare, principally due to the difficulty of in situ monitoring of the current.
Case study 21: applications of BPEs in organic chemistry. To overcome this problem, Inagi and co-workers applied split-BPEs in a U-type cell such that the electrical current could be monitored (Fig. 24b).83 An insulator shielding wall was introduced in the middle of the BPEs to further augment the potential drop around the split electrodes.84 This set-up enabled the optimisation of the oxidative fluorination of triphenylmethane (Fig. 24c).83 Specifically, the supporting CsF electrolyte (and F– source) could be used at concentrations of only 1 mM, whilst typically 100 mM or more supporting electrolyte is often required. Conducting a reaction in a low supporting electrolyte concentration such as this could provide alternative options in both organic synthesis and analysis.85
9. Electrochemical simulations
In electrochemical experiments, the measured signal (e.g., the current as a function of voltage in CV) is frequently not the quantity of interest, and additional interpretation steps may be necessary to gain chemical insight. Sometimes interpretation is straightforward – a current can be related to the concentration of a species through a calibration curve (see Section 7), or an equation relating experimental and physical parameters may have previously been published. However, when neither is possible, modelling/simulation of the experiment offers a solution.4a,86
In this context, we use modelling to mean the formulation of a physical description of the important phenomena occurring during an experiment. The model allows prediction of the experimental response as a function of the experimental conditions and physical unknowns. Comparison of real and simulated experimental results is performed, with a good match indicating that the model plausibly describes the experiment.
The particulars of the model depend on the experiment, but will frequently describe: reactions at the electrode surface and in solution, the geometry of the electrode, and the transport of species (diffusion/convection/migration). Descriptive parameters (reaction rates, transport parameters, etc.) may come from complementary experiments or literature values, but if a parameter is unknown it can be varied in the simulation to match experiment. When the mechanism is unknown, hypothesised mechanisms are simulated and the results compared to experimental results.
While forming a model may sound like a daunting task, fortunately, a number of software packages exist in which the transport and other equations are inbuilt, as are the numerical algorithms required to solve them.87 Additionally, many of the commercially-available potentiostats have integrated simulation and fitting software functions built-in. In the simplest case, modelling is reduced to describing the reactions and choosing the electrode geometry from a drop-down list. The output of the model extends beyond just the experimental measurable (current/voltage), to include quantities that would be challenging to attain experimentally, such as the concentration distribution of species as a function of distance from the electrode surface (see Fig. 22).75
It is important to note that when modelling, the output is only as good as the foundations (assumptions) upon which is it built – chemical knowledge is encoded into the model description. If none of the tested mechanisms fit the data, or the data doesn't correspond to chemical intuition, then an alternative mechanism or other assumption is required. Moreover, if multiple models deliver predictions matching the experimental data, the model alone is insufficient to eliminate either possibility, and experiments to discriminate scenarios might be required.
10. Conclusions
The breadth of electroanalytical tools showcased herein provide a multitude of possibilities for investigating complex reaction mechanisms. Importantly, many of these versatile techniques can be simultaneously used for multiple purposes (e.g., determination of thermodynamic and kinetic properties) and are available with minimal experimental set-up required. Specifically, voltammetric techniques allow rapid determination of redox potentials, speciation, equilibria, catalysis and kinetics of intermediates that may otherwise be too short-lived to study by alternative spectroscopic techniques. In making a choice of a suitable electrode (macro-, micro- or rotating disk) for a desired measurement, it is important to consider both the timescale of the experiment and the conductivity of the solution (i.e., a microelectrode is required for low conductivity solvents). More sophisticated set-ups in spectroelectrochemistry, scanning electrochemical microscopy and specialised electrodes provide additional techniques to access the answers to key mechanistic questions, albeit with the caveat that they are not commonplace equipment in a synthetic laboratory. Where more detailed analysis of experimental data is required, simulations allow different mechanistic scenarios to be tested against experimental results.
Since this perspective is designed to provide case studies of mechanistic probes, detailed discussions of experimental set-ups and theoretical treatments of the techniques have not been included. For further reading, we direct the interested reader specifically to the following key selected reviews and books:
CV basics and experimental set-up: ref. 5b and c.
Theory of CV: ref. 4a (chapter 6).
Coupled chemical reactions: ref. 4a (chapter 12) and ref. 5a (chapter 2).
Measurements of catalysis: ref. 4f and ref. 5a (chapter 4).
Pulsed voltammetry: ref. 4a (chapter 7).
Spectroelectrochemistry: ref. 4a (chapter 17) and ref. 43b.
RDEs: ref. 4a (chapter 9).
Microelectrodes: ref. 65a and b.
SECM: ref. 73a and b.
Bipolar electrochemistry: ref. 79a.
Electrochemical simulations: ref. 4a (Appendix B) and ref. 86a.
Whilst many of the reactions discussed are electrochemical in nature, it is important to note that these techniques can be applied to study mechanisms in alternative redox processes, including photoredox catalysis. To this end, we envision that electroanalytical tools will become commonplace in studying synthetic organic and organometallic reaction mechanisms in the near future.
Conflicts of interest
There are no conflicts to declare.
Acknowledgments
The authors would like to thank the National Science Foundation Center for Synthetic Organic Electrosynthesis for funding (CHE-1740656). C. S. thanks the EU for Horizon 2020 Marie Skłodowska-Curie Fellowship (Grant No. 789399).
References
- Yan M., Lo J. C., Edwards J. T., Baran P. S. J. Am. Chem. Soc. 2016;138:12692–12714. doi: 10.1021/jacs.6b08856. [DOI] [PMC free article] [PubMed] [Google Scholar]
- (a) Shaw M. H., Twilton J., MacMillan D. W. C. J. Org. Chem. 2016;81:6898–6926. doi: 10.1021/acs.joc.6b01449. [DOI] [PMC free article] [PubMed] [Google Scholar]; (b) Skubi K. L., Blum T. R., Yoon T. P. Chem. Rev. 2016;116:10035–10074. doi: 10.1021/acs.chemrev.6b00018. [DOI] [PMC free article] [PubMed] [Google Scholar]; (c) Romero N. A., Nicewicz D. A. Chem. Rev. 2016;116:10075–10166. doi: 10.1021/acs.chemrev.6b00057. [DOI] [PubMed] [Google Scholar]; (d) Staveness D., Bosque I., Stephenson C. R. J. Acc. Chem. Res. 2016;49:2295–2306. doi: 10.1021/acs.accounts.6b00270. [DOI] [PMC free article] [PubMed] [Google Scholar]
- (a) Yan M., Kawamata Y., Baran P. S. Chem. Rev. 2017;117:13230–13319. doi: 10.1021/acs.chemrev.7b00397. [DOI] [PMC free article] [PubMed] [Google Scholar]; (b) Möhle S., Zirbes M., Rodrigo E., Gieshoff T., Wiebe A., Waldvogel S. R. Angew. Chem., Int. Ed. 2018;57:6018–6041. doi: 10.1002/anie.201712732. [DOI] [PMC free article] [PubMed] [Google Scholar]; (c) Kärkäs M. D. Chem. Soc. Rev. 2018;47:5786–5865. doi: 10.1039/c7cs00619e. [DOI] [PubMed] [Google Scholar]
- (a) Bard A. J. and Faulkner L. R., Electrochemical Methods, John Wiley & Sons, Inc., Hoboken NJ, 2nd edn, 2001. [Google Scholar]; (b) Organic Electrochemistry, ed. O. Hammerich and B. Speiser, Taylor & Francis Group, Boca Raton FL, 5th edn, 2016. [Google Scholar]; (c) Jutand A. Chem. Rev. 2008;108:2300–2347. doi: 10.1021/cr068072h. [DOI] [PubMed] [Google Scholar]; (d) Savéant J.-M. Chem. Rev. 2008;108:2348–2378. doi: 10.1021/cr068079z. [DOI] [PubMed] [Google Scholar]; (e) Costentin C., Drouet S., Passard G., Robert M., Savéant J.-M. J. Am. Chem. Soc. 2013;135:9023–9031. doi: 10.1021/ja4030148. [DOI] [PubMed] [Google Scholar]; (f) Rountree E. S., McCarthy B. D., Eisenhart T. T., Dempsey J. L. Inorg. Chem. 2014;53:9983–10002. doi: 10.1021/ic500658x. [DOI] [PubMed] [Google Scholar]; (g) Rountree E. S., Martin D. J., McCarthy B. D., Dempsey J. L. ACS Catal. 2016;6:3326–3335. [Google Scholar]; (h) Elgrishi N., McCarthy B. D., Rountree E. S., Dempsey J. L. ACS Catal. 2016;6:3644–3659. [Google Scholar]; (i) Passard G., Ullman A. M., Brodsky C. N., Nocera D. G. J. Am. Chem. Soc. 2016;138:2925–2928. doi: 10.1021/jacs.5b12828. [DOI] [PubMed] [Google Scholar]; (j) Costentin C., Robert M., Savéant J.-M. Curr. Opin. Electrochem. 2017;2:26–31. [Google Scholar]
- (a) Savéant J.-M., Elements of Molecular and Biomolecular Electrochemistry, John Wiley & Sons, Inc., Hoboken NJ, 2006. [Google Scholar]; (b) Elgrishi N., Rountree K. J., McCarthy B. D., Rountree E. S., Eisenhart T. T., Dempsey J. L. J. Chem. Educ. 2018;95:197–206. [Google Scholar]; (c) Graham D. J., Standard Operating Procedures for Cyclic Voltammetry, 2nd edn, 2018. [Google Scholar]
- (a) Wallentin C.-J., Nguyen J. D., Finkbeiner P., Stephenson C. R. J. J. Am. Chem. Soc. 2012;134:8875–8884. doi: 10.1021/ja300798k. [DOI] [PubMed] [Google Scholar]; (b) Hamilton D. S., Nicewicz D. A. J. Am. Chem. Soc. 2012;134:18577–18580. doi: 10.1021/ja309635w. [DOI] [PMC free article] [PubMed] [Google Scholar]; (c) Prier C. K., Rankic D. A., MacMillan D. W. C. Chem. Rev. 2013;113:5322–5363. doi: 10.1021/cr300503r. [DOI] [PMC free article] [PubMed] [Google Scholar]; (d) Musacchio A. J., Nguyen L. Q., Beard G. H., Knowles R. R. J. Am. Chem. Soc. 2014;136:12217–12220. doi: 10.1021/ja5056774. [DOI] [PubMed] [Google Scholar]
- (a) Tyson E. L., Niemeyer Z. L., Yoon T. P. J. Org. Chem. 2014;79:1427–1436. doi: 10.1021/jo500031g. [DOI] [PMC free article] [PubMed] [Google Scholar]; (b) Kawamata Y., Yan M., Liu Z., Bao D.-H., Chen J., Starr J. T., Baran P. S. J. Am. Chem. Soc. 2017;139:7448–7451. doi: 10.1021/jacs.7b03539. [DOI] [PMC free article] [PubMed] [Google Scholar]; (c) Wang F., Rafiee M., Stahl S. S. Angew. Chem., Int. Ed. 2018;57:6686–6690. doi: 10.1002/anie.201803539. [DOI] [PMC free article] [PubMed] [Google Scholar]; (d) Lennox A. J. J., Goes S. L., Webster M. P., Koolman H. F., Djuric S. W., Stahl S. S. J. Am. Chem. Soc. 2018;140:11227–11231. doi: 10.1021/jacs.8b08145. [DOI] [PMC free article] [PubMed] [Google Scholar]
- (a) Fidaly K., Ceballos C., Falguières A., Veitia M. S.-I., Guy A., Ferroud C. Green Chem. 2012;14:1293–1297. [Google Scholar]; (b) Ghosh I., Shaikh R. S., König B. Angew. Chem., Int. Ed. 2017;56:8544–8549. doi: 10.1002/anie.201703004. [DOI] [PubMed] [Google Scholar]
- (a) Connelly N. G., Geiger W. E. Chem. Rev. 1996;96:877–910. doi: 10.1021/cr940053x. [DOI] [PubMed] [Google Scholar]; (b) Kuroboshi M., Tanaka M., Kishimoto S., Goto K., Mochizuki M., Tanaka H. Tetrahedron Lett. 2000;41:81–84. [Google Scholar]; (c) Murphy J. A. J. Org. Chem. 2014;79:3731–3746. doi: 10.1021/jo500071u. [DOI] [PMC free article] [PubMed] [Google Scholar]
- Roth H. G., Romero N. A., Nicewicz D. A. Synlett. 2016;27:714–723. [Google Scholar]
- (a) Yang Q.-L., Wang X.-Y., Lu J.-Y., Zhang L.-P., Fang P., Mei T.-S. J. Am. Chem. Soc. 2018;140:11487–11494. doi: 10.1021/jacs.8b07380. [DOI] [PubMed] [Google Scholar]; (b) Payard P.-A., Perego L. A., Ciofini I., Grimaud L. ACS Catal. 2018;8:4812–4823. [Google Scholar]; (c) Qiu Y., Scheremetjew A., Ackermann L. J. Am. Chem. Soc. 2019;141:2731–2738. doi: 10.1021/jacs.8b13692. [DOI] [PubMed] [Google Scholar]
- ; see also: ; (a) Liedtke T., Spannring P., Riccardi L., Gansäuer A. Angew. Chem., Int. Ed. 2018;57:5006–5010. doi: 10.1002/anie.201800731. [DOI] [PubMed] [Google Scholar]; (b) Richrath R. B., Olyschläger T., Hildebrandt S., Enny D. G., Fianu G. D., Flowers R. A., Gansäuer A. Chem.–Eur. J. 2018;24:6371–6379. doi: 10.1002/chem.201705707. [DOI] [PubMed] [Google Scholar]
- Gieshoff T., Kehl A., Schollmeyer D., Moeller K. D., Waldvogel S. R. J. Am. Chem. Soc. 2017;139:12317–12324. doi: 10.1021/jacs.7b07488. [DOI] [PubMed] [Google Scholar]
- Speckmeier E., Fuchs P. J. W., Zeitler K. Chem. Sci. 2018;9:7096–7103. doi: 10.1039/c8sc02106f. [DOI] [PMC free article] [PubMed] [Google Scholar]
- Siu J. C., Sauer G. S., Saha A., Macey R. L., Fu N., Chauviré T., Lancaster K. M., Lin S. J. Am. Chem. Soc. 2018;140:12511–12520. doi: 10.1021/jacs.8b06744. [DOI] [PMC free article] [PubMed] [Google Scholar]
- ; see also: ; (a) Xu H.-C., Moeller K. D. Angew. Chem., Int. Ed. 2010;49:8004–8007. doi: 10.1002/anie.201003924. [DOI] [PMC free article] [PubMed] [Google Scholar]; (b) Moeller K. D., Tinao L. V. J. Am. Chem. Soc. 1992;114:1033–1041. [Google Scholar]
- (a) Martin D. J., McCarthy B. D., Rountree E. S., Dempsey J. L. Dalton Trans. 2016;45:9970–9976. doi: 10.1039/c6dt00302h. [DOI] [PubMed] [Google Scholar]; (b) Lee C. H., Villágran D., Cook T. R., Peters J. C., Nocera D. G. ChemSusChem. 2013;6:1541–1544. doi: 10.1002/cssc.201300068. [DOI] [PubMed] [Google Scholar]
- Kaeffer N., Morozan A., Fize J., Martinez E., Guetaz L., Artero V. ACS Catal. 2016;6:3727–3737. [Google Scholar]
- The exact CV response of an EC′ mechanism is dependent on multiple variables, and so the existence of the plateau current and exact shape of the CV wave is complicated and beyond the scope of this review. Indeed, the exemplar CV in Fig. 7a does not possess overlapping forward and reverse scans indicative of zone KS (S-shaped, pure kinetic conditions, no substrate consumption) in the kinetic zone diagram developed by Savéant and co-workers in: Savéant J.-M., Su K. B., J. Electroanal. Chem. Interfacial Electrochem., 1984, 171 , 341 –349 , . Additionally, the plateau current in Fig. 7a is obscured by the appearance of a second redox feature occuring at more negative potentials. For further reading on the kinetic zone diagram, see also ref. 4f and 5a . [Google Scholar]
- Hickey D. P., Sandford C., Rhodes Z., Gensch T., Fries L. R., Sigman M. S., Minteer S. D. J. Am. Chem. Soc. 2019;141:1382–1392. doi: 10.1021/jacs.8b12634. [DOI] [PubMed] [Google Scholar]
- Mack J. B. C., Walker K. L., Robinson S. G., Zare R. N., Sigman M. S., Waymouth R. M., Du Bois J. J. Am. Chem. Soc. 2019;141:972–980. doi: 10.1021/jacs.8b10950. [DOI] [PubMed] [Google Scholar]
- Hickey D. P., McCammant M. S., Giroud F., Sigman M. S., Minteer S. D. J. Am. Chem. Soc. 2014;136:15917–15920. doi: 10.1021/ja5098379. [DOI] [PubMed] [Google Scholar]
- Yayla H. G., Peng F., Mangion I. K., McLaughlin M., Campeau L.-C., Davies I. W., DiRocco D. A., Knowles R. R. Chem. Sci. 2016;7:2066–2073. doi: 10.1039/c5sc03350k. [DOI] [PMC free article] [PubMed] [Google Scholar]
- At 25 °C, where n is the number of electrons transferred in the redox event, A is the surface area of the electrode in cm2, D is the diffusion coefficient in cm2 s–1, ν is the scan rate in V s–1
- Buriez O., Nédélec J.-Y., Périchon J. J. Electroanal. Chem. 2001;506:162–169. [Google Scholar]
- It should be noted that the E step is actually better described as EC, corresponding to the reduction of the metal followed by a chemical step(s) involving loss of Br– and ligation of acetonitrile. Since these chemical steps are likely to be fast and are not observed in the voltammetry, we have opted to define this as an E step for simplicity
- (a) Bediako D. K., Surendranath Y., Nocera D. G. J. Am. Chem. Soc. 2013;135:3662–3674. doi: 10.1021/ja3126432. [DOI] [PubMed] [Google Scholar]; (b) Roy S., Sharma B., Pécaut J., Simon P., Fontecave M., Tran P. D., Derat E., Artero V. Chem. Sci. 2017;139:3685–3696. doi: 10.1021/jacs.6b11474. [DOI] [PubMed] [Google Scholar]; (c) Costentin C., Nocera D. G., Brodsky C. N. Proc. Natl. Acad. Sci. U. S. A. 2017;114:11303–11308. doi: 10.1073/pnas.1711129114. [DOI] [PMC free article] [PubMed] [Google Scholar]; (d) Oldacre A. N., Friedman A. E., Cook T. R. J. Am. Chem. Soc. 2017;139:1424–1427. doi: 10.1021/jacs.6b12404. [DOI] [PubMed] [Google Scholar]
- Badalyan A., Stahl S. S. Nature. 2016;535:406–410. doi: 10.1038/nature18008. [DOI] [PubMed] [Google Scholar]
- Costentin C., Savéant J.-M. ChemElectroChem. 2014;1:1226–1236. [Google Scholar]
- Where n is the number of electrons transferred in the redox event, F is Faraday's constant, A is the surface area of the electrode in cm2, D is the diffusion coefficient in cm2 s–1, ν is the scan rate in V s–1, R is the gas constant, and T is the temperature in K
- Luo J., Hu B., Sam A., Liu T. L. Org. Lett. 2018;20:361–364. doi: 10.1021/acs.orglett.7b02483. [DOI] [PubMed] [Google Scholar]
- Costentin C., Savéant J.-M. J. Am. Chem. Soc. 2018;140:16669–16675. doi: 10.1021/jacs.8b09154. [DOI] [PubMed] [Google Scholar]
- Pegis M. L., McKeown B. A., Kumar N., Lang K., Wasylenko D. J., Zhang X. P., Raugei S., Mayer J. M. ACS Cent. Sci. 2016;2:850–856. doi: 10.1021/acscentsci.6b00261. [DOI] [PMC free article] [PubMed] [Google Scholar]
- Fry A. J., Little R. D., Leonetti J. J. Org. Chem. 1994;59:5017–5026. [Google Scholar]
- Costentin C., Passard G., Robert M., Savéant J.-M. Chem. Sci. 2013;4:819–823. [Google Scholar]
- Nadjo L., Savéant J.-M. J. Electroanal. Chem. Interfacial Electrochem. 1973;48:113–145. [Google Scholar]
- (a) Osteryoung R. A., Lauer G., Anson F. C. J. Electrochem. Soc. 1963;110:926–932. [Google Scholar]; (b) Osteryoung J. G., Osteryoung R. A. Anal. Chem. 1985;57:101–110. [Google Scholar]; (c) Molina A., González J., Laborda E., Wang Y., Compton R. G. Phys. Chem. Chem. Phys. 2011;13:16748–16755. doi: 10.1039/c1cp22032b. [DOI] [PubMed] [Google Scholar]
- (a) Mo J.-W., Ogorevc B. Anal. Chem. 2001;73:1196–1202. doi: 10.1021/ac0010882. [DOI] [PubMed] [Google Scholar]; (b) Özkan S. A., Uslu B., Aboul-Enein H. Y. Crit. Rev. Anal. Chem. 2003;33:155–181. [Google Scholar]; (c) Beitollahi H., Karimi-Maleh H., Khabazzadeh H. Anal. Chem. 2008;80:9848–9851. doi: 10.1021/ac801854j. [DOI] [PubMed] [Google Scholar]; (d) Mirceski V., Gulaboski R., Lovric M., Bogeski I., Kappl R., Hoth M. Electroanalysis. 2013;25:2411–2422. [Google Scholar]
- (a) Janeiro P., Oliveira Brett A. M. Anal. Chim. Acta. 2004;518:109–115. doi: 10.1016/j.aca.2008.10.002. [DOI] [PubMed] [Google Scholar]; (b) Wang Y., Laborda E., Compton R. G. J. Electroanal. Chem. 2012;670:56–61. [Google Scholar]; (c) Kawamata Y., Vantourout J. C., Hickey D. P., Bai P., Chen L., Hou Q., Qiao W., Barman K., Edwards M. A., Garrido-Castro A. F., deGruyter J. N., Nakamura H., Knouse K., Qin C., Clay K. J., Bao D., Li C., Starr J. T., Garcia-Irizarry C., Sach N., White H. S., Neurock M., Minteer S. D., Baran P. S. J. Am. Chem. Soc. 2019;141:6392–6402. doi: 10.1021/jacs.9b01886. [DOI] [PMC free article] [PubMed] [Google Scholar]
- (a) Aoki K., Maeda K., Osteryoung J. G. J. Electroanal. Chem. Interfacial Electrochem. 1989;272:17–28. [Google Scholar]; (b) Brookes B. A., Ball J. C., Compton R. G. J. Phys. Chem. B. 1999;103:5289–5295. [Google Scholar]
- Peters B. K., Rodriguez K. X., Reisberg S. H., Beil S. B., Hickey D. P., Kawamata Y., Collins M., Starr J., Chen L., Udyavara S., Klunder K., Gorey T. J., Anderson S. L., Neurock M., Minteer S. D., Baran P. S. Science. 2019;363:838–845. doi: 10.1126/science.aav5606. [DOI] [PMC free article] [PubMed] [Google Scholar]
- Macfie G., Atherton J. H., Compton R. G. Electroanalysis. 2002;14:479–485. [Google Scholar]
- (a) Neudeck A., Marken F. and Compton R. G., in Electroanalytical Methods: Guide to Experiments and Applications, ed. F. Scholz, Springer Berlin Heidelberg, Berlin, Heidelberg, 2002, pp. 167–189. [Google Scholar]; (b) Kaim W., Fiedler J. Chem. Soc. Rev. 2009;38:3373–3382. doi: 10.1039/b504286k. [DOI] [PubMed] [Google Scholar]
- (a) Flowers P. A., Callender S.-A. Anal. Chem. 1996;68:199–202. doi: 10.1021/ac950580w. [DOI] [PubMed] [Google Scholar]; (b) Wang Z., Zhang Y., Liu B., Wu K., Thevuthasan S., Baer D. R., Zhu Z., Yu X.-Y., Wang F. Anal. Chem. 2017;89:960–965. doi: 10.1021/acs.analchem.6b04189. [DOI] [PubMed] [Google Scholar]; (c) Cao S.-H., Liu S., Sun H.-J., Huang L., Ni Z.-R., Jiang W.-L., Zhan M., Zhou Z.-Y., Sun S.-G., Chen Z. Anal. Chem. 2019;91:1686–1691. doi: 10.1021/acs.analchem.8b04006. [DOI] [PubMed] [Google Scholar]
- León L., Mozo J. D. TrAC, Trends Anal. Chem. 2018;102:147–169. [Google Scholar]
- (a) Humphrey B. D., Sinha S., Bocarsly A. B. J. Phys. Chem. 1984;88:736–743. [Google Scholar]; (b) Hinman A. S., Pavelich B. J. Can. J. Chem. 1987;65:919–923. [Google Scholar]
- (a) Khoury Y. E., Van Wilderen L. J. G., Vogt T., Winter E., Bredenbeck J. Rev. Sci. Instrum. 2015;86:083102. doi: 10.1063/1.4927533. [DOI] [PubMed] [Google Scholar]; (b) Lotti D., Hamm P., Kraack J. P. J. Phys. Chem. C. 2016;120:2883–2892. [Google Scholar]
- Sun R., Qin Y., Ruccolo S., Schnedermann C., Costentin C., Nocera D. G. J. Am. Chem. Soc. 2019;141:89–93. doi: 10.1021/jacs.8b11262. [DOI] [PubMed] [Google Scholar]
- Terrett J. A., Cuthbertson J. D., Shurtleff V. W., MacMillan D. W. C. Nature. 2015;524:330–334. doi: 10.1038/nature14875. [DOI] [PMC free article] [PubMed] [Google Scholar]
- Liu Q., Sun B., Liu Z., Kao Y., Dong B.-W., Jiang S.-D., Li F., Liu G., Yang Y., Mo F. Chem. Sci. 2018;9:8731–8737. doi: 10.1039/c8sc03346c. [DOI] [PMC free article] [PubMed] [Google Scholar]
- (a) Jurva U., Wikström H. V., Bruins A. P. Rapid Commun. Mass Spectrom. 2000;14:529–533. doi: 10.1002/(SICI)1097-0231(20000331)14:6<529::AID-RCM904>3.0.CO;2-H. [DOI] [PubMed] [Google Scholar]; (b) Permentier H. P., Bruins A. P. J. Am. Soc. Mass Spectrom. 2004;15:1707–1716. doi: 10.1016/j.jasms.2004.09.003. [DOI] [PubMed] [Google Scholar]
- Baltruschat H. J. Am. Soc. Mass Spectrom. 2004;15:1693–1706. doi: 10.1016/j.jasms.2004.09.011. [DOI] [PubMed] [Google Scholar]
- Brown T. A., Chen H., Zare R. N. Angew. Chem., Int. Ed. 2015;54:11183–11185. doi: 10.1002/anie.201506316. [DOI] [PubMed] [Google Scholar]
- (a) Compton R. G., Laing M. E., Mason D., Northing R. J., Unwin P. R., Rowlinson John S. Proc. R. Soc. London, B. 1988;418:113–154. [Google Scholar]; (b) Dalton F. Electrochem. Soc. Interface. 2016;25:50–59. [Google Scholar]
- Where F is Faraday’s constant, A is the surface area of the electrode in cm2, ν is the kinematic viscosity in cm2 s–1, C is the concentration of the redox-active species in mol cm–3
- Treimer S., Tang A., Johnson D. C. Electroanalysis. 2002;14:165–171. [Google Scholar]
- Amatore C., Jutand A., Le Duc G. Chem.–Eur. J. 2011;17:2492–2503. doi: 10.1002/chem.201001911. [DOI] [PubMed] [Google Scholar]
- Lennox A. J. J., Lloyd-Jones G. C. Angew. Chem., Int. Ed. 2013;52:7362–7370. doi: 10.1002/anie.201301737. [DOI] [PubMed] [Google Scholar]
- (a) Carrow B. P., Hartwig J. F. J. Am. Chem. Soc. 2011;133:2116–2119. doi: 10.1021/ja1108326. [DOI] [PMC free article] [PubMed] [Google Scholar]; (b) Thomas A. A., Denmark S. E. Science. 2016;352:329–332. doi: 10.1126/science.aad6981. [DOI] [PubMed] [Google Scholar]
- (a) Amatore C., Jutand A., Le Duc G. Chem.–Eur. J. 2012;18:6616–6625. doi: 10.1002/chem.201200516. [DOI] [PubMed] [Google Scholar]; (b) Amatore C., Le Duc G., Jutand A. Chem.–Eur. J. 2013;19:10082–10093. doi: 10.1002/chem.201300177. [DOI] [PubMed] [Google Scholar]
- (a) Prater K. B., Bard A. J. J. Electrochem. Soc. 1970;117:1517–1520. [Google Scholar]; (b) Du C., Tan Q., Yin G., Zhang J., Xing W., Yin G. and Zhang J., in Rotating Electrode Methods and Oxygen Reduction Electrocatalysts, Elsevier, Amsterdam, 2014, pp. 171–198. [Google Scholar]
- (a) van Andel-Scheffer P. J. M., Wonders A. H., Barendrecht E. J. Electroanal. Chem. 1994;366:143–146. [Google Scholar]; (b) Zhang C., Yang J., Wu Z. Mater. Sci. Eng., B. 2000;68:138–142. [Google Scholar]; (c) Fealy R. J., Goldsmith J. I. J. Phys. Chem. C. 2012;116:13133–13142. [Google Scholar]
- (a) Song C. and Zhang J., in PEM Fuel Cell Electrocatalysts and Catalyst Layers, ed. J. Zhang, Springer-Verlag, London, 2008, pp. 89–134. [Google Scholar]; (b) Bettelheim A., Kuwana T. Anal. Chem. 1979;51:2257–2260. [Google Scholar]; (c) McCrory C. C. L., Jung S., Ferrer I. M., Chatman S. M., Peters J. C., Jaramillo T. F. J. Am. Chem. Soc. 2015;137:4347–4357. doi: 10.1021/ja510442p. [DOI] [PubMed] [Google Scholar]
- (a) Zhang L., Song C., Zhang J., Wang H., Wilkinson D. P. J. Electrochem. Soc. 2005;152:A2421–A2426. [Google Scholar]; (b) Zhou R., Zheng Y., Jaroniec M., Qiao S.-Z. ACS Catal. 2016;6:4720–4728. [Google Scholar]
- (a) Wightman R. M. Anal. Chem. 1981;53:1125A–1134A. [Google Scholar]; (b) Heinze J. Angew. Chem., Int. Ed. 1991;30:170–171. [Google Scholar]; (c) Edwards M. A., Martin S., Whitworth A. L., Macpherson J. V., Unwin P. R. Physiol. Meas. 2006;27:R63–R108. doi: 10.1088/0967-3334/27/12/R01. [DOI] [PubMed] [Google Scholar]
- Newman J., J. Electrochem. Soc., 1966, 113 , 501 –502 , ; where n is the number of electrons transferred in the redox event, and D is the diffusion coefficient in cm2 s–1 . [Google Scholar]
- Amatore C., Pflüger F. Organometallics. 1990;9:2276–2282. [Google Scholar]
- Fauvarque J.-F., Pflüger F., Troupel M. J. Organomet. Chem. 1981;208:419–427. [Google Scholar]
- Denuault G., Mirkin M. V., Bard A. J. J. Electroanal. Chem. Interfacial Electrochem. 1991;308:27–38. [Google Scholar]
- Kalvet I., Guo Q., Tizzard G. J., Schoenebeck F. ACS Catal. 2017;7:2126–2132. doi: 10.1021/acscatal.6b03344. [DOI] [PMC free article] [PubMed] [Google Scholar]
- (a) Amatore C., Fosset B., Bartelt J., Deakin M. R., Wightman R. M. J. Electroanal. Chem. Interfacial Electrochem. 1988;256:255–268. [Google Scholar]; (b) Norton J. D., White H. S. J. Electroanal. Chem. 1991;325:341–350. [Google Scholar]; (c) Amatore C., Paulson S. C., White H. S. J. Electroanal. Chem. 1997;439:173–182. [Google Scholar]
- Barman K., Edwards M. A. and White H. S., unpublished results.
- (a) Bard A. J., Fan F. R. F., Kwak J., Lev O. Anal. Chem. 1989;61:132–138. [Google Scholar]; (b) Amemiya S., Bard A. J., Fan F. R. F., Mirkin M. V., Unwin P. R. Annu. Rev. Anal. Chem. 2008;1:95–131. doi: 10.1146/annurev.anchem.1.031207.112938. [DOI] [PubMed] [Google Scholar]
- (a) Barcena H. S., Liu B., Mirkin M. V., Canary J. W. Inorg. Chem. 2005;44:7652–7660. doi: 10.1021/ic051048m. [DOI] [PubMed] [Google Scholar]; (b) Rodríguez-López J., Shen M., Nepomnyashchii A. B., Bard A. J. J. Am. Chem. Soc. 2012;134:9240–9250. doi: 10.1021/ja301016n. [DOI] [PubMed] [Google Scholar]; (c) Guerret-Legras L., Audibert J. F., Dubacheva G. V., Miomandre F. Chem. Sci. 2018;9:5897–5905. doi: 10.1039/c8sc01814f. [DOI] [PMC free article] [PubMed] [Google Scholar]
- Amatore C., Pebay C., Scialdone O., Szunerits S., Thouin L. Chem.–Eur. J. 2001;7:2933–2939. doi: 10.1002/1521-3765(20010702)7:13<2940::aid-chem2940>3.0.co;2-u. [DOI] [PubMed] [Google Scholar]
- (a) Unwin P. R., Bard A. J. J. Phys. Chem. 1991;95:7814–7824. [Google Scholar]; (b) Zhou F., Unwin P. R., Bard A. J. J. Phys. Chem. 1992;96:4917–4924. [Google Scholar]; (c) Demaille C., Unwin P. R., Bard A. J. J. Phys. Chem. 1996;100:14137–14143. [Google Scholar]
- Li F., Unwin P. R. J. Phys. Chem. C. 2015;119:4031–4043. [Google Scholar]
- ; see also: ; (a) Kai T., Zhou M., Duan Z., Henkelman G. A., Bard A. J. J. Am. Chem. Soc. 2017;139:18552–18557. doi: 10.1021/jacs.7b08702. [DOI] [PubMed] [Google Scholar]; (b) Kai T., Zhou M., Johnson S., Ahn H. S., Bard A. J. J. Am. Chem. Soc. 2018;140:16178–16183. doi: 10.1021/jacs.8b08900. [DOI] [PubMed] [Google Scholar]
- (a) Fosdick S. E., Knust K. N., Scida K., Crooks R. M. Angew. Chem., Int. Ed. 2013;52:10438–10456. doi: 10.1002/anie.201300947. [DOI] [PubMed] [Google Scholar]; (b) Koizumi Y., Shida N., Ohira M., Nishiyama H., Tomita I., Inagi S. Nat. Commun. 2016;7:10404. doi: 10.1038/ncomms10404. [DOI] [PMC free article] [PubMed] [Google Scholar]
- Fosdick S. E., Berglunc S. P., Mullins C. B., Crooks R. M. Anal. Chem. 2013;85:2493–2499. doi: 10.1021/ac303581b. [DOI] [PubMed] [Google Scholar]
- Bouffier L., Reculusa S., Ravaine V., Kuhn A. ChemPhysChem. 2017;18:2637–2642. doi: 10.1002/cphc.201700398. [DOI] [PubMed] [Google Scholar]
- Inagi S., Ishiguro Y., Atobe M., Fuchigami T. Angew. Chem., Int. Ed. 2010;49:10136–10139. doi: 10.1002/anie.201005671. [DOI] [PubMed] [Google Scholar]
- Miyamoto K., Nishiyama H., Tomita I., Inagi S. ChemElectroChem. 2019;6:97–100. [Google Scholar]
- Inagi S., Ishiguro Y., Shida N., Fuchigami T. J. Electrochem. Soc. 2012;159:G146–G150. [Google Scholar]
- (a) Fosdick S. E., Crooks R. M. J. Am. Chem. Soc. 2012;134:863–866. doi: 10.1021/ja210354m. [DOI] [PubMed] [Google Scholar]; (b) Ibañez D., Heras A., Colina A. Anal. Chem. 2017;89:3879–3883. doi: 10.1021/acs.analchem.7b00856. [DOI] [PubMed] [Google Scholar]; (c) Eden A., Scida K., Arroyo-Currás N., Eijkel J. C. T., Meinhart C. D., Pennathur S. J. Phys. Chem. C. 2019;123:5353–5364. [Google Scholar]
- (a) Britz D. and Strutwolf J., Digital Simulations in Electrochemistry, Springer International Publishing, Cham Switzerland, 4th edn, 2016. [Google Scholar]; (b) Messersmith S. J. J. Chem. Educ. 2014;91:1498–1500. [Google Scholar]; (c) Brown J. H. J. Chem. Educ. 2015;92:1490–1496. [Google Scholar]; (d) Wang S., Wang J., Gao Y. J. Chem. Educ. 2017;94:1567–1570. [Google Scholar]
- (a) COMSOL Multiphysics®, COMSOL AB, Stockholm, Sweden, http://www.comsol.com, accessed April 22, 2019.; (b) BASi DigiSim® Simulation Software for Cyclic Voltammetry, http://www.basinc.com/products/ec/digisim/, accessed April 22, 2019.; (c) DigiElch Electrochemical Simulation Software, https://www.gamry.com/digielch-electrochemical-simulation-software/, accessed April 22, 2019.


