

Abstract
In numerous applications, from working with animal models to mapping the genetic basis of human disease susceptibility, it is useful to know whether a single disrupting mutation in a gene is likely to be deleterious. With this goal in mind, a number of measures have been developed to identify genes in which protein-truncating variants (PTVs), or other types of mutations, are absent or kept at very low frequency in large population samples—genes that appear “intolerant to mutation”. One measure in particular, pLI, has been widely adopted. Based on the contrast between the observed versus expected number of PTVs, it was designed to classify genes into three categories, labelled null, recessive and haploinsufficient. Such population genetic approaches can be useful in many applications. As we clarify, however, these measures reflect the strength of selection acting on heterozygotes, and not dominance for fitness or haploinsufficiency for other phenotypes.
Ed summary:
This Perspective discusses how best to interpret pLI, a measure widely used to identify genes that are intolerant to a single copy of a truncating mutation, by relating this and related measures to the underlying population genetic theory.
Experimental biologists and human geneticists are often interested in whether a single disrupting mutation, be it a protein-truncating variant (PTV) or a missense mutation, is likely to have a phenotypic effect1–4. A related question is whether such a mutation will lead to a reduction in fitness of its carrier. The relationship between these two questions, between effects on phenotypes and on fitness, is not straight-forward, with many potential paths from genotype to phenotype to fitness. For instance, a single mutation could lead to a severe clinical phenotype, indicating that the gene is haploinsufficient or that there is a gain of function, yet have small or negligible effects on fitness unless homozygous. As examples, in ELN and BRCA2, a single PTV leads to a severe but late onset disease while homozygote PTVs are lethal5–8; thus mutations in the genes are clearly haploinsufficient, but are they dominant with regard to fitness? Conversely, a mutation in a highly pleiotropic gene could have a very weak and potentially subclinical effect on any particular phenotype, yet cumulatively inflict a severe cost on fitness9.
Following common practice in human genetics, we refer to genes in which a single loss of function mutation has a discernible phenotypic effect in heterozygotes as “haploinsufficient” (at least with regard to that phenotype)4. In turn, we describe genes in which a single disrupting mutation has an evolutionary fitness effect in heterozygotes as “dominant” (see Box 1). Although the term “dominance” is also used to refer to the effect of a single allele on phenotype, for clarity, here, we restrict its use to denote effects on fitness. More precisely, following the convention in population genetics, we denote the fitnesses 1, 1-hs, and 1-s as corresponding, respectively, to genotypes AA, AD, and DD, where D is the deleterious allele, h is the dominance coefficient, and s is the selection coefficient. Thus, a mutation is completely recessive if h is equal to 0, that is if deleterious fitness effects are only present in homozygotes, and at least partially dominant otherwise.
Box 1 : Frequencies of Deleterious Alleles Under Mutation-Selection-Drift Balance.
Deleterious alleles are introduced into the population by mutation, then change in frequency due to the combined effects of genetic drift and natural selection. Unless a disease mutation confers an advantage in some environments (e.g., the sickle cell allele in populations with severe malaria52), the frequency at which it will be found in a population reflects a balance between the rate at which it is introduced by mutation and removed purifying selection, modulated by the effects of genetic drift42–44.
This phenomenon is referred to as “mutation-selection-drift” balance and modeled as follows (e.g., see53). Let u be the mutation rate from the wild type allele A to deleterious allele D. This mutation rate can be defined per site or per gene, by summing the mutation rate to deleterious alleles across sites (this simple summing implicitly assumes that there is no complementation and compound heterozygotes for deleterious alleles have the same fitness effects as homozygotes54). The fitness of diploid individuals carrying genes with wild-type (A) or deleterious (D) alleles is given by
| Genotype: | AA | AD | DD |
| Fitness: | 1 | 1-hs | 1-s |
where s is the selection coefficient, which measures the fitness of DD relative to AA, and h is the dominance coefficient, such that hs is the reduction in fitness of AD relative to AA. In population genetics, the term dominance (with respect to fitness) is often defined as h>0.5. Here, however, we define a mutation as partially dominant so long as h is not near 0, as this criterion is directly relevant to the expected frequency of deleterious mutations55.
In the limit of an infinite, panmictic population (i.e., ignoring genetic drift and inbreeding), when h>0 (and hs >> u), the equilibrium frequency of the deleterious allele (D), q, is approximately43:
Notably, when h>0, the equilibrium frequency q is determined by the strength of selection in heterozygotes (i.e., hs, the joint effects of h and s) because deleterious homozygotes are too infrequent for selection on them to have an appreciable effect on allele dynamics in the population. Hence, in this approximation, for a given hs, different combinations of h and s will yield the same frequency of q.
Under the same conditions, for a completely recessive allele (h=0), q is well approximated by43:
Here, the equilibrium frequency is determined by selection in homozygotes. In this limit of an infinite population size, the frequency corresponding to a recessive allele with a given s>0 can also arise from a dominant allele for some value of hs>0.
In a finite population, there is a distribution of deleterious allele frequencies rather than a single (deterministic) value for any values of h and s. For a constant population size N, this distribution was derived by Wright44 and is again a function of hs (assuming that 2Nhs >>1 and setting aside the case of sustained, high levels of inbreeding56). The resulting distribution can be highly variable, reflecting both stochasticity in the mutation process and the variance due to genetic drift. Dramatic changes in population size, as experienced by human populations, can also have a marked effect on the distribution of deleterious alleles. Regardless of these complications, it remains the case that distinguishing complete recessivity (h=0) from small hs may not be feasible and that, other than for complete recessivity, the expected allele frequency is a function of hs, not h and s separately55.
Estimating the strength of selection acting on a gene in terms of the selection coefficient (s) and dominance effects (h) of mutations, has a long tradition in population genetics10–13. In model organisms, such estimates have relied on mutation accumulation experiments and assays of gene deletion libraries10,14–16; in humans and other species, these parameters have been inferred from patterns of genetic variation17–21. The inferences are based on the notion of a mutation-selection-drift balance, namely that the frequencies of deleterious alleles in a sample reflect a balance between the rate at which they are introduced by mutation and the rate at which they are purged from the population by selection (as well as change in frequency randomly due to genetic drift). Mutations with larger hs are purged more effectively and hence are expected to be at lower frequencies in the population—or, equivalently, are more likely to be absent from large samples (Box 1). Therefore, one way to identify genes whose loss is likely to reduce fitness is to assess whether disrupting mutations are found at lower frequencies than expected under some sensible null model.
To our knowledge, this approach—of prioritizing human disease genes on the basis of fitness consequences of disrupting mutations—was introduced by Petrovski et al.22, who ranked genes by comparing the observed number of common PTVs and missense mutations to the total number of observed variants. Their statistic was then supplemented by a number of others23–26, notably pLI, which is defined as an estimate of the “probability of being loss of function intolerant”27. Loosely, pLI is derived from a comparison of the observed number of PTVs in a sample to the number expected in the absence of fitness effects (i.e., under neutrality), given an estimated mutation rate for the gene. Specifically, Lek et al.27 assumed that the number of PTVs observed in a gene is Poisson distributed with mean λM, where M is the number of segregating PTVs expected in a sample under neutrality (estimated for each gene based on a mutation model23 and the observed synonymous polymorphism counts) and λ reflects the depletion in the number due to selection. The authors categorized genes as being either neutral (with λNull=1), recessive (λRec=0.463) or haploinsufficient (λHI=0.089). The fixed values of λRec and λHI were obtained from the average proportional reduction in the number of observed PTVs in genes classified as recessive and severely haploinsufficient, respectively; the classification was based on phenotypic effects of mutations in the ClinGen dosage sensitivity gene list and a hand curated gene set of Mendelian disorders28. Given this model, Lek et al.27 estimated the proportion of human genes in each of their three categories and then, for any given gene, they obtained the maximum a posteriori probability that it belongs to each of the categories. Genes with high probability (set at ≥0.9) of belonging to the haploinsufficient class were classified as “extremely loss of function intolerant”27.
pLI has been broadly used in human genetics, to help identify genes in which a single disrupting mutation is likely of clinical significance2,29–36. It is also increasingly employed in clinical annotation and in databases of mouse models, as indicative of haploinsufficiency and dosage sensitivity37–41. In fact, however, pLI and related measures reflect only the strength of selection acting on heterozygotes and are not directly informative about dominance effects on fitness, let alone about the degree of haploinsufficiency with respect to a phenotype.
The reason can be understood in population genetic terms: unless h is vanishingly small (or long-term inbreeding levels are very high), a reduction in the frequency of PTVs—and hence of PTV counts—is indicative of the strength of selection acting on heterozygotes, hs, and not of the two parameters h and s separately. This result derives from mutation-selection-drift balance theory developed by Haldane42,43, Wright44, and others45 (see Box 1). Intuitively, it reflects the fact that when fitness effects in heterozygotes are strong relative to genetic drift, deleterious alleles are kept at low frequency in the population. Homozygotes for the deleterious allele are therefore exceedingly rare and selection acts almost entirely through heterozygotes. As a result, the frequencies of PTVs in a sample—and therefore pLI and related measures—reflect the strength of selection acting on heterozygotes. This may be true even for genes classified as phenotypically recessive by clinicians: although a much stronger phenotype is seen in homozygotes, a subtle fitness effect on heterozygotes can be sufficient to markedly decrease the frequency of disease mutations46.
To illustrate this point, we used forward simulations to model how the observed counts of PTVs (and hence pLI) depend on h and s for a gene of typical length, considering both a constant size population setting (Fig 1A, see legend for details) and a more realistic model for human demographic history47 (Fig 1B). As can be seen, markedly different combinations of h and s lead to indistinguishable distributions of PTV counts (and hence of pLI values), so long as hs is the same (Fig 1A, B). More generally, the probability of observing a specific PTV count is maximized along a ridge corresponding to combinations of h and s that result in a given hs value (Fig 1C). As a result, pLI can be near 1 even when the dominance coefficient h is small, provided s is sufficiently large, and is therefore not indicative of dominance per se.
Figure 1. pLI relates to hs, but not h and s separately.
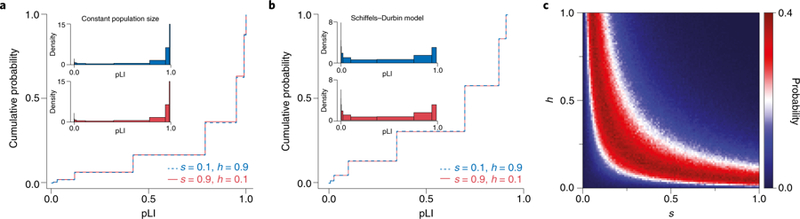
(A & B) Different combinations of h and s with the same hs value yield highly similar distributions of pLI. We considered PTVs arising in a hypothetical human gene of typical length for (A) a population of constant size and (B) a plausible model of changes in the effective population size of Europeans over time47. We modeled the distinct number of segregating PTVs in a population using forward simulations (see Supplementary Note for details). We first obtained the number of PTVs expected under neutrality by averaging over 106 simulations with s=h=0. Then, for different combinations of s and h, we calculated the pLI value for each replicate from the number of PTVs obtained. The lines show the cumulative distribution of pLI in 106 replicates for the parameter combinations of s=0.1,h=0.9 (blue, dashed) and s=0.9,h=0.1 (red, solid). The insets in each figure show the density of the distribution of pLI scores. (C) The probability of observing a specific PTV count is maximized along a ridge of fixed hs. We generated the distribution of PTV counts in a hypothetical human gene under the Schiffels-Durbin model as above for a grid of s and h values, using 106 replicates for each parameter combination. The figure depicts the likelihood of observing a PTV count of 3 (the value that by chance was obtained in the first run of s=0.10,h=0.90 and was treated as observed) for each combination of h and s.
Although these considerations make clear that pLI should be thought of as reflecting hs, it was not designed to be an estimator of this parameter, and has several problematic features as such. First, for a given value of hs, the expected value of pLI varies with gene length (Fig 2A). Second, for a typical gene length and a wide range of hs values (i.e., 10−3–10−1), the distribution of pLI is highly variable and bimodal, covering most of the range from 0 to 1 (Fig 2B). Consequently, two genes with the same hs can be assigned radically different pLI values (Fig 2B). Conversely, the same pLI value can reflect markedly different hs values, as illustrated by the large variance of pLI in the hs range between 10−3 and 10−1 (Fig 2A). Outside this range of hs values, pLI is almost uninformative about the underlying parameter: below hs≈10−3, pLI is ~0 for any value of hs; above hs≈10−1, it is always ~1, properties that worsen with increasing gene length (Fig 2A). Our simulations further illustrate that for a given hs, genetic drift also contributes to the variance in PTV counts, a feature that is ignored in the construction of pLI (through its reliance on a Poisson distribution of PTV counts)48. Thus, if the goal is to learn about fitness effects to help prioritize disease genes, a direct estimate of hs (e.g., 48,49) under a plausible demographic model, together with a measure of statistical uncertainty, would be preferable.
Figure 2. Properties of pLI.
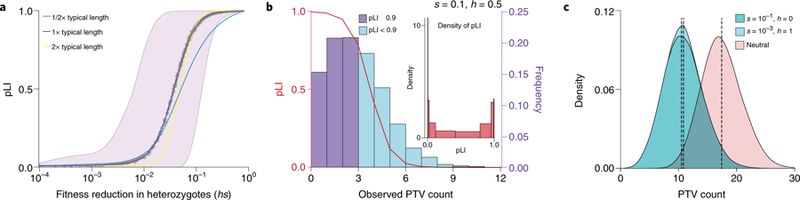
(A) Behavior of pLI as a function of hs. We simulated the counts of PTVs for a range of hs values under a plausible model of population size changes (Schiffels-Durbin model47, see Supplementary Note). For each run, we calculated pLI using the observed number of PTVs and the expected number obtained from averaging over neutral simulations. The purple line is the loess smoothed curve over all simulations for each value of hs (the x-axis on a log10 scale), in a human gene of typical length. The shaded area represents the central 95%-tile interval of pLI scores for each value of hs. The cyan and yellow lines are the loess smoothed curves for simulations in a gene with half or twice the length of a typical gene, respectively. (B) For a given hs, pLI scores are highly variable. The red curve depicts the pLI score as a function of the number of observed PTVs. The histogram represents the distribution of simulated PTV counts for s=0.1, h=0.5 under a plausible demographic model for Europeans47, in a human gene of typical length; darker bars indicate scores that would be classified as “extremely loss-of-function intolerant”27. The inset shows the density of pLI scores. (C) Complete recessivity (h=0) can lead to similar PTV counts as weak selection on heterozygotes (hs>0). The distribution labeled “neutral” shows the simulated counts of PTVs with h and s both equal to 0. Each distribution shows the results from 106 simulations. Dashed lines indicate the mean of each distribution.
Recasting pLI in a population genetic framework also helps to understand why the assignments of genes as recessive is even less reliable. Lek et al.27 aim to divide genes into three categories, two of which correspond to hs>0 (pLI) and hs=0,s=0 (pNULL). Logically, the remaining category (pREC) should include completely recessive cases (i.e., where hs=0 but s>0), in which selection acts exclusively against homozygotes (Box 1). Regardless of the method used, however, it can be infeasible to distinguish this category from the hs>0 case, because the same expected allele frequency (and hence PTV count) can arise when h=0 or when hs>0 but small (see Box 1 and Fig 2C). For example, for a typical per gene mutation rate to disease alleles of u=10−6 and no genetic drift, the frequency of disease alleles would be 1% whether h=0 (completely recessive) and s=10−2 or h=1 (fully dominant) and s=10−4 (see equations in Box 1). In other words, strongly deleterious, completely recessive PTVs can be hard to distinguish from those that are weakly selected and at least partially dominant.
Why then, in practice, are genes classified by clinicians as dominant based on Mendelian disease phenotypes enriched for high pLI scores compared to those classified as recessive 2,27,31? Mendelian disease genes consist mostly of cases in which mutations are known to cause a highly deleterious outcome, i.e., for which there is prior knowledge that s is likely to be large (even close to 1). When s is large, a gene will be classified by pLI as haploinsufficient so long as fitness effects in heterozygotes are sufficient to decrease the number of observed PTVs, i.e., so long as h is not tiny. For most genes, however, there is no prior knowledge about s, and in that case, pLI—or any measure based on the frequency of PTVs—cannot reliably distinguish recessivity from dominance, let alone identify haploinsufficiency.
In summary, population genetic approaches based on the deficiency of putatively deleterious mutations2,3,23,25,49–51 hold great promise for prioritizing genes in which mutations are likely to be harmful in heterozygotes22,49. Recasting these approaches in terms of underlying population genetic parameters provides a natural framework for their interpretation and a clearer understanding of what they can reliably infer: these approaches identify genes in which single PTVs likely have large fitness effects in heterozygotes. For this subset of genes, there is information about dominance when s is known to be large and not otherwise. Moreover, for no genes can the methods be used to directly infer haploinsufficiency status. Where fitness effects are to be used as an indication of pathogenicity, we therefore argue that a better approach is the development of direct estimates of hs (and measures of uncertainty) under realistic demographic models for the population of interest.
Supplementary Material
Acknowledgments
We thank A. Chakravarti, G. Coop, M.B. Eisen, M. Hurles, J.K. Pritchard, Y. Shen, and members of the Przeworski and Sella labs for helpful discussions. This work was supported by GM128318 to ZF, GM126787 to JB, GM121372 to MP and GM115889 to GS. We acknowledge computing resources from Columbia University’s Shared Research Computing Facility project, which is supported by NIH Research Facility Improvement Grant 1G20RR030893-01, and associated funds from the New York State Empire State Development, Division of Science Technology and Innovation (NYSTAR) Contract C090171.
Footnotes
Competing Interests
The authors declare no competing interests.
Data Availability Statement
c++ source code for the simulations of PTV counts and accompanying scripts used for plotting and data analysis are available at https://github.com/zfuller5280/MutationIntoleranceSimulations.
References:
- 1.Blake JA, Bult CJ, Eppig JT, Kadin JA & Richardson JE The Mouse Genome Database genotypes::phenotypes. Nucleic Acids Res 37, D712–D719 (2009). [DOI] [PMC free article] [PubMed] [Google Scholar]
- 2.Bartha I, Iulio J. di, Venter JC & Telenti A Human gene essentiality. Nature Reviews Genetics 19, 51 (2018). [DOI] [PubMed] [Google Scholar]
- 3.Eilbeck K, Quinlan A & Yandell M Settling the score: variant prioritization and Mendelian disease. Nat. Rev. Genet 18, 599–612 (2017). [DOI] [PMC free article] [PubMed] [Google Scholar]
- 4.Huang N, Lee I, Marcotte EM & Hurles ME Characterising and Predicting Haploinsufficiency in the Human Genome. PLOS Genetics 6, e1001154 (2010). [DOI] [PMC free article] [PubMed] [Google Scholar]
- 5.Raybould MC, Birley AJ & Hultén M Molecular variation of the human elastin (ELN) gene in a normal human population. Annals of Human Genetics 59, 149–161 (1995). [DOI] [PubMed] [Google Scholar]
- 6.Wooster R et al. Identification of the breast cancer susceptibility gene BRCA2. Nature 378, 789–792 (1995). [DOI] [PubMed] [Google Scholar]
- 7.Wagenseil JE et al. The importance of elastin to aortic development in mice. Am J Physiol Heart Circ Physiol 299, H257–H264 (2010). [DOI] [PMC free article] [PubMed] [Google Scholar]
- 8.Roy R, Chun J & Powell SN BRCA1 and BRCA2: different roles in a common pathway of genome protection. Nat. Rev. Cancer 12, 68–78 (2011). [DOI] [PMC free article] [PubMed] [Google Scholar]
- 9.Simons YB, Bullaughey K, Hudson RR & Sella G A population genetic interpretation of GWAS findings for human quantitative traits. PLOS Biology 16, e2002985 (2018). [DOI] [PMC free article] [PubMed] [Google Scholar]
- 10.Simmons MJ & Crow JF Mutations affecting fitness in Drosophila populations. Annu. Rev. Genet 11, 49–78 (1977). [DOI] [PubMed] [Google Scholar]
- 11.Keightley PD The distribution of mutation effects on viability in Drosophila melanogaster. Genetics 138, 1315–1322 (1994). [DOI] [PMC free article] [PubMed] [Google Scholar]
- 12.Deng HW & Lynch M Estimation of Deleterious-Mutation Parameters in Natural Populations. Genetics 144, 349–360 (1996). [DOI] [PMC free article] [PubMed] [Google Scholar]
- 13.Orr HA Fitness and its role in evolutionary genetics. Nat Rev Genet 10, 531–539 (2009). [DOI] [PMC free article] [PubMed] [Google Scholar]
- 14.Mukai T, Chigusa SI, Mettler LE & Crow JF Mutation Rate and Dominance of Genes Affecting Viability in DROSOPHILA MELANOGASTER. Genetics 72, 335–355 (1972). [DOI] [PMC free article] [PubMed] [Google Scholar]
- 15.Phadnis N & Fry JD Widespread Correlations Between Dominance and Homozygous Effects of Mutations: Implications for Theories of Dominance. Genetics 171, 385–392 (2005). [DOI] [PMC free article] [PubMed] [Google Scholar]
- 16.Agrawal AF & Whitlock MC Inferences About the Distribution of Dominance Drawn From Yeast Gene Knockout Data. Genetics 187, 553–566 (2011). [DOI] [PMC free article] [PubMed] [Google Scholar]
- 17.Williamson SH et al. Simultaneous inference of selection and population growth from patterns of variation in the human genome. Proc. Natl. Acad. Sci. U.S.A 102, 7882–7887 (2005). [DOI] [PMC free article] [PubMed] [Google Scholar]
- 18.Eyre-Walker A, Woolfit M & Phelps T The Distribution of Fitness Effects of New Deleterious Amino Acid Mutations in Humans. Genetics 173, 891–900 (2006). [DOI] [PMC free article] [PubMed] [Google Scholar]
- 19.Boyko AR et al. Assessing the Evolutionary Impact of Amino Acid Mutations in the Human Genome. PLOS Genetics 4, e1000083 (2008). [DOI] [PMC free article] [PubMed] [Google Scholar]
- 20.Racimo F & Schraiber JG Approximation to the Distribution of Fitness Effects across Functional Categories in Human Segregating Polymorphisms. PLOS Genetics 10, e1004697 (2014). [DOI] [PMC free article] [PubMed] [Google Scholar]
- 21.Kim BY, Huber CD & Lohmueller KE Inference of the Distribution of Selection Coefficients for New Nonsynonymous Mutations Using Large Samples. Genetics 206, 345–361 (2017). [DOI] [PMC free article] [PubMed] [Google Scholar]
- 22.Petrovski S, Wang Q, Heinzen EL, Allen AS & Goldstein DB Genic Intolerance to Functional Variation and the Interpretation of Personal Genomes. PLOS Genetics 9, e1003709 (2013). [DOI] [PMC free article] [PubMed] [Google Scholar]
- 23.Samocha KE et al. A framework for the interpretation of de novo mutation in human disease. Nat Genet 46, 944–950 (2014). [DOI] [PMC free article] [PubMed] [Google Scholar]
- 24.Steinberg J, Honti F, Meader S & Webber C Haploinsufficiency predictions without study bias. Nucleic Acids Res 43, e101–e101 (2015). [DOI] [PMC free article] [PubMed] [Google Scholar]
- 25.Bartha I et al. The Characteristics of Heterozygous Protein Truncating Variants in the Human Genome. PLOS Computational Biology 11, e1004647 (2015). [DOI] [PMC free article] [PubMed] [Google Scholar]
- 26.Fadista J, Oskolkov N, Hansson O, Groop L & Hancock J LoFtool: a gene intolerance score based on loss-of-function variants in 60 706 individuals. Bioinformatics 33, 471–474 (2017). [DOI] [PubMed] [Google Scholar]
- 27.Lek M et al. Analysis of protein-coding genetic variation in 60,706 humans. Nature 536, 285–291 (2016). [DOI] [PMC free article] [PubMed] [Google Scholar]
- 28.Blekhman R et al. Natural selection on genes that underlie human disease susceptibility. Curr. Biol 18, 883–889 (2008). [DOI] [PMC free article] [PubMed] [Google Scholar]
- 29.Lelieveld SH et al. Meta-analysis of 2,104 trios provides support for 10 new genes for intellectual disability. Nature Neuroscience 19, 1194 (2016). [DOI] [PubMed] [Google Scholar]
- 30.Ruderfer DM et al. Patterns of genic intolerance of rare copy number variation in 59,898 human exomes. Nature Genetics 48, 1107–1111 (2016). [DOI] [PMC free article] [PubMed] [Google Scholar]
- 31.Kosmicki JA et al. Refining the role of de novo protein-truncating variants in neurodevelopmental disorders by using population reference samples. Nat. Genet 49, 504–510 (2017). [DOI] [PMC free article] [PubMed] [Google Scholar]
- 32.Skraban CM et al. WDR26 Haploinsufficiency Causes a Recognizable Syndrome of Intellectual Disability, Seizures, Abnormal Gait, and Distinctive Facial Features. The American Journal of Human Genetics 101, 139–148 (2017). [DOI] [PMC free article] [PubMed] [Google Scholar]
- 33.Stankiewicz P et al. Haploinsufficiency of the Chromatin Remodeler BPTF Causes Syndromic Developmental and Speech Delay, Postnatal Microcephaly, and Dysmorphic Features. The American Journal of Human Genetics 101, 503–515 (2017). [DOI] [PMC free article] [PubMed] [Google Scholar]
- 34.Nguyen HT et al. Integrated Bayesian analysis of rare exonic variants to identify risk genes for schizophrenia and neurodevelopmental disorders. Genome Medicine 9, 114 (2017). [DOI] [PMC free article] [PubMed] [Google Scholar]
- 35.Zarrei M et al. De novo and rare inherited copy-number variations in the hemiplegic form of cerebral palsy. Genetics in Medicine 20, 172–180 (2018). [DOI] [PMC free article] [PubMed] [Google Scholar]
- 36.Heyne HO et al. De novo variants in neurodevelopmental disorders with epilepsy. Nature Genetics 1 (2018). doi: 10.1038/s41588-018-0143-7 [DOI] [PubMed] [Google Scholar]
- 37.Zech M et al. Haploinsufficiency of KMT2B, Encoding the Lysine-Specific Histone Methyltransferase 2B, Results in Early-Onset Generalized Dystonia. Am J Hum Genet 99, 1377–1387 (2016). [DOI] [PMC free article] [PubMed] [Google Scholar]
- 38.Haller M, Mo Q, Imamoto A & Lamb DJ Murine model indicates 22q11.2 signaling adaptor CRKL is a dosage-sensitive regulator of genitourinary development. PNAS 114, 4981–4986 (2017). [DOI] [PMC free article] [PubMed] [Google Scholar]
- 39.Wang J et al. MARRVEL: Integration of Human and Model Organism Genetic Resources to Facilitate Functional Annotation of the Human Genome. The American Journal of Human Genetics 100, 843–853 (2017). [DOI] [PMC free article] [PubMed] [Google Scholar]
- 40.Afzali B et al. BACH2 immunodeficiency illustrates an association between super-enhancers and haploinsufficiency. Nat Immunol 18, 813–823 (2017). [DOI] [PMC free article] [PubMed] [Google Scholar]
- 41.Gosalia N, Economides AN, Dewey FE & Balasubramanian S MAPPIN: a method for annotating, predicting pathogenicity and mode of inheritance for nonsynonymous variants. Nucleic Acids Res 45, 10393–10402 (2017). [DOI] [PMC free article] [PubMed] [Google Scholar]
- 42.Haldane JBS A Mathematical Theory of Natural and Artificial Selection, Part V: Selection and Mutation. Mathematical Proceedings of the Cambridge Philosophical Society 23, 838–844 (1927). [Google Scholar]
- 43.Haldane JBS The Effect of Variation of Fitness. The American Naturalist 71, 337–349 (1937). [Google Scholar]
- 44.Wright S The Distribution of Gene Frequencies in Populations. Proc Natl Acad Sci U S A 23, 307–320 (1937). [DOI] [PMC free article] [PubMed] [Google Scholar]
- 45.Crow JF & Kimura M An introduction to population genetics theory (Harper & Row, 1970). [Google Scholar]
- 46.Amorim CEG et al. The population genetics of human disease: The case of recessive, lethal mutations. PLOS Genetics 13, e1006915 (2017). [DOI] [PMC free article] [PubMed] [Google Scholar]
- 47.Schiffels S & Durbin R Inferring human population size and separation history from multiple genome sequences. Nat Genet 46, 919–925 (2014). [DOI] [PMC free article] [PubMed] [Google Scholar]
- 48.Weghorn D et al. Applicability of the mutation-selection balance model to population genetics of heterozygous protein-truncating variants in humans. bioRxiv 433961 (2018). doi: 10.1101/433961 [DOI] [PMC free article] [PubMed] [Google Scholar]
- 49.Cassa CA et al. Estimating the selective effects of heterozygous protein-truncating variants from human exome data. Nat Genet 49, 806–810 (2017). [DOI] [PMC free article] [PubMed] [Google Scholar]
- 50.Samocha KE et al. Regional missense constraint improves variant deleteriousness prediction. bioRxiv 148353 (2017). doi: 10.1101/148353 [DOI] [Google Scholar]
- 51.Havrilla JM, Pedersen BS, Layer RM & Quinlan AR A map of constrained coding regions in the human genome. Nature Genetics 1 (2018). doi: 10.1038/s41588-018-0294-6 [DOI] [PMC free article] [PubMed] [Google Scholar]
- 52.Piel FB et al. Global distribution of the sickle cell gene and geographical confirmation of the malaria hypothesis. Nature Communications 1, 104 (2010). [DOI] [PMC free article] [PubMed] [Google Scholar]
- 53.Gillespie JH Population Genetics: A Concise Guide (JHU Press, 2004). [Google Scholar]
- 54.Clark AG Mutation-selection balance with multiple alleles. Genetica 102–103, 41–47 (1998). [PubMed]
- 55.Simons YB, Turchin MC, Pritchard JK & Sella G The deleterious mutation load is insensitive to recent population history. Nat Genet 46, 220–224 (2014). [DOI] [PMC free article] [PubMed] [Google Scholar]
- 56.Charlesworth B & Charlesworth D Elements of Evolutionary Genetics (Freeman W. H., 2010). [Google Scholar]
Associated Data
This section collects any data citations, data availability statements, or supplementary materials included in this article.