

Abstract
Busier people tend to perform better on cognitive tasks than less busy individuals. Nevertheless, the characteristics that are associated with greater perceived busyness are unknown. To address this question participants (N = 463) from the Dallas Lifespan Brain Study (ages 20–89) completed a self-report busyness assessment and demographic, health, personality, and lifestyle measures. Results revealed that perceived busyness peaked in 30-year-olds, showed age-related decreases until age 60, and then remained stable. Moreover, women generally reported being busier than men. Analysis of age by gender interactions revealed that men exhibited a significant cubic age effect for busyness, whereas women did not. Overall, younger age, female gender, agreeableness, neuroticism, frequent participation in novel activities, and enjoyment of cognitive processing were independently associated with being busier, and the characteristics related to busyness were generally stable across age. Notably, participation in novel activities and need for cognition were the most predictive lifestyle characteristics, supporting the framing of busyness as an indicator of mental engagement. We also propose personality-based sources of self-generated and other-generated busyness.
Keywords: engagement, lifespan, gender, personality
Introduction
The topic of busyness pervades everyday life. Conversations at social gatherings frequently touch upon hectic schedules, and it is common to hear people of all ages explain that they have been busy. Despite the high relevance of busyness to daily life, there is surprisingly limited research on the topic. Whereas more lifestyle research has focused on individual’s participation in specific activities (e.g., exercise, education), we propose that it is also useful to develop further understanding of a global measure of perceived busyness, which can encompass any and all tasks that occupy a person’s time. This global measure may be important to characterize overall lifestyle engagement without being vulnerable to overlooking participation in less common activities. Of note, we recently documented that middle-aged and older adults who reported high levels of busyness tended to have better cognitive abilities than less busy adults (Festini, McDonough, & Park, 2016), demonstrating the relevance of this measure to cognitive function. Nevertheless, the characteristics that are associated with a busy lifestyle are undocumented, and it is unknown whether certain factors will be more predictive of perceived busyness at specific ages. Thus, the goal of the present research was to identify demographic, personality, health, and lifestyle characteristics that predict perceived busyness, with the goal of furthering our understanding of this global measure of lifestyle engagement.
Specifically, we define busyness as the perception of the density of events and tasks to perform in one’s daily life (Gershuny, 2005; Levine, 2005)—in other words, how crowded one perceives one’s schedule to be. We utilized an existing self-reported measure of subjective busyness, a subscale of the Martin and Park Environmental Demands Questionnaire (Martin & Park, 2003). This subscalei includes seven questions designed to assess the density of events in one’s daily life (e.g., “How often do you have so many things to do that you go to bed later than your regular bedtime?” from 1 = Never to 5 = Very Often). Studies have demonstrated that this self-reported busyness measure has high internal consistency, as well as high external validity, such that busyness ratings were related to the likelihood of being employed and to having a larger family (Martin & Park, 2003). Furthermore, in a study of electronically-monitored medication adherence (Park et al., 1999), self-reported busyness was the strongest predictor of non-adherence, suggesting that those who perceive themselves to have a crowded schedule, do indeed have trouble completing planned-for events. Hence, although this study measures self-reported busyness, we consider that the measure does reflect the magnitude of one’s daily task load.
Thus, this busyness scale (Martin & Park, 2003) has been shown to be a quick-to-administer assessment of perceived daily task load that is related to real world behaviors and cognitive function (Festini et al., 2016; Park et al., 1999). Importantly, it also can be compared across individuals regardless of potential differences in the specific tasks that each person performs. For example, researchers can compare someone who is busy with childcare responsibilities to someone who is busy with work-related deadlines. The subjective nature of the measurement is an asset because whereas two individuals may perform different total numbers of tasks, their perception of task load may be similar, and this perception is informative. That is, subjective busyness might serve as a proxy of productive lifestyle engagement relative to one’s capacity to be engaged. To the extent that living an engaged life is critical to maintain cognition and well-being (e.g., Hertzog, Kramer, Wilson, & Lindenberger, 2008; Park et al., 2014), this global busyness measure may provide new insight into successful aging and may inform core lifespan theories (e.g., Lindenberger, 2014; Reuter-Lorenz & Park, 2014; Rowe & Kahn, 1997; Stern, 2009). Lastly, busyness is a concept that the public frequently reflects upon, making it an especially relevant lifestyle dimension worthy of more detailed scientific understanding.
Present Study
One goal of the present study was to evaluate age-related differences in perceived busyness across the adult lifespan. We hypothesized that age would likely be one of the most relevant dimensions in predicting how busy people report being, as contextual demands (e.g., job responsibilities, caring for children and/or aged parents) vary considerably with age (e.g., Hultsch, Hertzog, Small, & Dixon, 1999; Verbrugge, Gruber-Baldini, & Fozard, 1996). Nonetheless, we acknowledge the alternative possibility that busyness may be a stable, trait-like characteristic that shows little age-related variation. If this is the case, then we would observe small age differences in perceived busyness across the lifespan—each decade would have a similar distribution of busy versus non-busy people. To assess these possibilities, we examine cross-sectional patterns of busyness across the lifespan.
We also predicted that gender, like age, would be a fundamentally important variable that is associated with busyness. Prior research has found that women report greater job demands (e.g., Cavanaugh, Boswell, Roehling, & Boudreau, 2000), less household assistance (e.g., Geller & Hobfoll, 1994), and greater caregiver burden (e.g., Pinquart & Sörensen, 2006) than men. Thus, we predicted that women would report being busier than men. Given that the occurrence of these roles varies over time (Verbrugge et al., 1996), we also expected gender-related variations in busyness during ages with more varied social roles.
Because there are likely multiple pathways to a busy lifestyle, besides evaluating the relationships between age and gender and busyness, we additionally assessed the associations for personality, health, and lifestyle engagement. With regard to personality, we hypothesized that certain personality characteristics (e.g., agreeableness, extraversion) could cultivate greater busyness, as personality has been shown to influence activity participation (e.g., Newton, Pladevall-Guyer, Gonzalez, & Smith, 2016) and volunteering (e.g., Mike, Jackson, & Oltmanns, 2014). Because personality has been considered a relatively stable characteristic (e.g., Cobb-Clark & Schurer, 2012), we expected that the relationship between personality and busyness would not vary as a function of age. As for health, we hypothesized that poorer health would be associated with lower busyness, as lower exercise levels have been documented in unengaged retired individuals (Kaskie, Imhof, Cavanaugh, & Culp, 2008). We did not predict an interaction between age and health. Finally, we hypothesized that self-reported activity levels would predict subjective busyness, validating that people who report being busy actually do partake in more activities. Importantly, we also examined what types of activities (e.g., perhaps social activities) were most predictive of busyness. We expected that engagement in activities would be more predictive of busyness in older adults because the general age-related decreases in activity participation (Hultsch et al., 1999) and job responsibilities (Verbrugge et al., 1996) may inflate the relative contribution of lifestyle engagement to busyness.
Summary of Hypotheses
Overall, the present study was designed to highlight individual differences that are associated with perceived busyness. To summarize, we will evaluate (1) age differences in perceived busyness, (2) whether gender, personality, health, and lifestyle factors significantly predict perceived busyness, and (3) whether gender, personality, health, and lifestyle predictors of self-reported busyness interact with age. Specifically, first, we hypothesize that perceived busyness will vary substantially with age, potentially reflecting varying job and social demands. Yet, we acknowledge that it is also possible that busyness may reveal itself to be a more stable characteristic across the adult lifespan, with minimal age differences. Second, we predict that female gender, agreeable and extraverted personality, good health, and more engaged lifestyles will be associated with greater perceived busyness. Third, with regard to age interactions, we hypothesize that the associations between gender and lifestyle and busyness will vary with age, whereas we predict that personality and health will have consistent relationships with busyness regardless of age. Accumulating evidence suggests that busyness may be relevant to successful aging (Festini et al., 2016; cf. Chan, Haber, Drew, & Park, 2014; McDonough, Haber, Bischof, & Park, 2015; Park et al., 2014), and is likely to become an increasingly pertinent dimension of daily life. Thus, these results will be useful for interpreting self-reported busyness and for understanding factors that predict feeling busy.
Method
Participants
A total of 463 participants from the Dallas Lifespan Brain Study (DLBS) were assessed in the present cross-sectional analyses. Demographic characteristics of the sample are reported in Table 1. All participants were classified as cognitively normal because all MMSE scores were 26 or higher, and a score of 24 or above indicates no cognitive impairment (Tombaugh & McIntyre, 1992). The DLBS sample size was selected to yield at least 40 individuals per decade and to ensure that the full sample had substantial power (>0.80) to detect small effect sizes (0.1) in linear regression models with up to 15 predictors at an alpha level of 0.05. The Institutional Review Boards at the University of Texas at Dallas and the University of Texas Southwestern Medical Center approved this study. All participants provided written informed consent.
Table 1.
Demographic characteristics of the sample, by decade
| Age Group | N | Female (n) | Male (n) | Education (yrs) | MMSE | Shipley Vocab |
|---|---|---|---|---|---|---|
| 20–29 | 44 | 28 | 16 | 15.89 | 28.93 | 30.91 |
| 30–39 | 46 | 28 | 18 | 16.83 | 28.60 | 32.67 |
| 40–49 | 43 | 28 | 15 | 15.85 | 28.56 | 33.81 |
| 50–59 | 86 | 52 | 34 | 15.69 | 28.64 | 33.47 |
| 60–69 | 99 | 62 | 37 | 15.77 | 28.45 | 34.49 |
| 70–79 | 90 | 55 | 35 | 15.11 | 28.13 | 34.20 |
| 80–89 | 55 | 32 | 23 | 15.87 | 27.55 | 34.05 |
| TOTAL | 463 | 285 | 178 | 15.86 | 28.38 | 33.61 |
Note. There were no significant differences in education between ages, with one exception (30s versus 70s, p = .001). MMSE performance was significantly worse in the 80s than in the other decades, ps ≤ .001, not including the 70s. MMSE performance was worse in 70-year-olds than in 20-year-olds, p = .006. Shipley vocabulary was significantly lower in the 20s than in every other decade, except the 30s, ps ≤ .003. All of these effects fall in the range of normal aging. Note also that a subset of the present sample was included in Festini et al. (2016).
Materials
Demographic Measures.
Age, gender, and current employment status were self-reported by participants. Employment status was coded as either (a) working full time, (b) working part-time, or (c) retired or unemployed.
Busyness.
Current self-reported busyness was measured with the busyness subscale from the Martin and Park Environmental Demands Questionnaire, a survey that has been shown to have high internal consistency, Cronbach’s α = 0.88 (Martin & Park, 2003). Participants indicated their responses to 7 questions on a 5-point Likert scale, and an average busyness score was calculated, where higher scores corresponded to greater levels of perceived busyness on a typical day. Example questions include: “How busy are you during an average day?” “How often do you have too many things to do each day to actually get them all done?”
Personality Measures.
NEO PI-R.
The Revised NEO Personality Inventory (NEO PI-R) was administered (Costa & McCrae, 1992b). This 240-item assessment of the Big Five personality traits measured conscientiousness, agreeableness, neuroticism, extraversion, and openness to new experiences. This assessment has been shown to be reliable and valid. The internal consistency for each of the five personality traits is high: neuroticism, α = 0.93; extraversion, α = 0.87; openness, α = 0.89; agreeableness, α = 0.76; conscientiousness, α = 0.86 (Costa & McCrae, 1992a).
Health Measures.
BMI.
Body Mass Index (BMI) was calculated based on self-reported height and weight.ii
Blood Pressure.
Blood pressure was measured with a blood pressure cuff four times. We calculated mean systolic blood pressure, mean diastolic blood pressure, and the resulting mean pulse pressure—the difference between systolic and diastolic blood pressure. Pulse pressure corresponds to the force produced by the contracting heart, and higher pulse pressure is less favorable (e.g., Matthews et al., 1998).
Frequency of Physical Exercise.
We administered a survey that assessed the frequency of physical exercise. The survey was based on the Centers for Disease Control and Prevention’s Youth Risk Behavior Survey (YRBS; CDC, 2008), which measured how often participants exercised and watched TV (reverse scored).
Lifestyle Engagement Measures.
Activity Lifestyle.
The Victoria Longitudinal Study Activity Lifestyle Questionnaire (VLS-ALQ) (Hultsch, Hammer, & Small, 1993; Hultsch et al., 1999; Small, Dixon, McArdle, & Grimm, 2012) was administered to measure participation in various activities within the past six months. The activity categories included: self-maintenance activities (e.g., preparing a meal, caring for a family member), hobbies (e.g., playing an instrument), novel activities (e.g., taking an educational course, practicing a foreign language), passive activities (e.g., watching TV), and social activities (e.g., hosting a party).
Need for Cognition.
The Need for Cognition scale assessed an individual’s tendency to enjoy effortful cognitive processing (Cacioppo, Petty, & Kao, 1984). Participants indicated whether each of 18 statements was characteristic of them. For example, “The notion of thinking abstractly is appealing to me.” We included need for cognition within the lifestyle engagement domain because it has been argued that this measure is interchangeable with typical intellectual engagement (Woo, Harms, & Kuncel, 2007).
Education.
Participants indicated the highest level of education they completed, and we coded their answers into estimated years of education based on typical completion times of degree programs.
Procedure
Participants completed the questionnaires at home on an online system, except for the NEO personality scale, which was completed during laboratory testing. Blood pressure was also measured in person.
Statistical Approach
First, we tested age and gender differences in busyness across the adult lifespan. We performed a general linear model and entered linear, quadratic, and cubic age terms, gender, and the interactions between gender and linear, quadratic, and cubic age. Next, we assessed each personality, health, and lifestyle engagement domain individually to isolate variables that independently predicted busyness. Specifically, for each domain (i.e., personality, health, lifestyle engagement), after performing bivariate correlations between busyness and each other variable, we performed a hierarchical regression, with age (continuous) and gender in the first step (Model 1), the domain-specific variables in the second step (Model 2), and the linear age interactions in the third step (Model 3). Openness, conscientiousness, extraversion, agreeableness, and neuroticism were the domain-specific personality variables. Pulse pressureiii, BMI, and frequency of physical exercise were the domain-specific health variables. And, need for cognition and the frequency of participation in self-maintenance activities, social activities, passive activities, novel activities, and hobbies were the domain-specific lifestyle engagement variables. This statistical approach allowed us to identify which domain-specific variables explained significant additional variance in busyness after accounting for the variance explained by age and gender, as well as if these variables interacted with age. For the lifestyle engagement hierarchical regression only, we also controlled for education in a separate step (after age and gender) to determine if participation in activities explained variance in busyness over and above educational attainment. Finally, because variables across the domains were likely to explain overlapping variance, after extracting key variables from each domain we performed an integrative multiple regression that assessed the best independent predictors of busyness across all domains. Specifically, we performed a comprehensive multiple regression, entering all significant and marginally significant predictors of busyness from each of the domain-specific modelsiv.
Results
Validation of Busyness Scale in Present Sample
As an independent replication of the scales’ external validity, we found that busyness varied with current employment status in our sample, F(2, 377) = 63.07, p < .001, ηp2 = 0.251. Individuals working full-time reported being busier (M = 3.23, SE = 0.06) than part-time workers (M = 2.82, SE = 0.08), who were busier than retired or unemployed individuals (M = 2.42, SE = 0.04), all ps < .001 for Tukey HSD follow-up comparisons. This relationship between employment status and busyness was maintained even when covarying out age, F(2, 376) = 25.97, p < .001, ηp2 = 0.121.
Age and Gender Differences in Busyness
Figure 1 depicts the relationship between busyness and age. A general linear model revealed a significant linear age effect, indicating that busyness generally showed age-related decreases with advancing age, F(1, 455) = 55.72, p < .001, ηp2 = .109. There was no quadratic age effect, F(1, 455) = 3.57, p = .059, ηp2 = .008, but there was a significant cubic age effect, F(1, 455) = 18.25, p < .001, ηp2 = .039. The cubic effect occurred because busyness had an age-related peak in 30-year-olds, age-related decreases until age 60, and stability through the 80sv.
Figure 1.
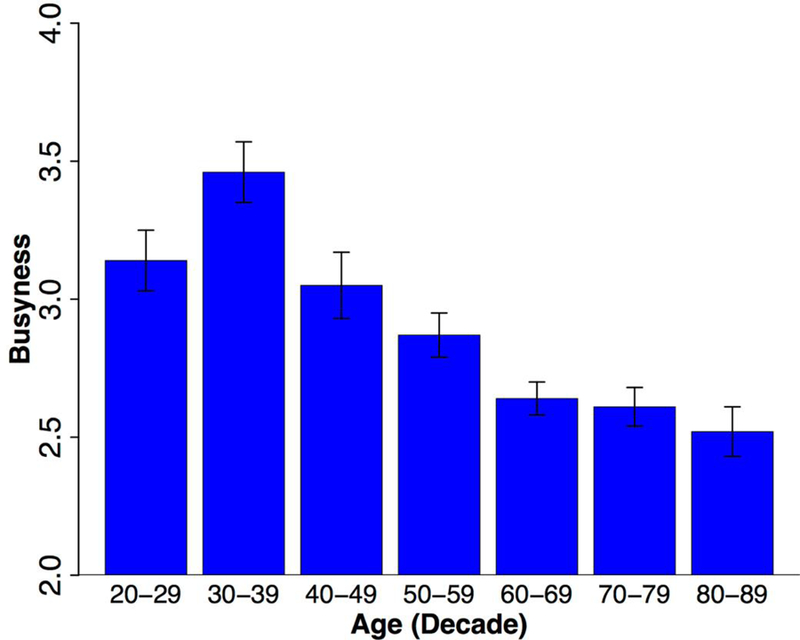
Average perceived busyness at each decade across the adult lifespan ± 1 standard error.
The main effect of gender was also significant, F(1, 455) = 12.97, p < .001, ηp2 = .028. Women (M = 2.96; SE = 0.04) reported being significantly busier than men (M = 2.63; SE = 0.05). Inspection of the age by gender analyses revealed a significant cubic age by gender interaction, F(1, 455) = 4.54, p = .034, ηp2 = .010. However, the interactions between gender and linear age and quadratic age were not significant, F(1, 455) = 2.94, p = .087, and F(1, 455) = 0.83, p = .362, respectively. Breakdown of the cubic age by gender interaction indicated that the interaction occurred because there was a significant cubic age effect for busyness in men, F(1, 174) = 17.18, p < .001, ηp2 = .090, but not for women, F(1, 281) = 2.86, p = .092, ηp2 = .010. Figure 2 depicts these gender differences in busyness. Note that, in men, there were age-related increases in busyness from the 20s to the 30s, followed by age-related decreases in busyness to the 60s, and then general stability in busyness. For women, however, age-related busyness was similar in the 20s and 30s and did not display a cubic pattern.
Figure 2.

Average perceived busyness for men (dark bars) and women (light bars) at each decade across the adult lifespan ± 1 standard error.
Moreover, gender differences in busyness remained significant after additionally controlling for employment status, F(1, 370) = 12.31, p = .001, ηp2 = .032. Women working full-time (n = 80) similarly reported being busier than men working full time (n = 57), t(135) = 2.26, p = .025, d = 0.39. Retired or unemployed women (n = 94) also reported being busier than retired or unemployed men (n = 83), t(175) = 3.59, p < .001, d = 0.54.
Personality and Busyness
All Big Five personality measures (i.e., openness, conscientiousness, extraversion, agreeableness, and neuroticism) were significantly positively associated with busyness, except for neuroticism. Correlations are reported in Table 2 and are visually depicted in Figure 3. All correlations remained significant after additionally controlling for age, all ps < .001.
Table 2.
Correlations among perceived busyness and the personality, health, and lifestyle engagement variables
| 1 | 2 | 3 | 4 | 5 | 6 | 7 | 8 | 9 | 10 | 11 | 12 | 13 | 14 | 15 | 16 | 17 | 18 | ||
|---|---|---|---|---|---|---|---|---|---|---|---|---|---|---|---|---|---|---|---|
| 1 | Busyness | 1.0 | |||||||||||||||||
| 2 | Conscientiousness | .223** | 1.0 | ||||||||||||||||
| 3 | Agreeableness | .254** | .647** | 1.0 | |||||||||||||||
| 4 | Neuroticism | .029 | −.401** | −.254** | 1.0 | ||||||||||||||
| 5 | Extraversion | .243** | .287** | .195** | −.257** | 1.0 | |||||||||||||
| 6 | Openness | .285** | .544** | .627** | −.130** | .309** | 1.0 | ||||||||||||
| 7 | BMI | −.163** | −.121** | −.163** | −.003 | −.051 | −.109* | 1.0 | |||||||||||
| 8 | Systolic BP | −.318** | −.101* | −.065 | −.060 | −.127** | −.139** | .243** | 1.0 | ||||||||||
| 9 | Diastolic BP | −.214** | −.136** | −.129** | .001 | −.105* | −.080 | .361** | .767** | 1.0 | |||||||||
| 10 | Pulse Pressure | −.296** | −.038 | .008 | −.090 | −.103* | −.141** | .066 | .854** | .321** | 1.0 | ||||||||
| 11 | Physical Exercise | .137** | .147** | .076 | −.081 | .146** | .139** | −.190** | .025 | −.053 | .080 | 1.0 | |||||||
| 12 | Self-Maintenance | .084 | −.033 | −.040 | −.006 | .053 | .001 | −.003 | −.177** | −.048 | −.222** | .054 | 1.0 | ||||||
| 13 | Social Activities | .137** | .130** | .211** | −.168** | .178** | .022 | −.047 | .083 | .007 | .116* | .173** | .117* | 1.0 | |||||
| 14 | Hobbies | .129** | .036 | .011 | −.080 | .124** | .115* | −.063 | .023 | .053 | −.009 | .120** | .273** | .214** | 1.0 | ||||
| 15 | Passive Activities | −.005 | −.059 | −.003 | −.031 | .147** | −.029 | .102* | .018 | .053 | −.017 | −.030 | .174** | .183** | .059 | 1.0 | |||
| 16 | Novel Activities | .311** | .244** | .116* | −.226** | .317** | .267** | −.039 | −.109* | −.070 | −.104* | .193** | .174** | .341** | .364** | .232** | 1.0 | ||
| 17 | Need for Cognition | .280** | .252** | .046 | −.216** | .327** | .370** | −.005 | −.122** | −.055 | −.135** | .151** | .049 | .042 | .222** | −.049 | .393** | 1.0 | |
| 18 | Education | .183** | .303** | .279** | −.144** | .067 | .359** | −.065 | −.068 | −.057 | −.055 | .105* | .028 | .113* | .053 | .045 | .340** | .273** | 1.0 |
Note. Significant correlations are marked with asterisks (** p < .001; * p < .05). BP = blood pressure.
Figure 3.

Significant relationships between perceived busyness and agreeableness, extraversion, conscientiousness, and openness.
Within the hierarchical regression assessing which personality traits independently predicted busyness, adding the age interactions to the model did not explain significant additional variance, R2 change = .016, F(5, 449) = 1.86, p = .101, so we interpret the values from the second model, R2 = .232, F(7, 454) = 19.56, p < .001. Age and gender accounted for 17.8% of the variance in the first step, F(2, 459) = 49.66, p < .001, and the personality predictors accounted for an additional 5.4% of the variance, F(5, 454) = 6.36, p < .001. Greater extraversion predicted greater busyness (β = .126, p = .006), and greater agreeableness (β = .121, p = .054) and neuroticism (β = .081, p = .089) were marginally significant predictors. Openness and conscientiousness were not independent predictors of busyness (ps ≥ .346).
Health and Busyness
Significant negative correlations emerged between busyness and systolic blood pressure, diastolic blood pressure, pulse pressure, and BMI. A significant positive correlation was present between busyness and frequency of physical exercise. Correlations are reported in Table 2 and are visually depicted in Figure 4. All correlations remained significant when additionally controlling for age, all ps ≤ .023. Staying busy was generally associated with better health (i.e., lower blood pressure, lower BMI, and more frequent physical exercise).
Figure 4.
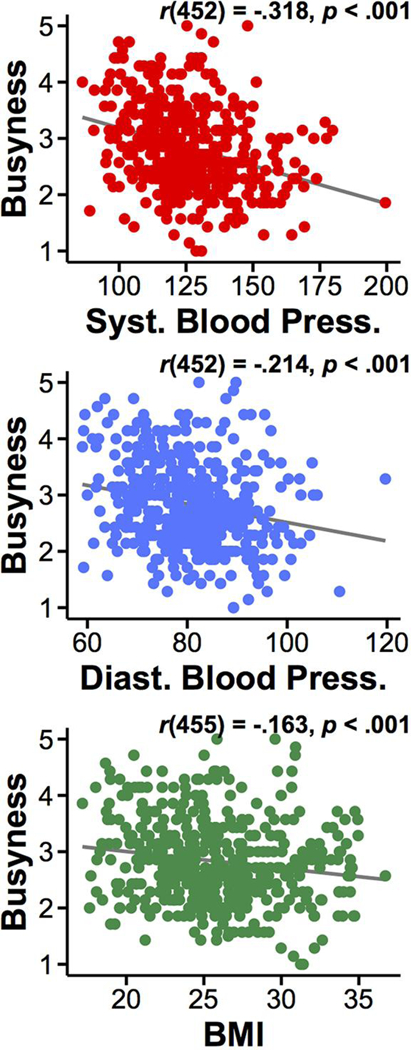
Significant relationships between perceived busyness and three health measures: mean systolic blood pressure, mean diastolic blood pressure, and body mass index (BMI).
In the hierarchical regression that evaluated health variables, the age by health interactions did not account for significant additional variance, R2 change = .004, F(3, 440) = 0.73, p = .533. Thus, we interpret values from the second model, R2 = .205, F(5, 443) = 22.82, p < .001. After accounting for age and gender, the health variables explained an additional 2.8% of the variance, F(3, 443) = 5.23, p = .001. Only frequency of physical exercise accounted for unique health variance in busyness (β = .132, p = .003), such that people with more frequent reported physical exercise also reported being busier. BMI was also a marginally significant independent predictor (β = −.076, p = .083). Pulse pressure was not a significant independent predictor, p = .193.
Lifestyle Engagement and Busyness
Significant positive correlations were present between busyness and novel activities, need for cognition, education, social activities, and hobbies. Specific correlation values are reported in Table 2. Figure 5 visually depicts these relationships. All correlations remained significant after controlling for age, ps ≤ .001. Busyness was marginally positively associated with self-maintenance activities, but was not associated with passive activities.
Figure 5.

Significant relationships between perceived busyness, education, novel activities, need for cognition, and social activities.
For the hierarchical regression assessing engagement, which also included education, the addition of the age interactions in the fourth step did not account for significant additional variance, R2 change = .008, F(6, 447) = 0.82, p = .555, so we interpret the values from the third model, R2 = 0.279, F(9, 453) = 19.52, p < .001. After accounting for age and gender, education accounted for an additional 2.6% of the variance, F(1, 459) = 14.94, p < .001. Next, the five activity measures and need for cognitionvi explained an additional 7.5% of the variance, F(6, 453) = 7.88, p < .001. Greater participation in novel activities (β = .149, p = .004) and a higher need for cognition (β = .140, p = .002) independently predicted greater busyness. Greater participation in social activities marginally predicted greater busyness (β = .087, p = .058). Self-maintenance activities, hobbies, and passive activities did not emerge as independent predictors (ps ≥ .225), and education became nonsignificant (p = .145).
An Integrative Model Predicting Busyness
Age, gender, agreeableness, neuroticism, participation in novel activities, and need for cognition were significant independent predictors of busyness. Extraversion, BMI, frequency of physical exercise, and social activities were not significant independent predictors. The full model accounted for 31.9% of the variance in busyness, F(10, 444) = 20.80, p < .001. Table 3 summarizes the results of the integrative multiple regression.
Table 3.
Multiple regression of demographic, personality, health, and lifestyle variables predicting self-reported busyness
| Unstandardized |
95% CI |
Standardized |
|||||
|---|---|---|---|---|---|---|---|
| B | Std. Error | Lower | Upper | Beta | t | Sig. | |
| (Constant) | 2.681 | .048 | 2.59 | 2.78 | - | 55.39 | < .001 |
| Age | −.011 | .002 | −.014 | −.008 | −.271 | −6.19 | < .001 |
| Gender | .234 | .064 | .109 | .359 | .154 | 3.68 | < .001 |
| Agreeableness | .220 | .055 | .112 | .329 | .172 | 4.00 | < .001 |
| Neuroticism | .221 | .071 | .081 | .362 | .135 | 3.10 | .002 |
| Need for Cognition | .199 | .051 | .098 | .300 | .176 | 3.86 | < .001 |
| Novel Activities | .172 | .047 | .079 | .265 | .170 | 3.63 | < .001 |
| Extraversion | .077 | .087 | −.094 | .249 | .040 | 0.89 | .376 |
| Physical Exercise | .031 | .026 | −.021 | .083 | .048 | 1.16 | .247 |
| BMI | −.011 | .007 | −.026 | .004 | −.061 | −1.49 | .138 |
| Social Activities | .038 | .030 | −.022 | .098 | .056 | 1.23 | .218 |
Note. Significant independent predictors are indicated in bold font. CI = confidence interval.
Discussion
The present study aimed to (a) assess how perceived busyness varied across the adult lifespan and (b) test which demographic, personality, health, and lifestyle engagement individual differences predicted levels of self-reported busyness. We also examined whether these variables were predictive across the adult lifespan, or whether these relationships varied with age. Interestingly, we found that although there were pronounced age-related differences in busyness across the adult lifespan, in general, the variables that predicted busyness were consistent across age. Below, we consider the relationship between these individual differences variables and busyness, identifying parallels with related research and areas for further study.
Age Differences in Busyness
As expected, we documented age differences in perceived busyness. Average reported busyness peaked in 30-year-olds, showed age-related decreases until age 60, and then remained stable through the 80s. This age trajectory of busyness is consistent with the finding that middle-aged adults reported being busier than older adults (Martin & Park, 2003). Moreover, daily activity, as measured by an accelerometer, has been shown to decrease with increasing age (Buchman, Wilson, & Bennett, 2008), and peak levels of committed activities (i.e., paid work, child/elder care, housework) have been shown to occur in the 30s and 40s, with general activity levels decreasing across the lifespan (Verbrugge et al., 1996; see also Christensen & Mackinnon, 1993; Hultsch et al., 1999; but see Cuttler and Graf, 2007; Neupert, Patterson, Davis & Allaire, 2011; Singh-Manoux, Richards, & Marmot, 2003).
Notably, 80-year-olds reported being as busy as 60-year-olds. We speculate that people in their 80s may feel as busy as people in their 60s because it becomes increasingly demanding to perform daily activities with advancing age. Thus, while objective activity frequency can decrease through the 80s (e.g., Hultsch et al., 1999), subjective busyness can remain relatively stable post-retirement. Nevertheless, adults aged 60 and older displayed marked age-related reductions in busyness compared to their younger counterparts, suggesting that this age group has a greater potential to increase their busyness levels.
Gender Differences in Busyness
Women tended to report greater levels of busyness than men (cf. Britton & Shipley, 2010; Hultsch et al., 1999; Spielberger & Reheiser, 1994). These gender differences in busyness are consistent with findings of greater job stress (Cavanaugh et al., 2000; Hochwarter, Perrewe, & Dawkins, 1995), less household assistance (Geller & Hobfoll, 1994), greater caregiver burden (e.g., Pinquart & Sörensen, 2006), a greater likelihood for volunteering (Mike et al., 2014), and a trend for higher activity levels (Buchman et al., 2008) in women than in men.
One could argue that cohort differences may contribute to the observed gender differences. People from earlier generations (who are older in our cross-sectional sample) are more likely to adopt gender stereotyped social roles (e.g., see Brooks & Bolzendahl, 2004), which may underlie some of the gender effects (e.g., more caregiving/household duties for women contributing to greater busyness). Nevertheless, we observe striking gender differences in busyness in the 20s but not the 30s—cohorts that are both less susceptible to stereotypical gender roles. This disparity suggests that our observed gender differences are unlikely to be driven by cohort effects.
We also found gender differences in the relationship between age and busyness. Specifically, men exhibited a significant cubic relationship between age and busyness, whereas women did not. Inspection of the age differences in busyness between men and women demonstrated that the cubic effect occurred for men because age-related increases in busyness were evident between the 20s and 30s in men, but not in women. This suggests that men in particular experience an age-related increase in busyness in the 30s, whereas women’s perceived busyness levels tend to be more stable in the 20s and the 30s. This observed pattern may be due to greater job and household demands for women (e.g., Cavanaugh et al., 2000; Geller & Hobfoll, 1994) across age.
Personality Predicts Busyness
Assessment of correlations between personality traits and self-reported busyness indicated that greater busyness was associated with greater agreeableness, extraversion, conscientiousness, and openness (cf. Cuttler & Graf, 2007; Uttl & Kibreab, 2011). This is consistent with prior related research, in that greater extraversion (Elshaug & Metzer, 2001; Mike et al., 2014; Newton et al., 2016; Stephan, Boiche, Canada, & Terracciano, 2014), openness (Stephan et al., 2014), agreeableness (Elshaug & Metzer, 2001; Mike et al., 2014), and conscientiousness (Mike et al., 2014) were associated with a greater likelihood of activity participation or volunteering (see also Jopp & Hertzog, 2010). However, these relationships are not always found (Cuttler & Graf, 2007; Soubelet & Salthouse, 2010).
Based on the personality-specific regression model, we propose that distinct personality dimensions elicit other-generated busyness and self-generated busyness. People who are agreeable and conscientious may receive more tasks to perform and may be more likely to agree to requests, making them busier than disagreeable, unreliable people. This could be considered “other-generated” busyness. Alternatively, extraversion and openness are more likely to result in “self-generated” busyness because people with these personality characteristics are more inclined to seek out social activities and new thrills (e.g., see Jopp & Hertzog, 2010). Extraversion, agreeableness, and neuroticism were significant or marginal independent predictors of busyness in the personality-specific regression model, indicative of separable self-generated and other-generated components. Moreover, the finding that neuroticism was an independent predictor suggests that certain aspects of busyness also may be due to heightened anxiety. Keeping busy has been reported as a coping strategy in response to stressful life experiences (Neighbors, Jackson, Bowman, & Gurin, 1983; North, Smith, McCool, & Lightcap, 1989; Schwab, 1990). Future work should further test the self-generated and other-generated busyness hypothesis and examine relationships between neuroticism, stress, anxiety and busyness within the same individuals.
Better Health Is Associated with Greater Busyness
People with lower systolic and diastolic blood pressure, pulse pressure, BMI, and more frequent physical exercise tended to report being busier. These findings are consistent with those indicating that overcommitment was not associated with elevated blood pressure (Vrijkotte, van Doornen, & de Geus, 2000). Moreover, busyness did not exhibit detrimental health relationships similar to those found for work stress (e.g., Tsutsumi, Kayaba, Tsutsumi, & Igarashi, 2001), suggesting that being busy is not necessarily associated with elevated stress. Nevertheless, more research is needed that measures busyness, stress levels, and health simultaneously.
Interestingly, the health variables did not interact with age, and were not independently predictive of busyness in the integrative model. This indicates that although older adults tend to have more health complications than younger adults (e.g., Perlmutter & Nyquist, 1990), variability in health was not uniquely predictive of busyness nor did it vary with age. The absence of an age interaction was consistent with our hypothesis. We expected that all participants, regardless of age, would have adequate health to engage in activities and hold responsibilities that contribute to busyness. Additional work should be conducted on a sample with more variable health.
Frequency of physical exercise was the health variable that best predicted busyness in the domain-specific model. We acknowledge that the nature of our exercise assessment (i.e., self-report) may have contributed to its superior explanatory power, as busyness was also self-reported. Additional research including non-activity-based measures of fitness (i.e., VO2 max) is needed. However, the objective health measures that were independent from activity levels (i.e., BMI, blood pressure) also showed favorable associations, indicating that being busier was related to better health. Healthy people may be capable of doing more, or busyness may promote better health.
Greater Lifestyle Engagement Is Associated with Greater Busyness
We included measures of lifestyle engagement to determine what types of activities were associated with busyness. People who partook in more novel activities, social activities, hobbies, who were more highly educated, and who possessed a higher need for cognition tended to report greater busyness. These relationships support the notion that busyness can serve as an indicator of everyday engagement. They are also consistent with the observed associations between need for cognition and engagement in cognitive activities (von Stumm, 2012) and between education and engaged lifestyles (e.g., Hultsch et al., 1999; Kaskie et al., 2008).
Importantly, activities and need for cognition had predictive power beyond education, indicating that busyness due to activity engagement was not governed by educational attainment. Moreover, it is noteworthy that participation in novel activities was the most predictive activity measure. It could have been that hobbies, social activities, self-maintenance activities, or even passive activities were most predictive, but engagement in new, often mentally challenging activities showed the strongest relationship, emphasizing busyness’s accordance with mental engagement.
Independent Predictors of Busyness
Finally, because it was possible for multiple domain-specific predictors to explain overlapping variance in busyness, we also assessed overall unique predictors of busyness. Younger age, female gender, agreeableness, neuroticism, frequent participation in novel activities, and a high need for cognition independently predicted greater busyness. Notably, participation in novel activities and a high need for cognition remained significant independent predictors, supporting the framing of busyness as a proxy of effortful cognitive engagement (cf. Chan et al., 2014; Park et al., 2014). Age and gender also held explanatory power, likely due to varying roles and responsibilities expected for women and men across the lifespan (cf. Verbrugge et al., 1996). Personality was also predictive indicating that trait-like propensities for thought patterns and behavior are associated with busyness.
Limitations
One of the primary limitations of this research is that it is observational in nature. That is, we are unable to conclude whether our measured variables cause busyness because we are unable to experimentally manipulate demographic variables like age and gender and naturally occurring variables like personality, health, and lifestyle (i.e., it is impossible to randomly assign age, gender, personality, and health, and it is difficult to randomly assign lifestyle). Nevertheless, the goal of the present research was to determine which naturally occurring variables statistically predicted higher levels of perceived busyness, and we are careful to avoid causal claims.
Another limitation is that, as with any cross-sectional study, cohort differences may exist between age groups that may influence the results. Future targeted longitudinal studies can address this lingering question in more detail to determine if longitudinal changes in perceived busyness are consistent with our observed age-related differences in busyness across the adult lifespan.
Moreover, future research can build on the current research to better understand the antecedents and consequences of a busy lifestyle. Festini et al. (2016) documented that greater busyness was associated with better cognitive function in a sample of middle-aged and older adults. Thus, it is possible that the present study’s observed age-related reduction in busyness after age 60 may contribute to lower cognitive performance in older age. Alternatively, it is also possible that worsening cognitive abilities with increasing age may preclude the ability to maintain a high level of busyness.
Moreover, the present busyness subscale from the Martin & Park Environmental Demands Questionnaire (Martin & Park, 2003) focuses on current levels of busyness. Additional questions could be added that assess intra-individual variability of busyness over time (e.g., over weeks, months, years, decades), or that ask about the specific duties, responsibilities, and activities that contribute to one’s overall busyness. For example, future work could examine whether certain occupations are associated with higher or lower levels of busyness. With such additional data, researchers could assess within-person changes in busyness over time as well as specific activities that may fluctuate with time or differ between individuals that impact busyness. Finally, the present study also utilized self-report data for many measures. Although we view this as a benefit of being able to assess subjective busyness, future studies could relate self-report measures to additional objective assessments.
Conclusions
We assessed self-reported busyness across the adult lifespan, identifying demographic, personality, health, and lifestyle engagement associates of busyness. Greater perceived busyness was independently predicted by younger age, female gender, agreeableness, neuroticism, greater participation in novel activities, and a high need for cognition. All of these characteristics serve to exemplify individual differences that are associated with reports of being busy, and interestingly they generally did not vary with age. Although the repercussions of subjective busyness have not yet been studied extensively, existing research demonstrates that greater busyness is associated with better cognition (Festini et al., 2016), yet also with poorer medication adherence (Martin & Park, 2003; Park et al., 1999; cf. Neupert et al., 2011). Future research can further examine the cognitive, neural, social, and psychological associations of a busy lifestyle, with the present research providing the context of how perceived busyness varies across the adult lifespan as well as which individual differences measures predict being busy.
Acknowledgments
Funding
This work was supported by National Institute of Health Grant 5R37AG-006265-29 to D.C.P; and the Aging Mind Foundation’s support of S.B.F.
Footnotes
Portions of these data were presented at the Psychonomic Society’s 56th Annual Meeting in Chicago (November 2015).
Disclosure Statement
The authors have no conflicts of interest.
The Martin and Park Environmental Demands Questionnaire also includes a routines subscale that assesses the predictability of events in one’s daily life. We focus solely on the busyness subscale in the present study.
Note that the use of self-reported height and weight is vulnerable to bias (Rowland, 1990), but is still generally accurate (Stunkard & Albaum, 1981).
Note that pulse pressure was the only blood pressure measure entered to avoid collinearity.
For the sake of parsimony, we opted for this method rather than entering all 17 possible predictors into one model, which would limit our degrees of freedom.
To further interpret the cubic model, we performed a one-way Analysis of Variance (ANOVA) on busyness as a function of age decade, F(6, 456) = 13.45, p < .001, along with follow-up Tukey HSD tests. Notably, people in their 20s, 30s, and 40s were not significantly different from each other (all ps ≥ .079), but were significantly busier than those in their 60s, 70s, and 80s, all ps < .02; 30-year-olds were also busier than people in their 50s, p < .001. The latter three decades did not differ from each other, ps > .9.
We included need for cognition in these analyses as a proxy of typical intellectual engagement, as they have been argued to be interchangeable (see Woo et al., 2007).
Contributor Information
Sara B. Festini, Department of Psychology, University of Tampa, Tampa, FL
Christopher Hertzog, School of Psychology, Georgia Institute of Technology, Atlanta, GA.
Ian M. McDonough, Department of Psychology, The University of Alabama, Tuscaloosa, AL
Denise C. Park, Center for Vital Longevity, School of Behavioral and Brain Sciences, University of Texas at Dallas, Dallas, TX.
References
- Britton A, & Shipley MJ (2010). Bored to death? International Journal of Epidemiology, 39(2), 370–371. doi: 10.1093/ije/dyp404 [DOI] [PubMed] [Google Scholar]
- Brooks C, & Bolzendahl C (2004). The transformation of US gender role attitudes: cohort replacement, social-structural change, and ideological learning. Social Science Research, 33(1), 106–133. doi: 10.1016/s0049-089x(03)00041-3 [DOI] [Google Scholar]
- Buchman AS, Wilson RS, & Bennett DA (2008). Total daily activity is associated with cognition in older persons. Am J Geriatr Psychiatry, 16(8), 697–701. doi: 10.1097/JGP.0b013e31817945f6 [DOI] [PubMed] [Google Scholar]
- Cacioppo JT, Petty RE, & Kao CF (1984). The efficient assessment of need for cognition. J Pers Assess, 48(3), 306–307. doi: 10.1207/s15327752jpa4803_13 [DOI] [PubMed] [Google Scholar]
- Cavanaugh MA, Boswell WR, Roehling MV, & Boudreau JW (2000). An empirical examination of self-reported work stress among U.S. managers. Journal of Applied Psychology, 85(1), 65–74. doi: 10.1037/0021-9010.85.1.65 [DOI] [PubMed] [Google Scholar]
- CDC. (2008). Youth Risk Behavior Survey Retrieved from http://www.cdc.gov/healthyyouth/data/yrbs/data.htm
- Cobb-Clark DA, & Schurer S (2012). The stability of big-five personality traits. Economics Letters, 115(1), 11–15. doi: 10.1016/j.econlet.2011.11.015 [DOI] [Google Scholar]
- Costa PT, & McCrae RR (1992a). Normal personality assessment in clinical practice: The NEO personality inventory. Psychological Assessment, 4(1), 5–13. doi: 10.1037/1040-3590.4.1.5 [DOI] [Google Scholar]
- Costa PT, & McCrae RR (1992b). Revised NEO Personality Inventory (NEO-PI-R) and NEO Five-Factor Inventory (NEO-FFI) professional manual Odessa, FL: Psychological Assessment Resources. [Google Scholar]
- Cuttler C, & Graf P (2007). Personality predicts prospective memory task performance: an adult lifespan study. Scand J Psychol, 48(3), 215–231. doi: 10.1111/j.1467-9450.2007.00570.x [DOI] [PubMed] [Google Scholar]
- Elshaug C, & Metzer J (2001). Personality attributes of volunteers and paid workers engaged in similar occupational tasks. The Journal of Social Psychology, 141(6), 752–763. doi: 10.1080/00224540109600586 [DOI] [PubMed] [Google Scholar]
- Festini SB, McDonough IM, & Park DC (2016). The Busier the Better: Greater Busyness Is Associated with Better Cognition. Front Aging Neurosci, 8. doi: 10.3389/fnagi.2016.00098 [DOI] [PMC free article] [PubMed] [Google Scholar]
- Geller PA, & Hobfoll SE (1994). Gender differences in job stress, tedium and social support in the workplace. Journal of Social and Personal Relationships, 11, 555–572. doi: 10.1177/0265407594114004 [DOI] [Google Scholar]
- Gershuny J (2005). Busyness as the badge of honor for the new superordinate working class. Social Research, 72(2), 287–314. [Google Scholar]
- Hertzog C, Kramer AF, Wilson RS, & Lindenberger U (2008). Enrichment effects on adult cognitive development. Psychological Science in the Public Interest, 9(1), 1–65. doi: 10.1111/j.1539-6053.2009.01034.x [DOI] [PubMed] [Google Scholar]
- Hochwarter WA, Perrewe PL, & Dawkins MC (1995). Gender differences in perceptions of stress-related variables: Do the people make the place or does the place make the people? Journal of Managerial Issues, 7(1), 62–74. [Google Scholar]
- Hultsch DF, Hammer M, & Small BJ (1993). Age differences in cognitive performance in later life: relationships to self-reported health and activity life style. Journal of gerontology, 48, P1–11. doi: 10.1093/geronj/48.1.P1 [DOI] [PubMed] [Google Scholar]
- Hultsch DF, Hertzog C, Small BJ, & Dixon RA (1999). Use it or lose it: engaged lifestyle as a buffer of cognitive decline in aging? Psychology and aging, 14, 245–263. doi: 10.1037/0882-7974.14.2.245 [DOI] [PubMed] [Google Scholar]
- Jopp D, & Hertzog C (2010). Assessing adult leisure activities: An extension of a self-report activity questionnaire. Psychological Assessment, 22(1), 108–109. doi: 10.1037/a0017662 [DOI] [PMC free article] [PubMed] [Google Scholar]
- Kaskie B, Imhof S, Cavanaugh J, & Culp K (2008). Civic engagement as a retirement role for aging Americans. The Gerontologist, 48(3), 368–377. doi: 10.1093/geront/48.3.368 [DOI] [PubMed] [Google Scholar]
- Levine R (2005). A geography of busyness. Social Research, 72(2), 355–370. [Google Scholar]
- Lindenberger U (2014). Human cognitive aging: corriger la fortune? Science, 346(6209), 572–578. doi: 10.1126/science.1254403 [DOI] [PubMed] [Google Scholar]
- Martin M, & Park DC (2003). The Martin and Park Environmental Demands (MPED) Questionnaire: psychometric properties of a brief instrument to measure self-reported environmental demands. Aging clinical and experimental research, 15(1), 77–82. doi: 10.1007/BF03324483 [DOI] [PubMed] [Google Scholar]
- Matthews KA, Owens JF, Kuller LH, Sutton-Tyrrell K, Lassila HC, & Wolfson SK (1998). Stress-induced pulse pressure change predicts women’s carotid atherosclerosis. Stroke, 29, 1525–1530. doi: 10.1161/01.STR.29.8.1525 [DOI] [PubMed] [Google Scholar]
- McDonough IM, Haber S, Bischof GN, & Park DC (2015). The Synapse Project: Engagement in mentally challenging activities enhances neural efficiency. Restorative Neurology and Neuroscience, 33(6), 865–882. doi: 10.3233/RNN-150533 [DOI] [PMC free article] [PubMed] [Google Scholar]
- Mike A, Jackson JJ, & Oltmanns TF (2014). The conscientious retiree: The relationship between conscientiousness, retirement, and volunteering. J Res Pers, 52, 68–77. doi: 10.1016/j.jrp.2014.07.002 [DOI] [PMC free article] [PubMed] [Google Scholar]
- Neighbors HW, Jackson JS, Bowman PJ, & Gurin G (1983). Stress, coping, and Black mental health: preliminary findings from a national study. Prev Hum Serv, 2(3), 5–29. doi: 10.1300/J293v02n03_02 [DOI] [PubMed] [Google Scholar]
- Neupert SD, Patterson TR, Davis AA, & Allaire JC (2011). Age differences in daily predictors of forgetting to take medication: the importance of context and cognition. Exp Aging Res, 37(4), 435–448. doi: 10.1080/0361073X.2011.590757 [DOI] [PubMed] [Google Scholar]
- Newton NJ, Pladevall-Guyer J, Gonzalez R, & Smith J (2016). Activity Engagement and Activity-Related Experiences: The Role of Personality. J Gerontol B Psychol Sci Soc Sci doi: 10.1093/geronb/gbw098 [DOI] [PMC free article] [PubMed] [Google Scholar]
- North CS, Smith EM, McCool RE, & Lightcap PE (1989). Acute postdisaster coping and adjustment. Journal of Traumatic Stress, 2(3), 353–360. doi: 10.1002/jts.2490020309 [DOI] [Google Scholar]
- Park DC, Hertzog C, Leventhal H, Morrell RW, Leventhal E, Birchmore D, … Bennett J (1999). Medication Adherence in Rheumatoid Arthritis Patients: Older Is Wiser. Journal of the American Geriatrics Society, 47, 172–183. doi: 10.1111/j.1532-5415.1999.tb04575.x [DOI] [PubMed] [Google Scholar]
- Park DC, Lodi-Smith J, Drew L, Haber S, Hebrank A, Bischof GN, & Aamodt W (2014). The impact of sustained engagement on cognitive function in older adults: The Synapse Project. Psychol Sci, 25(1), 103–112. doi: 10.1177/0956797613499592 [DOI] [PMC free article] [PubMed] [Google Scholar]
- Perlmutter M, & Nyquist L (1990). Relationships between self-reported physical and mental health and intelligence performance across adulthood. Journal of Gerontology: Psychological Sciences, 45(4), P145–155. doi: 10.1093/geronj/45.4.P145 [DOI] [PubMed] [Google Scholar]
- Pinquart M, & Sörensen S (2006). Gender differences in caregiver stressors, social resources, and health: An updated meta-analysis. Journal of Gerontology: Psychological Sciences, 61B(1), P33–P45. doi: 10.1093/geronb/61.1.P33 [DOI] [PubMed] [Google Scholar]
- Reuter-Lorenz PA, & Park DC (2014). How Does it STAC Up? Revisiting the Scaffolding Theory of Aging and Cognition. Neuropsychol Rev, 24(3), 355–370. doi: 10.1007/s11065-014-9270-9 [DOI] [PMC free article] [PubMed] [Google Scholar]
- Rowe JW, & Kahn RL (1997). Successful Aging. The Gerontologist, 37(4), 433–440. doi: 10.1093/geront/37.4.433 [DOI] [PubMed] [Google Scholar]
- Rowland ML (1990). Self-reported weight and height. The American Journal of Clinical Nutrition, 52(6), 1125–1133. doi: 10.1093/ajcn/52.6.1125 [DOI] [PubMed] [Google Scholar]
- Schwab R (1990). Paternal and maternal coping with the death of a child. Death Studies, 14(5), 407–422. doi: 10.1080/07481189008252381 [DOI] [Google Scholar]
- Singh-Manoux A, Richards M, & Marmot M (2003). Leisure activities and cognitive function in middle age: Evidence from the Whitehall II study. J Epidemiol Community Health, 57, 907–913. doi: 10.1136/jech.57.11.907 [DOI] [PMC free article] [PubMed] [Google Scholar]
- Small BJ, Dixon RA, McArdle JJ, & Grimm KJ (2012). Do changes in lifestyle engagement moderate cognitive decline in normal aging? Evidence from the Victoria Longitudinal Study. Neuropsychology, 26(2), 144–155. doi: 10.1037/a0026579 [DOI] [PMC free article] [PubMed] [Google Scholar]
- Soubelet A, & Salthouse T (2010). The role of activity engagement in the relations between openness/intellect and cognition. Pers Individ Dif, 49(8), 896–901. doi: 10.1016/j.paid.2010.07.026 [DOI] [PMC free article] [PubMed] [Google Scholar]
- Spielberger CD, & Reheiser EC (1994). The job stress survey: Measuring gender differences in occupational stress. Journal of Social Behavioral and Personality, 9(2), 199–218. [Google Scholar]
- Stephan Y, Boiche J, Canada B, & Terracciano A (2014). Association of personality with physical, social, and mental activities across the lifespan: Findings from US and French samples. Br J Psychol, 105(4), 564–580. doi: 10.1111/bjop.12056 [DOI] [PubMed] [Google Scholar]
- Stern Y (2009). Cognitive reserve. Neuropsychologia, 47(10), 2015–2028. doi: 10.1016/j.neuropsychologia.2009.03.004 [DOI] [PMC free article] [PubMed] [Google Scholar]
- Stunkard AJ, & Albaum JM (1981). The accuracy of self-reported weights. The American Journal of Clinical Nutrition, 34(8), 1593–1599. doi: 10.1093/ajcn/34.8.1593 [DOI] [PubMed] [Google Scholar]
- Tombaugh TN, & McIntyre NJ (1992). The Mini-Mental State Examination: A Comprehensive Review. Journal of the American Geriatrics Society, 40(9), 922–935. doi: 10.1111/j.1532-5415.1992.tb01992.x [DOI] [PubMed] [Google Scholar]
- Tsutsumi A, Kayaba K, Tsutsumi K, & Igarashi M (2001). Association between job strain and prevalence of hypertension: A cross sectional analysis in a Japanese working population with a wide range of occupations: The Jichi Medical School cohort study. Occup Environ Med, 58, 367–373. doi: 10.1136/oem.58.6.367 [DOI] [PMC free article] [PubMed] [Google Scholar]
- Uttl B, & Kibreab M (2011). Self-report measures of prospective memory are reliable but not valid. Can J Exp Psychol, 65(1), 57–68. doi: 10.1037/a0022843 [DOI] [PubMed] [Google Scholar]
- Verbrugge LM, Gruber-Baldini AL, & Fozard JL (1996). Age differences and age changes in activities: Baltimore Longitudinal Study of Aging. Journal of gerontology, 51B, S30–S41. doi: 10.1093/geronb/51b.1.s30 [DOI] [PubMed] [Google Scholar]
- von Stumm S (2012). Investment trait, activity engagement, and age: independent effects on cognitive ability. J Aging Res, 2012, 949837. doi: 10.1155/2012/949837 [DOI] [PMC free article] [PubMed] [Google Scholar]
- Vrijkotte TGM, van Doornen LJP, & de Geus EJC (2000). Effects of work stress on ambulatory blood pressure, heart rate, and heart rate variability. Hypertension, 35, 880–886. doi: 10.1161/01.HYP.35.4.880 [DOI] [PubMed] [Google Scholar]
- Woo SE, Harms PD, & Kuncel NR (2007). Integrating personality and intelligence: Typical intellectual engagement and need for cognition. Personality and Individual Differences, 43(6), 1635–1639. doi: 10.1016/j.paid.2007.04.022 [DOI] [Google Scholar]