

Abstract
Extrasynaptic δ-subunits containing GABAA receptors (δGABAARs) are sensitive targets for several commonly used hypnotic agents and mediate tonic neuronal inhibition. δGABAARs are highly expressed within the thalamus and their activation promotes a switch from tonic to burst firing in vitro. Here we test two hypotheses in vivo. (1) Activation of thalamic δGABAARs will elicit electrocortical signatures consistent with widespread thalamocortical burst firing such as increased delta oscillations (1–4 Hz) and reciprocal changes in spindle-like oscillations (7–14 Hz). (2) These signatures will be recapitulated by the general anesthetic etomidate, if the electrocortical effects of etomidate at the thalamus are mediated by δGABAARs. Microperfusion of the δGABAAR-preferring agonist 4,5,6,7-tetrahydroisoxazolo[5,4-c]pyridin-3-ol (THIP; 10 and 50 μm) into the ventrobasal complex produced significant effects on electrocortical activity in wild-type mice, but not in mice lacking δGABAARs (Gabrd−/−), i.e., the effects with THIP were dependent on δGABAARs. THIP (1) increased 1–4 Hz power in wakefulness and nonrapid-eye movement (NREM) sleep; (2) reduced spindle-like oscillations in NREM sleep; and (3) increased the speed of stable transitions into NREM sleep, indicating effects on state-space dynamics. In contrast, microperfusion of etomidate (10 and 30 μm) into the ventrobasal complex produced effects on electrocortical activity that were independent of δGABAARs, i.e., effects occurred in wild-type and Gabrd−/− mice. Etomidate (1) decreased 1–4 Hz power, increased 8–12 Hz, and/or 12–30 Hz power in all sleep–wake states; (2) increased spindle-like oscillations; and (3) increased REM sleep expression. These results indicate that thalamic δGABAARs promote electrocortical signatures of deep NREM sleep, but do not mediate the effects of etomidate at the thalamus in vivo.
Keywords: anesthesia, extrasynaptic GABAA receptors, sleep, thalamus
Introduction
GABA is the main inhibitory neurotransmitter in the brain, and augmentation of GABAergic neuronal activity promotes natural sleep (Saper et al., 2001; Franks, 2008). Many commonly used anesthetic and sedating agents enhance neuronal inhibition via interactions with binding sites on GABAA receptors, including a subset containing the δ-subunit (δGABAAR) that are localized extrasynaptically (Belelli et al., 2005; Cope et al., 2005; Farrant and Nusser, 2005; Drasbek and Jensen, 2006).
The thalamus is a key structure controlling the state of brain arousal and δGABAARs are highly expressed in the thalamus, particularly in the ventrobasal complex (Lopes da Silva, 1991; McCormick and Bal, 1997; Pirker et al., 2000). Activation of δGABAARs in the ventrobasal complex elicits a tonic hyperpolarization in vitro, which promotes a change in cell-firing pattern from a tonic to a bursting mode (Cope et al., 2005). This bursting mode of thalamocortical cell firing observed in vitro is consistent with the patterns observed in thalamocortical neurons during both nonrapid-eye movement (NREM) sleep as well as anesthetic-induced loss of consciousness with certain general anesthetics (Hirsch et al., 1983; Steriade et al., 1991, 1993). However, the role of thalamic δGABAARs in mediating the electrocortical effects of sedative and anesthetic agents that target GABAARs has not yet been investigated in vivo. Generating this knowledge is important because activation of thalamic δGABAARs is suspected of mediating the sedating and hypnotic effects of intravenous anesthetics, such as the widely used general anesthetic etomidate (Belelli et al., 2005; Meera et al., 2009; Kretschmannova et al., 2013; Herd et al., 2014).
Using targeted manipulation of the ventrobasal complex of freely behaving wild-type mice, and transgenic mice lacking δGABAARs (Gabrd−/−), we tested two hypotheses in vivo. (1) Activating thalamic δGABAARs by local perfusion of the δGABAAR-preferring agonist 4,5,6,7-tetrahydroisoxazolo[5,4-c]pyridin-3-ol (THIP; Stórustovu and Ebert, 2003; Winsky-Sommerer et al., 2007; Meera et al., 2011) will elicit electrocortical signatures that are consistent with widespread thalamocortical burst firing such as increased delta oscillations (1–4 Hz) and reciprocal changes in spindle-like (7–14 Hz) oscillations. (2) These electrocortical signatures will be recapitulated by etomidate if the electrocortical effects of etomidate at the thalamus are also modulated through δGABAARs.
Here we show that local activation of thalamic δGABAARs with THIP elicits changes in electrocortical activity in vivo that are consistent with the first hypothesis. Importantly, however, these receptors were not necessary in mediating the electrocortical effects of etomidate at the thalamus, and further suggest that the effects of etomidate are more likely mediated through non-δ—likely synaptic—GABAARs (Uchida et al., 1995; Hill-Venning et al., 1997). Moreover, etomidate at the thalamus elicited changes in global electrocortical activity that are characteristic of anesthetic induction with the most commonly used intravenous general anesthetics etomidate and propofol (Kuizenga et al., 2001). Collectively, these findings suggest different effects of enhanced tonic versus phasic inhibition in the thalamus on electrocortical activity, which further implicate potential mechanisms that distinguish natural sleep from anesthesia.
Materials and Methods
Animal care.
Experiments were performed on 3- to 6-month-old male Gabrd−/− mice (catalog #MGI:3713529, RRID: MGI MGI:3713529) and their wild-type controls (C57BL/6 × SvJ129). We investigated only male mice because δGABAAR expression and function are significantly modulated by the estrous cycle (Maguire et al., 2005). Gabrd−/− mice were generated as previously described (Mihalek et al., 1999). Mice were housed with their littermates in filtered cages with controlled lighting (lights on: 0700–1900 h). Mice also had free access to sterile food and water. A total of 54 mice were studied. All procedures were performed in compliance with the requirements of the Canadian Council on Animal Care, and were approved by the University of Toronto Animal Care Committee.
Surgery.
Surgeries were performed under sterile conditions during isoflurane anesthesia (2%). Mice received subcutaneous injections of buprenorphine (0.03 mg/kg) and ketoprofen (5 mg/kg) to minimize postoperative pain, infiltration of bupivacaine (1 mg/kg) at the incision site to minimize any local pain, and intraperitoneal injections of lactated Ringer's solution for fluid loading. Mice were implanted with electroencephalogram (EEG) and neck electromyogram (EMG) electrodes for recording of electrocortical activity and determination of sleep–wake states. Electrodes were connected to pins in a miniature connector (ED90267-ND; Digi-Key). Two microdialysis guide cannulae (CXG-4; Eicom) were stereotaxically positioned 3.0 mm above the right and left ventrobasal complex of the thalamus (0.6 mm posterior to lambda, 2 mm lateral to midline, and 0.25 mm ventral to lambda), i.e., probes were positioned bilaterally. The connector and guide cannulae were secured to the skull with dental acrylic. A minimum 1 week recovery period preceded the start of the habituation procedure.
Habituation.
Recordings were performed in noise-attenuated and electrically shielded chambers (EPC-010; BRS/LVE). Recording chambers housed a large, open-topped Plexiglas bowl (Rodent bowl MD-1514; BASi). Inside the bowl, mice had ad libitum access to food and water. A video camera, mounted to the chamber ceiling, permitted visual monitoring of mouse behavior. Mice were habituated through daily 20 min exposures for 4 consecutive days. During each exposure, mice were connected to a lightweight, counterbalanced recording cable. On the fifth day, mice were left overnight and experimental recordings and microdialysis perfusion commenced the following morning.
Experimental protocol.
Mice were gently restrained on the morning of experiments as the dummy cannulae were removed from their guides and the microdialysis probes were inserted (CX-6–01; Eicom). Probes projected 3 mm from the tip of the guide, targeting the ventrobasal complex. The membrane tips of the probes were 1 mm long and 0.22 mm wide with a molecular weight cutoff of 50,000 Da. The probes were continuously flushed with artificial CSF (aCSF) at a flow rate of 2.1 μl/min. ACSF was bubbled with CO2 to a pH of 7.38 ± 0.01 and warmed to 37°C. The composition of aCSF was as follows (in mm): 125 NaCl, 3 KCl, 1 KH2PO4, 2 CaCl2, 1 MgSO4, 25 NaHCO3, and 30 d-glucose.
All experiments were performed during the day, when the mice normally sleep. In all of the mice studied, the data collected during the first hour following probe insertion were excluded from analysis. The entire experimental protocol occurred over a 5 h period (1030–1530 h). Data obtained in the first half hour following switching of the microdialysis perfusate were also excluded from analyses.
THIP, a δGABAAR-preferring agonist, and etomidate, a general anesthetic agent that promotes extrasynaptic GABAAR activity (Forman, 2011; Meera et al., 2011), were purchased from Tocris Bioscience. Two concentrations of THIP (10 and 50 μm) and etomidate (10 and 30 μm) were prepared in aCSF. Importantly, the amount of media that diffuses across the microdialysis probe membrane into tissue is reported to be 10–18% of the original perfusate concentration (Portas et al., 1996; Grace et al., 2014). Thus, the effective concentrations of THIP at the ventrobasal complex are expected to have been ∼1–1.8 and 5–9 μm, while the expected effective concentrations of etomidate at the thalamus were ∼1–1.8 and 3–5.4 μm at the probe tip. The concentrations of THIP used in this study were selected based on clinically relevant doses in humans, with serum and plasma concentrations in the same range as our effective concentrations enhancing sleep quality and sedation (Madsen et al., 1983; Faulhaber et al., 1997). Additionally, the effects of THIP at synaptic GABAARs are minimal at these concentrations, whereas there is modulation of extrasynaptic GABAARs (Brown et al., 2002; Belelli et al., 2005; Jia et al., 2005; Drasbek and Jensen, 2006). The concentrations for etomidate were selected after consideration of the plasma concentrations that yield hypnosis in humans and loss of righting reflex in mice, with concentrations in this same range (1–5 μm) eliciting both of these effects (De Paepe et al., 1999; Benkwitz et al., 2007). In addition, previous in vitro studies report that at concentrations in this range, etomidate elicits increased extrasynaptic GABAAR-mediated tonic inhibition in thalamocortical neurons of the ventrobasal complex (Belelli et al., 2005; Forman, 2011; Herd et al., 2014).
Importantly, at the effective concentrations used in this study, the ability of etomidate to promote GABAAR activity depends on the presence of GABA, since etomidate likely acts as a positive allosteric modulator rather than an agonist of GABAARs at these concentrations (Forman, 2011). This requirement for GABA differs for THIP, which acts as a δGABAAR-preferring agonist even at low concentrations (Meera et al., 2011). To ensure that ambient GABA concentrations were sufficient for etomidate-mediated actions on both synaptic and extrasynaptic GABAARs, additional experiments were conducted where etomidate was microperfused into the ventrobasal complex together with blockers of GABA transporters (GAT)-1 and -3. Specifically, 10 and 30 μm solutions of etomidate were prepared in aCSF containing 100 μm 1,2,5,6-tetrahydro-1-[2-[[(diphenylmethylene)amino]oxy]ethyl]-3-pyridinecarboxylic acid hydrochloride (NO-711; Sigma-Aldrich), a GAT-1 inhibitor, and 300 μm 1-[2-[tris(4-methoxyphenyl)methoxy]ethyl]-(S)-3-piperidinecarboxylic acid (SNAP-5114; Tocris Bioscience), a GAT-3 inhibitor. GAT-1 and -3 serve as the primary mediators of synaptic GABA clearance in the thalamus (De Biasi et al., 1998; Beenhakker and Huguenard, 2010). The concentrations of NO-711 and SNAP-5114 used in this study were chosen because they increase extracellular GABA concentrations in vivo using the same methodology of reverse microdialysis as our study and also do not generate spike-wave discharges (Smith et al., 2007; Cope et al., 2009; Kersanté et al., 2013). Additionally, in vitro inhibition of these transporters, using similar effective concentrations of NO-711 and SNAP-5114, greatly enhances extrasynaptic GABAAR-mediated effects on IPSC duration (i.e., “spill-over” inhibition) in thalamocortical neurons (Herd et al., 2013).
Baseline recordings were performed in each mouse while the ventrobasal complex was microperfused with aCSF for 2 h. The perfusion media was then switched to THIP (n = 9 wild-type mice and n = 9 Gabrd−/− mice), etomidate (n = 9 wild-type mice and n = 9 Gabrd−/− mice), or etomidate with NO-711 and SNAP-5114 (n = 6 wild-type mice). In the first study, mice received 10 μm THIP for 1.5 h, followed by 50 μm THIP for another 1.5 h. In the second (separate) study, the ventrobasal complex was perfused with 10 μm etomidate for 1.5 h and then 30 μm etomidate for the additional 1.5 h. A third study was conducted that was identical to the second study, except for the inclusion of 100 μm NO-711 and 300 μm SNAP-5114 in the aCSF that contained etomidate. Finally, a fourth time-control study was conducted where the perfusion medium was maintained solely as aCSF (n = 6 wild-type mice and n = 6 Gabrd−/− mice; Fig. 1). These time controls ensured that none of the identified sleep-state effects of THIP and/or etomidate could be attributed to time-of-day influences.
Figure 1.

Experimental protocol and localization of microdialysis probes in the thalamus. A, Schematic illustrating the four major experiments and treatment groups and the duration for each agent microperfused into the ventrobasal complex. Nine wild-type and 9 Gabrd−/− mice were used for the study of THIP at the ventrobasal complex (top). Nine wild-type and 9 Gabrd−/− mice were used for the study of etomidate (middle top). Six wild-type mice were used for the study of GABA re-uptake inhibition with etomidate (middle bottom). Six wild-type and six Gabrd−/− mice were used for the time-control study (bottom). B, Schematic indicating the target of the microdialysis probe locations to the ventrobasal complex (top) and exemplar histological images indicating probe locations (bottom). The arrows indicate the locations of the tip of the microdialysis membranes. C, Schematics illustrating the locations of the microdialysis membranes for all of the mice studied. Numbers indicate the distance posterior to bregma (Franklin and Paxinos, 2007). Each probe track is made translucent to allow for visualization of probe site distribution across all the mice studied. The ventrobasal complex is comprised of the ventral posteromedial (VPM) and ventral posterolateral (VPL) thalamic nuclei. D, Exemplar EEG and EMG recordings collected during the experiments.
At the end of the in vivo recordings, the mice were deeply anesthetized with 5% isoflurane and transcardially perfused with 0.9% saline, followed by 10% formalin solution, while the microdialysis probes were left in the brain. This procedure allowed for stable fixation of the brains for the subsequent localization of probe sites by histology. Brains were then dissected and immersion fixed in 10% formalin for 2 d at room temperature. Following fixation, the brains were transferred to a 30% sucrose solution for 2 d at 4°C. Brains were subsequently cut coronally into 50 μm slices using a cryostat (Leica CM 1850). Sections were then mounted on slides and dried overnight. Neutral red staining was performed the following day. Probe site location was verified through imaging of the stained sections using the Infinity Capture software package (Lumenera).
Signal acquisition and analysis of sleep–wake states.
Signals were acquired using Spike 2 software (1401 interface; CED). The EEG and EMG signals were amplified 10,000 and 5000 times, filtered between 1 and 100 Hz and 100–1000 Hz, and digitized at 2000 Hz and 500 Hz, respectively (Super-Z headstage amplifiers and BMA-400 amplifiers/filters; CWE).
Sleep–wake states were scored by analyzing EEG and EMG signals in consecutive 5 s epochs. For each epoch, the corresponding sleep–wake state was defined using an automatic scoring protocol (Costa-Miserachs et al., 2003). The accuracy of the scoring procedure was confirmed visually for each epoch. The amount of time spent in wakefulness, NREM, and REM sleep was calculated as a percentage of the total recording time for each treatment in each animal. A period of sustained (stable) wakefulness or sleep was defined as a series of epochs in one state lasting >30 s. Transitions between states were calculated as a percentage of the total number of transitions, per treatment, in each animal.
Electrocortical activity was further analyzed using a fast Fourier transform (FFT) algorithm (SUDSA22 script, Spike2 software; CED). Power spectra were generated for every 5 s epoch of the EEG that was scored for sleep–wake state, through the analysis of overlapping 1024-sample segments that were windowed with a raised cosine (Hanning) and subjected to an FFT. Each 5 s epoch was analyzed for absolute power in five bandwidths: delta (1–4 Hz), theta (4–8 Hz), alpha (8–12 Hz), beta (12–30 Hz), and sigma (10–15 Hz). The absolute power in each bandwidth was divided by the total power (1–30 Hz) in each epoch and the normalized powers were sorted according to their corresponding sleep–wake state. The mean power in each frequency band for each sleep–wake state was then calculated for each treatment in each subject.
Identification and characterization of spindle-like oscillations.
The incidence and features of spindle-like oscillations were identified using custom-written routines in MATLAB (MATLAB R12; The MathWorks; RRID: nlx 153890). The EEG during NREM sleep was analyzed with overlapping segments of 4096 samples, windowed using a raised cosine (Hanning window), and subjected to an FFT to yield the power spectrum with a resolution of 0.25 Hz. To identify and characterize spindle-like oscillations the powers from 0 to 2.5 and 5 to 15 Hz were removed to optimize fitting of data from 2.5 to 5 and 15 to 35 Hz according to a power law: Log10(F(x)) = mlog10(x) + b; F(x) = (10b)(xm), where x represents frequency, m represents slope, and b is the y-intercept. The expected power in the sleep spindle range (7–14 Hz) was then predicted from this power law. This value was then used as a threshold for the identification of spindle-like oscillations (for the fit of this power law and the suitability of the threshold in detecting spindle-like oscillations, see Results). The EEG was then bandpass filtered from 7 to 14 Hz and downsampled to 200 Hz (i.e., smoothed). The root mean square of the down-sampled 7–14 Hz EEG was calculated with a window length of 200 samples (i.e., 1 s of data sampled at 200 Hz) and overlap of 150 samples (i.e., 0.75 s). Whenever the resulting root mean squared EEG surpassed the predicted 7–14 Hz threshold, and did so for a period of time consistent with spindle-like oscillation duration (0.5–3 s; Astori et al., 2013), these events were identified as spindle-like oscillations. The incidence of these spindle-like oscillations was also calculated by dividing their total number by the total time spent in NREM sleep for a given recording period.
Temporal analysis of state transitions.
We also investigated the temporal dynamics of state transitions by analyzing trajectories in cortical activity using 2D state-space plots (Gervasoni et al., 2004; Diniz Behn et al., 2010). The absolute power in three bandwidths (1–9, 7–9, and 1–19 Hz) was analyzed for every 5 s epoch of the EEG (FFT size 1024, Hanning window, i.e., as described above). The ratio of 7–9/1–9 Hz was then calculated for each epoch, providing a measure for the relative contribution to the signal of faster frequencies in the1–9 Hz range. An increase in the 7–9/1–9 Hz ratio indicates a relative shift to faster frequencies, as occurs during transitions from NREM sleep to wakefulness or REM sleep. Values were then smoothed using a moving average function (smooth, MATLAB; window-length of five 5 s epochs). To permit intersubject comparisons, the smoothed data were then normalized according to the transformation: x′ = (x-min)/(max-min), where x′ is the normalized value, x is the original value, min is the minimum value for the dataset, and max is the maximum value. The resulting normalized power ratio plotted against the 1–19 Hz frequency band generates distinct clusters of EEG frequency-derived data points that correspond to sleep–wake states (Gervasoni et al., 2004; Diniz Behn et al., 2010). Defining these data points to clusters was done mathematically and without a priori visual classification into sleep–wake states (function kmeans, MATLAB, 10 replicates of the function before classifying data points to a cluster). The total number of clusters assigned per recording (two to three) was determined by assessing the fit of data points to their defined cluster, through comparisons of their distance to other cluster centers (function silhouette, MATLAB); three clusters were initially assigned for each recording, but if the data points of a cluster exhibited poor grouping (i.e., a mean silhouette value ≤ 0.5, MATLAB) clustering was performed with two defined clusters. The temporal dynamics of stable state transitions were then investigated by calculating the spectral “distance” traveled between clusters.
Statistical analysis.
The effects of THIP and etomidate on sleep–wake structure, electrocortical activity, spindle-like oscillations, and state dynamics were assessed using a two-way repeated-measures (RM) ANOVA, with the factor: (1) drug treatment (i.e., aCSF, followed by the separate interventions with THIP or etomidate) and (2) genotype (i.e., wild-type and Gabrd−/− mice). The influence of ambient GABA concentrations on any of the identified effects of etomidate were further evaluated within wild-type mice using a two-way RM-ANOVA with the factors of drug treatment and group (i.e., with or without GABA re-uptake inhibitors). Comparisons between test and time-control mice were made during corresponding times of the experiment, i.e., during the same times of recording when the test mice received aCSF and the different concentrations of THIP or etomidate, again using a two-way ANOVA with the factors group (i.e., drug vs time-control) and genotype. Bonferroni-corrected p values were used to test statistical significance when post hoc comparisons were performed. Differences were considered significant if p < 0.05. Analyses were performed using SigmaStat software (SPSS). Data are expressed as mean ± SEM.
Results
The experimental protocol performed in the three groups of animals is outlined in Figure 1, and a sample of the original EEG and EMG signals are also shown. Figure 1 also shows an example of histological sections from a single animal, which illustrates the location of the two microdialysis probes on either side of the midline in the ventrobasal complexes of the thalamus. The locations of the microdialysis probes in all of the mice used in the study are also illustrated on standard cross sections. The probes were successfully implanted into the ventrobasal complex in all animals.
THIP
First we identified the effects of modulation of thalamic δGABAARs on electrocortical activity in freely behaving wild-type mice and Gabrd−/− mice. Here we show that microperfusion of the δGABAAR-preferring agonist THIP into the ventrobasal complex of the thalamus produced significant effects on electrocortical activity in wild-type mice but not in Gabrd−/− mice, i.e., the effects of THIP were dependent on δGABAARs. THIP: (1) increased 1–4 Hz power in wakefulness and NREM sleep, consistent with its sedating effects; (2) reduced spindle-like oscillations in NREM sleep; and (3) increased the speed of stable transitions into NREM sleep, indicating effects on state-space dynamics. These results are detailed below.
Thalamic δGABAAR modulation and EEG spectral power
NREM sleep.
In agreement with the hypothesis, microperfusion of the δGABAAR-preferring agonist THIP into the ventrobasal complex significantly increased power in the 1–4 Hz EEG frequency band in NREM sleep in wild-type mice, but not in the Gabrd−/− mice (Fig. 2A–C). Analysis of the group data in Figure 2C indicated that there was a significant effect of THIP at the ventrobasal complex on 1–4 Hz EEG power in NREM sleep, with this response dependent on genotype (F(2,31) = 11.85, p < 0.001, two-way RM-ANOVA). Further analysis identified that in wild-type mice 50 μm THIP increased 1–4 Hz EEG power in NREM sleep compared with both aCSF and 10 μm THIP (each p ≤ 0.002, post hoc paired t test). Importantly, however, and in agreement with the main hypothesis, no such effects of THIP on 1–4 Hz EEG activity were observed in the Gabrd−/− mice (each p > 0.06; Fig. 2C).
Figure 2.

Promoting thalamic δGABAAR activity with THIP at the ventrobasal complex increases 1–4 Hz electrocortical activity during NREM sleep and waking. A, Example power spectrums and hypnograms from a wild-type and Gabrd−/− mouse during microperfusion of the ventrobasal complex with aCSF and 50 μm THIP. Each plot illustrates the last 30 min of the respective treatment session. Note the increase in lower frequency power in the wild-type mouse with THIP and the absence of such an effect in the Gabrd−/− mouse. B, Continuous frequency plots illustrating the percentage change in power with 50 μm THIP relative to aCSF during NREM sleep, waking, and REM sleep. Each trace illustrates the mean ± SEM. C, Changes in 1–4 Hz power with 10 and 50 μm THIP. Note the increase in 1–4 Hz power with microperfusion of 50 μm THIP into the ventrobasal complex during NREM sleep and waking in wild-type mice, and the absence of these effects in Gabrd−/− mice. D, Additional changes in electrocortical activity with THIP. Plots illustrate the percentage increase or decrease in theta (4–8 Hz), alpha (8–12 Hz), and beta (12–30 Hz) power with 50 μm THIP relative to aCSF. Two-way RM-ANOVA, *p < 0.05, **p < 0.01, and ***p < 0.001. See Results for further details.
As well as the increased 1–4 Hz EEG power elicited by THIP at the ventrobasal complex of the thalamus in the wild-type mice, there was decreased theta (4–8 Hz) and alpha (8–12 Hz) activity in NREM sleep (each p ≤ 0.01, post hoc paired t test), i.e., there was a general shift to increased lower frequency EEG power produced by the δGABAAR-preferring agonist. Importantly, again, no such effects were observed in the Gabrd−/− mice (each p > 0.61). Nevertheless, there was an increase in beta (12–30 Hz) EEG power in NREM sleep during microperfusion of 50 μm THIP into the ventrobasal complex in the Gabrd−/− mice compared with baseline recordings with aCSF (p = 0.002), with this as the only significant effect of THIP observed in the Gabrd−/− mice. Figure 2C also shows that in NREM sleep there was a baseline difference in 1–4 Hz EEG power between genotypes in the absence of THIP (i.e., during microperfusion of aCSF into the ventrobasal complex), with 1–4 Hz power greater in the Gabrd−/− mice compared with the wild-type mice (p = 0.006, post hoc t test). However, such a baseline difference was not observed in wakefulness or REM sleep (Fig. 2C).
Wakefulness.
As with the effects observed in NREM sleep that supported the main hypothesis (50 μm THIP at the ventrobasal complex), to increase tonic neuronal inhibition also increased 1–4 Hz EEG power in wakefulness in the wild-type mice compared with both aCSF and 10 μm THIP (each p < 0.04, post hoc paired t test). Again, no such effects were observed in the Gabrd−/− mice (each p > 0.50). The increased 1–4 Hz EEG power elicited by THIP in the wild-type mice was also associated with a corresponding decrease in alpha and beta EEG power in waking (each p ≤ 0.01), again reflecting a general shift to increased lower frequency electrocortical activity caused by thalamic δGABAAR modulation. Also in agreement with the main hypothesis, no such effects were observed in the Gabrd−/− mice (each p > 0.61).
REM.
There was no effect of THIP at the ventrobasal complex on any measure of EEG activity, in any frequency band, in REM sleep (all p > 0.05; Fig. 2B–D).
Thalamic δGABAAR modulation and spindle-like oscillations
We next examined the effects of thalamic δGABAAR activation on the incidence and duration of spindle-like oscillations. This is because sleep spindles are generated by the thalamus, and spindles are most prevalent in periods of NREM sleep with reduced 1–4 Hz EEG power, i.e., “lighter” periods of NREM sleep (Nuñez et al., 1992; Steriade et al., 1993).
Sigma power.
Ten to 15 Hz EEG power during NREM sleep is often taken to indicate spindle-like activity (Astori et al., 2013). Figure 3A shows that microperfusion of 50 μm THIP into the ventrobasal complex of the thalamus significantly decreased 10–15 Hz EEG power in NREM sleep in wild-type mice compared with both aCSF and 10 μm THIP (each p ≤ 0.028, post hoc paired t test). Together, the effect of pharmacological manipulation of thalamic tonic neuronal inhibition in decreasing 10–15 Hz power (Fig. 3A) and increasing 1–4 Hz power (Fig. 2C) in the wild-type mice is consistent with a reciprocal relationship between these frequency bands during NREM sleep (Nunez et al., 1992; Steriade et al., 1993).
Figure 3.
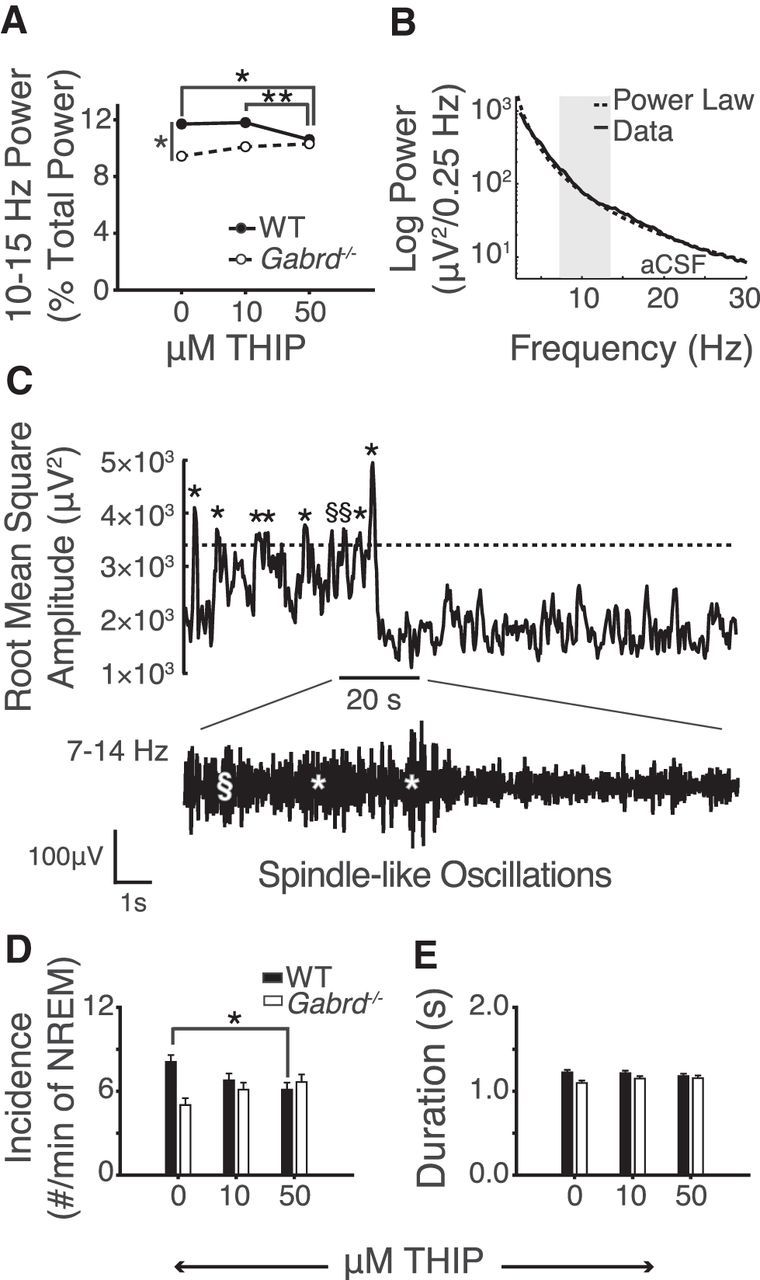
Promoting thalamic δGABAAR activity with THIP at the ventrobasal complex decreases both sigma power and the incidence of spindle-like oscillations. A, Fifty micromolars of THIP at the ventrobasal complex decreases 10–15 Hz sigma power in wild-type mice. Also note the baseline difference in sigma power between wild-type and Gabrd−/− mice. B, Example of the threshold-defining protocol for the automatic detection of spindle-like oscillations. A power law is used to predict the power in the spindle range (7–14 Hz). See Materials and Methods for further description and application. C, Example of spindle-like oscillation detection. When the filtered 7–14 Hz EEG surpasses the predefined spindle threshold, these events qualify as spindle-like oscillations if they meet a duration criteria of 0.5–3 s. §, events that failed to meet duration criteria; *events that met this criterion and were identified as spindle-like oscillations. D, The incidence of spindle-like oscillations is reduced in wild-type mice with 50 μm THIP at the ventrobasal complex. Note the lack of effect in Gabrd−/− mice. E, THIP had no effect on the average duration of spindle-like oscillations. Two-way RM-ANOVA, *p < 0.05, **p < 0.01.
Importantly, this effect of δGABAAR modulation at the ventrobasal complex on 10–15 Hz activity was also dependent on genotype (F(2,31) = 7.83, p = 0.002, two-way RM-ANOVA); no significant effects of THIP were observed in the Gabrd−/− mice (each p > 0.06, post hoc paired t test; Fig. 3A). Figure 3A also shows that in the absence of THIP (i.e., during baseline recordings with aCSF) 10–15 Hz EEG power was lower in the Gabrd−/− mice compared with the wild-type mice (p = 0.020, post hoc t test). This difference is also consistent with the elevated baseline 1–4 Hz power seen during NREM sleep in the Gabrd−/− mice (Fig. 2C).
Incidence and duration of spindle-like oscillations (7–14 Hz).
Figure 3, B and C, shows the automated detection of individual transient spindle-like oscillations from electrocortical activity, i.e., as opposed to sigma power that occurs throughout NREM sleep (described in the previous section). First, we fit a power law to the EEG data obtained during NREM sleep in each mouse with each treatment. An example of this fit is shown in Figure 3B. This fit was then used to identify the baseline power in the 7–14 Hz frequency band during NREM sleep to set a threshold value for identifying individual transient spindle-like oscillations that add to the power in this frequency range (see Materials and Methods for details). When 7–14 Hz power was transiently increased above this threshold for between 0.5 and 3 s, spindle-like oscillations were identified (Astori et al., 2013; Fig. 3C).
The group data in Figure 3D show that the effect of THIP on the incidence of spindle-like oscillations depended on genotype (F(2,32) = 7.32, p = 0.002, two-way RM-ANOVA). Further analysis identified that spindle-like oscillations were reduced with 50 μm THIP in the wild-type mice only (p = 0.022, post hoc paired t test). This effect of promoting tonic neuronal inhibition at the ventrobasal complex on reducing spindle-like oscillations in NREM sleep in the wild-type mice is consistent with the reduced sigma power observed in Figure 3A.
There was no effect of either THIP or genotype on the duration of spindle-like oscillations (Fig. 3E), suggesting that, once triggered, spindle-like oscillations were normally propagated and terminated regardless of δGABAAR modulation.
Thalamic δGABAAR modulation and state-space dynamics
Next we identified if pharmacologically induced thalamic δGABAAR modulation altered the trajectory between behavioral states in these freely behaving mice. This was identified through analysis of the “speed” of transitions between EEG-defined spectral boundaries that defined the states of wakefulness and sleep, i.e., speed as derived from measures in the spectral domain (Fig. 4A,B).
Figure 4.

Thalamic δGABAAR activity facilitates rapid transitions into the spectral domain characteristic of deep NREM sleep. A, Example state-space plots from a wild-type and Gabrd−/− mouse during microperfusion of the thalamus with aCSF and 50 μm THIP. B, Exemplar state-space plots depicting stable transitions from waking into NREM sleep during microperfusion of the thalamus with aCSF and 10 and 50 μm THIP. Note the increased spectral distance traveled between states with 50 μm THIP (black trace) in wild-type mice. C, Movement through spectral space into the region occupied by NREM sleep is significantly facilitated by 50 μm THIP at the ventrobasal complex of wild-type mice, but this effect is not apparent in Gabrd−/− mice. THIP at the ventrobasal complex had no effect on the speed of spectral transitions into wakefulness or REM sleep. Two-way RM-ANOVA, *p < 0.05, **p < 0.01.
Figure 4A shows the clustering of data points associated with predefined frequency bands in time (see Materials and Methods). These points cluster in spectral space in regions that correspond to the states of wakefulness, NREM, and REM sleep, together termed “state space” (Gervasoni et al., 2004; Diniz Behn et al., 2010). Figure 4B shows a close-up of three transitions into stable (i.e., > 30 s duration) periods of NREM sleep, from preceding periods of wakefulness, in one wild-type and one Gabrd−/− mouse. Example transitions are shown for microperfusion of aCSF into the ventrobasal complex and for modulation of thalamic δGABAARs with 10 and 50 μm THIP.
Group data show that promoting thalamic δGABAAR-mediated inhibition increased the speed of transitions into NREM sleep as identified from EEG-defined spectral state space (Fig. 4C). Further analysis identified that the effect of THIP at the ventrobasal complex on the trajectory between behavioral states was specific for NREM sleep and depended on genotype (F(2,31) = 3.49, p = 0.043, two-way RM-ANOVA). The speed of transitions into NREM sleep in the spectral domain was increased with 50 μm THIP compared with aCSF and 10 μm THIP in wild-type mice (each p < 0.014, post hoc paired t test). This effect of increased tonic thalamic neuronal inhibition in facilitating EEG transitions into regions of the spectral domain consistent with deep NREM sleep was only observed in the wild-type mice and not in the Gabrd−/− mice (each p > 0.43, post hoc paired t test).
Amounts of sleep–wake states.
Although there were effects of THIP at the ventrobasal complex on EEG spectral power within sleep–wake states (Figs. 2, 3) and state-space dynamics (Fig. 4), there were no effects of THIP on the amounts of wakefulness, NREM, and REM sleep (F(2,30) < 2.38, p > 0.110, two-way RM-ANOVA). Nor were there any effects of THIP on sleep–wake distribution between genotypes (F(2,30) < 1.18, p > 0.322, two-way RM-ANOVA). To further confirm these data, additional time-control experiments were performed with continued microperfusion of aCSF into the ventrobasal complex of wild-type and Gabrd−/− mice. There was no difference in the amounts of wakefulness, NREM, and REM sleep in the time-control experiments compared with the experiments with THIP (each F(1,26) < 2.48, p > 0.127, two-way ANOVA) and this absence of effect did not depend on genotype (each F(1,26) < 1.73, p > 0.200, two-way ANOVA).
Etomidate
Next we identified if the effects on electrocortical activity of microperfusion of etomidate into the ventrobasal complex were mediated by δGABAARs. Here we show that compared with THIP, microperfusion of etomidate into the ventrobasal complex produced different effects on electrocortical activity that were independent of δGABAARs. In summary, etomidate: (1) decreased 1–4 Hz power, increased 8–12 and/or 12–30 Hz power in all sleep–wake states; (2) increased spindle-like oscillations; (3) had no effect on the trajectory between behavioral states as analyzed by state-space dynamics; (4) increased REM sleep expression; and (5) that these effects largely persisted under conditions that favored potentiation of extrasynaptic GABAARs by etomidate with co-application of GAT-1 and -3 inhibitors to the thalamic perfusion media.
Microperfusion of etomidate into the ventrobasal complex and effects on EEG spectral power
NREM sleep.
In contrast to the effects of THIP at the ventrobasal complex, which promoted electrocortical signatures of deep NREM sleep—an effect that depended on the presence of δGABAARs, as it occurred only in the wild-type mice (Figs. 2–4)—microperfusion of etomidate into the same region of the thalamus significantly decreased power in the 1–4 Hz EEG frequency band in NREM sleep in both the wild-type and the Gabrd−/− mice (Fig. 5A–C). Analysis of the group data in Figure 5C indicated that there was a significant effect of etomidate at the ventrobasal complex on 1–4 Hz EEG power in NREM sleep (F(2,32) = 35.79, p < 0.001, two-way RM-ANOVA), with this response to treatment independent of genotype (F(2,32) = 1.56, p = 0.225), i.e., the pattern of response was independent of δGABAARs. Unlike THIP, however, which increased 1–4 Hz EEG power in NREM sleep, 10 and 30 μm etomidate decreased 1–4 Hz EEG power compared with aCSF (each p < 0.001, post hoc paired t test). There was an independent effect of genotype on 1–4 Hz EEG power (F(1,16) = 4.55, p = 0.049, two-way RM-ANOVA), with wild-type mice exhibiting significantly lower 1–4 Hz power at baseline, consistent with the baseline differences that were identified in the study with THIP (post hoc t test, p = 0.028).
Figure 5.

Etomidate at the ventrobasal complex decreases 1–4 Hz electrocortical activity in both wild-type and Gabrd−/− mice (i.e., opposite to the effects of THIP). A, Exemplar power spectrums and hypnograms from a wild-type and Gabrd−/− mouse during microperfusion of the ventrobasal complex with aCSF and 30 μm etomidate. Each plot illustrates the last 30 min of the respective treatment session. Note the decrease in lower frequency power and increase in higher frequency power in wild-type and Gabrd−/− mice with etomidate. B, Continuous frequency plots illustrating the percentage change in power with 30 μm etomidate relative to aCSF during NREM sleep, waking, and REM sleep. Each trace illustrates the mean ± SEM. C, Changes in 1–4 Hz power with 10 and 30 μm etomidate. Note the decrease in 1–4 Hz power with 10 and 30 μm etomidate during NREM sleep, waking, and REM sleep in wild-type and Gabrd−/− mice. D, Additional changes in electrocortical activity with etomidate. Plots illustrate the percentage increase or decrease in theta (4–8 Hz), alpha (8–12 Hz), and beta (12–30 Hz) power with 30 μm etomidate relative to aCSF. Note the increase in alpha and/or beta power in wild-type and Gabrd−/− mice during all sleep–wakes states. Two-way RM-ANOVA, *p < 0.05, **p < 0.01, and ***p < 0.001.
As well as the decreased 1–4 Hz EEG power elicited by etomidate at the ventrobasal complex of the thalamus, there was increased alpha (8–12 Hz) and beta (12–30 Hz) EEG activity in NREM sleep (both F(2,32) > 16.60, p < 0.001, two-way RM-ANOVAs; Fig. 5D). These responses were independent of genotype as they occurred in both the wild-type and Gabrd−/− mice (both F(2,32) < 0.55, p > 0.546, two-way RM-ANOVA; Fig. 5D). These data indicate that there was a general shift to decreased lower frequency EEG power and increased higher frequency power produced by etomidate at the ventrobasal complex, with this response independent of δGABAARs.
Wakefulness and REM sleep.
Consistent with the effects of etomidate at the ventrobasal complex on 1–4 Hz EEG power in NREM sleep, there were also significant effects of etomidate on the spectral composition of the EEG in wakefulness and REM sleep. These effects are illustrated in Figure 5B–D. As for NREM sleep, etomidate also decreased 1–4 Hz EEG power in wakefulness and REM sleep, despite the decrease in ambient GABA that is associated with both of these states compared with NREM sleep (Saper et al., 2001). This reduction in 1–4 Hz EEG power with etomidate occurred regardless of genotype (each p > 0.07, two-way RM-ANOVA) and was significant for 10 and 30 μm etomidate in waking (each p < 0.041, post hoc paired t test) and in REM sleep (each p < 0.023). Figure 5D shows that this general shift to decreased slower frequency EEG activity elicited by etomidate was also accompanied by significantly increased 12–30 Hz EEG power in the wild-type and Gabrd−/− mice in wakefulness (F(2,32) = 13.46, p < 0.001, two-way RM-ANOVA) and 8–12 Hz EEG power in REM sleep (F(2,28) = 8.53, p = 0.001).
Etomidate at the ventrobasal complex and spindle-like oscillations
Here we show that unlike the effects of THIP at the ventrobasal complex, which produced a δGABAAR-specific reduction in spindle-like oscillations in NREM sleep, etomidate increased both sigma power and the incidence and duration of spindle-like oscillations in NREM sleep, with these effects independent of genotype.
Sigma power.
Figure 6A shows that there was a significant effect of etomidate at the ventrobasal complex of the thalamus on 10–15 Hz EEG power in NREM sleep (F(2,32) = 47.20, p < 0.001, two-way RM-ANOVA) that was dose dependent (each p < 0.001 vs aCSF, post hoc paired t test). This effect of etomidate on sigma power was not influenced by genotype (F(2,32) = 0.48, p = 0.625, two-way RM-ANOVA). There was, however, an independent effect of genotype on sigma power (F(1,16) = 7.17, p = 0.017), with wild-type mice exhibiting significantly higher 10–15 Hz power at all doses of etomidate (each p < 0.025, post hoc t test).
Figure 6.

Etomidate at the ventrobasal complex promotes sigma power and increases the incidence and duration of spindle-like oscillations via a δGABAAR-independent mechanism (i.e., unlike the effects of THIP). A, Ten and 30 μm etomidate significantly increased sigma (10–15 Hz) power during NREM sleep. B, Thirty micromolars etomidate at the ventrobasal complex increased the incidence and (C) duration of spindle-like oscillations (SLO). Note the differences in sigma power and spindle-like oscillation incidence and duration between genotypes at baseline and with etomidate. Two-way RM-ANOVA, *p < 0.05, **p < 0.01, and ***p < 0.001.
Incidence and duration of spindle-like oscillations (7–14 Hz).
The group data in Figure 6, B—C, show that etomidate at the ventrobasal complex of the thalamus increased the incidence and duration of spindle-like oscillations (both F(2,32) > 14.07, p < 0.001, two-way RM-ANOVA) with this effect evident in both wild-type mice and Gabrd−/− mice (F(2,32) < 0.73, p > 0.490). Consistent with the genotypic differences in sigma power identified above and in the study with THIP, an effect of genotype on spindle-like oscillations was also identified, with reduced incidence and duration in the Gabrd−/− mice (both F(1,16) > 5.83, p < 0.029, two-way RM-ANOVA; Fig. 6B–C).
Etomidate at the ventrobasal complex and state-space dynamics
We next identified if etomidate altered the trajectory between behavioral states. As with the experiments with THIP, this was identified from analysis of the speed of transitions between EEG-defined spectral boundaries that defined the states of wakefulness and sleep. Unlike with THIP at the ventrobasal complex, however, which increased the speed of stable transitions into NREM sleep (Fig. 4), there was no effect of etomidate on such EEG transitions between behavioral states (each F(2,31) < 2.12, p > 0.136, two-way RM-ANOVA; Fig. 7).
Figure 7.

Etomidate had no effect on the temporal dynamics of state transitions in spectral space. A, Exemplar state-space plots from a wild-type and Gabrd−/− mouse during microperfusion of the thalamus with aCSF and 30 μm etomidate. B, Etomidate had no effect on the speed of transitions between states in the spectral domain in both wild-type and Gabrd−/− mice.
Etomidate at the ventrobasal complex increases REM sleep expression
Figure 8 shows that microperfusion of etomidate into the ventrobasal complex of the thalamus increased REM sleep expression (F(2,32) = 6.07, p = 0.006, two-way RM-ANOVA), with this effect independent of genotype (F(2,32) = 0.11, p = 0.901). The significant increase in REM sleep amount occurred with 30 μm etomidate (p = 0.004, post hoc paired t test; Fig. 8A,B). There were no effects of etomidate at the ventrobasal complex on the amounts of wakefulness or NREM sleep (both F(2,32) < 1.82, p > 0.178, two-way RM-ANOVA; Fig. 8B). There were also more transitions into and out of REM sleep with etomidate at the ventrobasal complex (both F(2,32) > 4.52, p < 0.020, two-way RM-ANOVA; Fig. 8A,C). This increase in REM sleep amount with etomidate was associated with a decrease in the proportion of direct transitions from NREM sleep to wakefulness (F(2,32) = 5.20, p = 0.011; Fig. 8C). There were no effects of etomidate on transitions into NREM sleep (F(2,32) = 1.18, p = 0.320; Fig. 8C). A genotypic effect on the proportion of direct transitions from NREM sleep to wakefulness was also identified (F(1,16) = 6.42, p < 0.022, one-way RM-ANOVA), with Gabrd−/− mice exhibiting a higher proportion of direct transitions from NREM sleep to wakefulness at baseline and with 30 μm etomidate (both p < 0.023, post hoc t test). This finding is consistent with the trend toward a lower proportion of overall transitions from REM sleep to wakefulness (Fig. 8C). Importantly, and as mentioned above, this effect on state dynamics was not associated with any overall differences in the time spent in each state.
Figure 8.
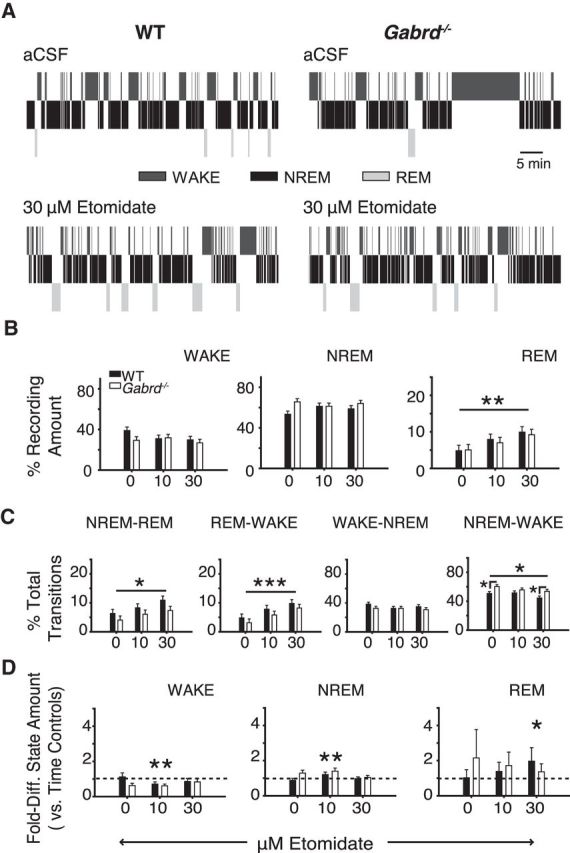
Etomidate at the ventrobasal complex increased REM sleep expression independent of δGABAAR expression (i.e., effects were observed in wild-type and Gabrd−/− mice). A, Exemplar hypnograms highlighting the increase in REM sleep expression with 30 μm etomidate. B, Thirty micromolars of etomidate at the thalamus had no effect on the relative amount of wakefulness or NREM sleep, but significantly increased the amount of REM sleep; two-way RM-ANOVA. C, Thirty micromolars of etomidate significantly increased the number of transitions into and out of REM sleep. This was associated with a significant decrease in the number of direct transitions from NREM sleep to wakefulness; two-way RM-ANOVA. D, Comparison of the amounts of sleep and wakefulness between test mice and time-control mice that received sham treatment (i.e., continuous microperfusion of aCSF) at the ventrobasal complex at the corresponding time points where test mice received etomidate. Mice receiving 30 μm etomidate exhibited a greater amount of REM sleep relative to time controls. Note the additional effects of 10 μm etomidate on the amount of wakefulness and NREM sleep. Two-way ANOVA; *p < 0.05, **p < 0.01, and ***p < 0.001. WT, wild-type.
The increase in REM sleep amounts with etomidate at the ventrobasal complex was due to the effects of the drug per se, and not simply due to the fact that the etomidate interventions were performed after the interventions with aCSF. This is because additional experiments showed that the amounts of REM sleep with 30 μm etomidate were significantly increased compared with the same time of day as the time-control experiments (F(1,26) = 4.63, p = 0.041, two-way ANOVA; Fig. 8D). The time-control experiments used sham interventions with aCSF instead of switches between etomidate concentrations.
The effects of etomidate at the ventrobasal complex largely persist during blockade of GABA re-uptake
Since etomidate acts as a positive allosteric modulator of GABAARs, its ability to potentiate the activity of these receptors requires GABA (Forman, 2011). Given the possible decrease in endogenous extracellular GABA levels that could occur with reverse microdialysis, the actions of etomidate on extrasynaptic GABAARs could be reduced by the intervention. Thus, we conducted additional experiments in wild-type mice where etomidate was co-applied with the GAT-1 and -3 inhibitors NO-711 (100 μm) and SNAP-5114 (300 μm).
As shown in Figure 9, the effects of etomidate on electrocortical activity largely persisted in mice that received NO-711 and SNAP-5114 in addition to etomidate (Fig. 9A–D). Consistent with previous findings (Fig. 5), we identified an effect of etomidate on 1–4 Hz power during waking, NREM sleep (both F(2,26) > 4.01, p < 0.031, two-way RM ANOVA), and REM sleep (F(2,23) = 9.42, p = 0.001; Fig. 9A). This effect of etomidate on 1–4 Hz EEG power was not altered by the inclusion of NO-711 and SNAP-5114 to the perfusion media (each F < 2.69, p > 0.089). Post hoc analyses confirmed that microperfusion of 30 μm etomidate into the ventrobasal complex decreased 1–4 Hz power during all sleep–wake states (each p ≤ 0.029, versus aCSF, post hoc paired t test). Likewise, 10 μm etomidate decreased 1–4 Hz EEG in NREM and REM sleep (both p ≤ 0.005, versus aCSF). The effects of etomidate on 8–12 Hz power during NREM and REM sleep and on 12–30 Hz power during waking were similarly not altered by blockade of GABA re-uptake (each p > 0.498; Fig. 9B). Of all of the comparisons the only difference observed between groups receiving etomidate with and without the co-application of the GABA transporter inhibitors was a reduction in the etomidate-induced increase in 12–30 Hz power in NREM sleep (F(2,26) = 4.70, p = 0.018; Fig. 9B). There were no significant effects of NO-711 and SNAP-5114 on the etomidate-induced increase in sigma power, and spindle-like oscillation incidence and duration (all F(2,26) < 3.00, p > 0.068; Fig. 9C). Finally, while the effects of etomidate on sleep–wake structure were independent of NO-711 and SNAP-5114 (all F(2,26) < 1.16, p > 0.290), the significant increase in REM sleep observed with etomidate alone was no longer identified (Figs. 8D, 9D). There was no independent effect of NO-711 and SNAP-5114 identified in any of the comparisons of sleep–wake structure (all F(1,13) < 3.15, p ≥ 0.100).
Figure 9.
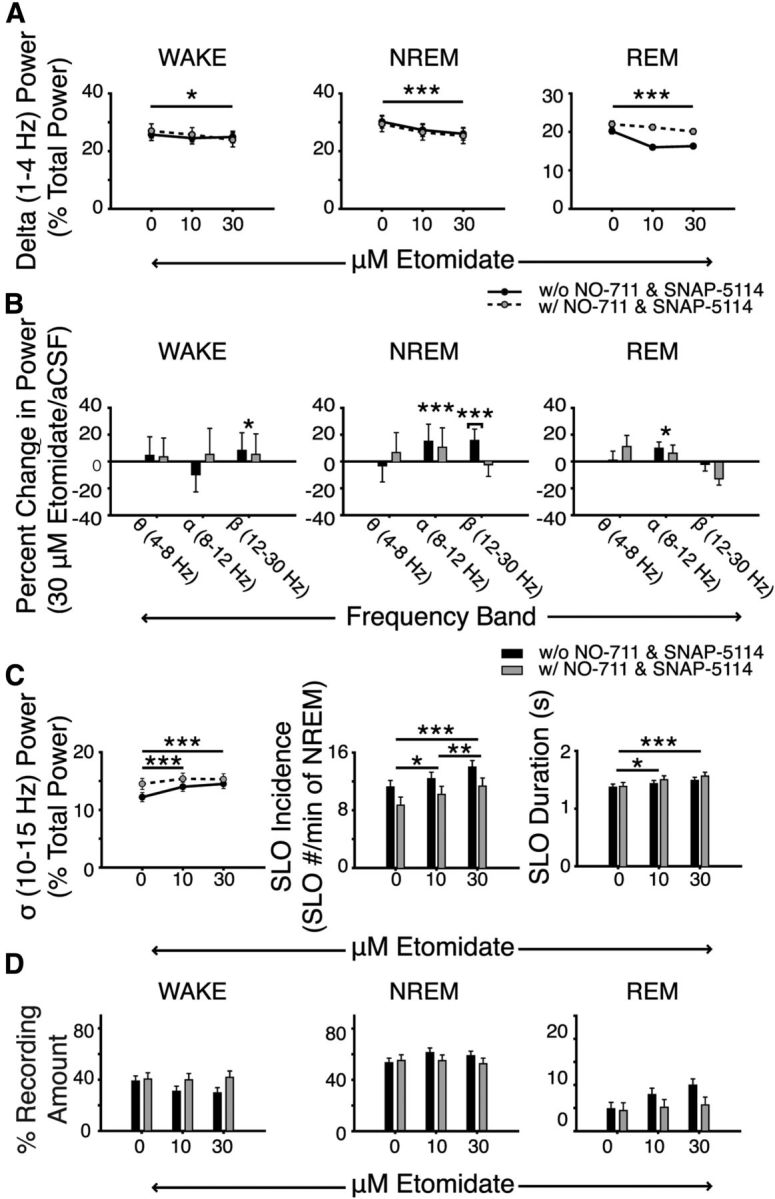
The effects of etomidate on electrocortical activity persist with increased GABA concentrations in the ventrobasal complex. A, Microperfusion of 30 μm etomidate into the ventrobasal complex decreased 1–4 Hz EEG power during all sleep–wake states in mice receiving etomidate alone or co-application of the GABA-re-uptake inhibitors NO-711 and SNAP-5114. B, Additional changes in electrocortical activity in different frequency bands with etomidate in the absence and presence of the GABA re-uptake inhibitors. Plots illustrate the percentage change in theta (4–8 Hz), alpha (8–12 Hz), and beta (12–30 Hz) power with 30 μm etomidate relative to aCSF. With the exception of beta power during NREM sleep, note that the effects of etomidate on electrocortical activity persisted in mice that also received GABA re-uptake inhibitors into the ventrobasal complex. C, Etomidate at the ventrobasal complex increased the incidence and duration of spindle-like oscillations. Again, note the absence of differences between mice receiving etomidate with or without the GABA re-uptake inhibitors. D, The amount of time spent in each sleep–wake state was also unaffected by etomidate and/or inhibition of GABA re-uptake. Two-way RM ANOVA; *p < 0.05, **p < 0.01, ***p < 0.001.
Discussion
Here we show that thalamic δGABAAR activation in vivo—using localized microperfusion of THIP into the ventrobasal complex of freely behaving mice—promotes electrocortical signatures commonly associated with the “deep” stages of NREM sleep. These include an increase in 1–4 Hz EEG activity and a decrease in spindle-like oscillations, with these effects observed in wild-type but not Gabrd−/− mice. These findings are consistent with the sedating property of THIP and its effects on electrocortical activity when administered systemically in humans and rodents (Faulhaber et al., 1997; Vyazovskiy et al., 2005; Cremers and Ebert, 2007). Importantly, we also show that etomidate at the thalamus does not recapitulate the electrocortical effects of THIP, with etomidate eliciting changes in electrocortical activity that were largely independent of δGABAAR expression. Moreover, the changes in electrocortical activity that were identified with etomidate are consistent with the global changes in electrocortical activity that are reported during induction of anesthesia with etomidate in humans (Kuizenga et al., 2001). Collectively, these findings implicate thalamic δGABAARs in mediating the electrocortical markers of deep NREM sleep and suggest a role for non-δGABAARs in the thalamus in mediating the changes in electrocortical activity during induction of anesthesia with etomidate.
Thalamic δGABAAR activity, sedation, and sleep
The effects of THIP at the thalamus on cortical 1–4 Hz signaling require δGABAAR expression, suggesting they are mediated by enhanced δGABAAR-mediated tonic inhibition (Cope et al., 2005). Increasing tonic inhibition would effectively hyperpolarize the resting membrane potential of thalamocortical neurons to levels that enable burst firing and, ultimately, promote 1–4 Hz cortical activity (McCormick and Bal, 1997). This interpretation is further supported by the decrease in sigma power and spindle-like oscillations that were also identified with THIP at the thalamus of wild-type mice. Together, our findings support the general scheme whereby enhanced thalamic δGABAAR-mediated tonic inhibition hyperpolarizes the resting membrane potential of thalamocortical neurons to levels that support 1–4 Hz oscillations at the expense of sleep spindles (Nuñez et al., 1992).
Enhanced thalamic δGABAAR activity was also associated with increased “speed” of stable transitions into the spectral space occupied by NREM sleep. While transitions into NREM sleep occurred more rapidly in the spectral domain, there were no identifiable effects of THIP on the amount of NREM sleep per se, as can occur in some species (Schultz et al., 1981; Madsen et al., 1983). Although systemic administration of THIP in mice has no effect on the amount of NREM sleep (Vyazovskiy et al., 2005; Winsky-Sommerer et al., 2007), it does produce a generalized increase in 1–4 Hz electrocortical power, as observed in our study, consistent with its sedating action. The results of our study identify the thalamus as a potential key site of action for the sedating property of THIP.
Some baseline differences in electrocortical activity were identified in our comparisons of wild-type and Gabrd−/− mice before drug interventions. The Gabrd−/− mice exhibit higher 1–4 Hz power and lower 10–15 Hz power during NREM sleep. This difference would be consistent with more hyperpolarized resting membrane potentials in thalamocortical neurons of Gabrd−/− mice relative to wild-types. Such genotypic differences could be attributed to compensatory changes in the expression of GABAAR subpopulations and/or other channels/receptors, such as the TWIK-related, acid-sensitive K+ channels that can also hyperpolarize the resting membrane potential of thalamocortical neurons (Brickley et al., 2001; Peng et al., 2002; Meuth et al., 2006).
Microperfusion of 50 μm THIP into the ventrobasal complex increased 12–30 Hz power in Gabrd−/− mice, indicating that THIP had some non-δGABAAR-mediated effects, potentially via effects on synaptic GABAARs (Brown et al., 2002; Stórustovu and Ebert, 2003). Importantly, the effective delivered concentrations of THIP used in this study (see Materials and Methods) were selected based on previous reports showing that THIP, at those concentrations, has minimal effects on synaptic GABAARs (Brown et al., 2002; Stórustovu and Ebert, 2003; Belelli et al., 2005; Jia et al., 2005) and promotes sleep and sedation in humans (Madsen et al., 1983; Faulhaber et al., 1997). Nonetheless, it is possible that THIP also had non-δGABAAR-mediated effects that contributed to the changes identified in the wild-type mice. This interpretation, however, is not readily supported by our findings since all of the identified effects of THIP in the wild-type mice were absent in the Gabrd−/− mice. If actions on non-δGABAARs played a significant role in mediating the effects of THIP in the wild-type mice, we would expect to see similar, albeit attenuated, effects in the Gabrd−/− mice. Given the absence of such similarities between genotypes, our findings suggest that the identified effects of THIP in the wild-type mice require δGABAARs.
In contrast to the in vitro studies that identified the effects of acute administration of THIP/etomidate on GABAAR subpopulation activities (Brown et al., 2002; Stórustovu and Ebert, 2003; Belelli et al., 2005; Cope et al., 2005; Drasbek and Jensen, 2006), the experiments reported here used a longer period of drug exposure. Such prolonged exposure to THIP and/or etomidate may have elicited changes in receptor expression and/or sensitization not identified with acute application. Nonetheless, the longer duration of exposure to THIP and etomidate used in this study is of particular relevance given the use of these agents in sedation and anesthesia.
Etomidate at the thalamus and electrocortical signatures of anesthetic induction
Unlike with THIP, all of the effects that were identified with etomidate presented in both the wild-type and Gabrd−/− mice, indicating that these effects do not require δGABAARs. Some of the effects of etomidate were also in the direction opposite to that elicited by THIP, further identifying a different mechanism of action. Etomidate at the thalamus elicited reductions in 1–4 Hz power and increases in alpha and/or beta power in wild-type and Gabrd−/− mice across all sleep–wake states. The effective concentrations of etomidate used in this study (see Materials and Methods) were again selected based on previous in vitro studies that identified a δGABAAR-potentiating effects of etomidate in thalamocortical neurons at similar concentrations (Belelli et al., 2005). Importantly, an effect of etomidate on synaptic GABAARs was also identified at these concentrations.
The effects of etomidate at the thalamus on cortical alpha and beta power are consistent with studies modeling the effects of the intravenous general anesthetics etomidate and propofol on electrocortical activity (Talavera et al., 2009; Ching et al., 2010; Boly et al., 2012). Ching et al. (2010) further associated these cortical effects with increased thalamic GABAAR conductance and IPSP duration. Consistent with the modeling effects of etomidate and propofol on thalamic phasic inhibition, in vitro studies show that etomidate prolongs the decay of miniature IPSCs in neurons of the ventrobasal complex and reticular thalamic nucleus (RTN; Belelli et al., 2005). Enhanced recruitment of thalamocortical neurons through lateral connectivity between RTN neurons with etomidate could further precipitate widespread tuning of thalamocortical firing to RTN firing rates, promoting cortical alpha oscillations and facilitating the incidence and propagation of spindle-like oscillations (Suffczynski et al., 2001; Steriade, 2005). It should also be noted that while the probe tips targeted the ventrobasal complex, diffusion of etomidate to the RTN and other neighboring thalamic nuclei is likely. Thus, the effects of etomidate reported here likely result from its actions on neurons located in the ventrobasal complex and other thalamic nuclei including the RTN.
The reduction in 1–4 Hz power, increase in spindle-like oscillations, and increase in REM sleep expression with etomidate at the thalamus of both wild-type and Gabrd−/− mice all suggest that etomidate supports a pattern of electrocortical activity that is otherwise typically recognized as “light” sleep, but through largely δGABAAR-independent mechanisms. The types of sleep that etomidate at the thalamus appears to promote are often associated with dream-like and hypnogogic mentation in humans (Rowley et al., 1998; Fosse et al., 2001). Importantly, such dream-like awareness is also frequently associated with induction of anesthesia (Brown et al., 2010).
The thalamus, sleep, and anesthesia
The extrasynaptic GABAAR-potentiating actions of etomidate within the thalamus have been suspected of mediating its influence on consciousness (Meera et al., 2009; Kretschmannova et al., 2013). However, etomidate has pronounced effects on both phasic and tonic inhibition given its primary molecular targets, the β2 and β3 GABAAR subunits, have synaptic and extrasynaptic localization (Uchida et al., 1995; Belelli et al., 1997; Hill-Venning et al., 1997). Unlike etomidate, THIP—at concentrations similar to the effective concentrations used in this study—has no effect on synaptic inhibition in the ventrobasal complex or RTN in vitro (Belelli et al., 2005). Thus, given the absence of δGABAARs in the RTN (Pirker et al., 2000), THIP appears to have minimal, if any, effect on RTN neurons at clinically relevant concentrations. Different influences on phasic inhibition in the thalamus and RTN could explain the differing effects of THIP and etomidate identified here.
Importantly, etomidate also promotes spill-over inhibition in addition to phasic and tonic inhibition (Herd et al., 2013, 2014). This form of inhibition is characterized by the recruitment of extrasynaptic and perisynaptic GABAARs by synaptically released GABA, which ultimately prolongs evoked IPSCs. The effect of etomidate on spill-over inhibition, however, requires both synaptic and extrasynaptic GABAARs (Herd et al., 2014). Our study indicates that thalamic δGABAAR-mediated tonic and spill-over inhibition are not required to elicit etomidate-induced electrocortical changes, given the lack of effect of genotype. Additionally, we did not identify any major effect of increased extracellular GABA levels on the effects elicited by etomidate. This finding indicates that the δGABAAR-independent effects of etomidate on electrocortical activity largely persist under conditions that are favorable to the potentiation of extrasynaptic GABAARs. We did, however, identify an effect of NO-711 and SNAP-5114 on the etomidate-induced increase in 12–30 Hz signaling, but only during NREM sleep. Our results suggest that THIP and etomidate at the thalamus promote different effects on the thalamo-cortico-thalamic oscillatory feedback loop. However, both increased delta power and alpha/beta power are associated with an increased coupling between the thalamus and the cortex (Lopes da Silva et al., 1980; Steriade et al., 1993). Such an increase in cortico-thalamic connectivity would occur at the expense of cortical connectivity with other brain regions. Moreover, increasing inhibitory signaling in thalamic neurons—as would be elicited by THIP and etomidate—would impact the ability of these neurons to relay sensory input to the cortex. Thus, it is likely that both THIP and etomidate at the thalamus impair cortical processing of sensory information. Future studies investigating the effects of sedative and anesthetic agents at the thalamus on attention and arousal will confirm or refute this notion.
The differing effects of THIP and etomidate at the thalamus have important implications in identifying the mechanisms that distinguish anesthesia from sleep. Our findings implicate, albeit indirectly, enhanced thalamic phasic inhibition in mediating the electrocortical signatures of anesthetic induction with etomidate (Kuizenga et al., 2001). Conversely, enhanced thalamic tonic inhibition promotes signatures consistent with deep NREM sleep, the only naturally occurring brain state in which healthy human subjects have reported having minimal mentation (Hobson et al., 2000; Stickgold et al., 2001; Hobson and Pace-Schott, 2002). Further in vivo studies that assess the contribution of phasic and tonic inhibition in the thalamus during sleep and systemic drug-induced sedation and anesthesia will serve to confirm the role of these pathways in conscious awareness.
Footnotes
This work was supported by funds from the Canadian Institutes of Health Research (CIHR; Grant MT-15563 to R.L.H.). R.L.H. is supported by a Tier I Canada Research Chair in Sleep and Respiratory Neurobiology. L.M.O. was supported by Sleep and Biological Rhythms Toronto, a CIHR funded research and training program.
The authors declare no competing financial interests.
References
- Astori S, Wimmer RD, Lüthi A. Manipulating sleep spindles - expanding views on sleep, memory, and disease. Trends Neurosci. 2013;36:738–748. doi: 10.1016/j.tins.2013.10.001. [DOI] [PubMed] [Google Scholar]
- Beenhakker MP, Huguenard JR. Astrocytes as gatekeepers of GABAB receptor function. J Neurosci. 2010;30:15262–15276. doi: 10.1523/JNEUROSCI.3243-10.2010. [DOI] [PMC free article] [PubMed] [Google Scholar]
- Belelli D, Lambert JJ, Peters JA, Wafford K, Whiting PJ. The interaction of the general anesthetic etomidate with the gamma-aminobutyric acid type A receptor is influenced by a single amino acid. Proc Natl Acad Sci U S A. 1997;94:11031–11036. doi: 10.1073/pnas.94.20.11031. [DOI] [PMC free article] [PubMed] [Google Scholar]
- Belelli D, Peden DR, Rosahl TW, Wafford KA, Lambert JJ. Extrasynaptic GABAA receptors of thalamocortical neurons: a molecular target for hypnotics. J Neurosci. 2005;25:11513–11520. doi: 10.1523/JNEUROSCI.2679-05.2005. [DOI] [PMC free article] [PubMed] [Google Scholar]
- Benkwitz C, Liao M, Laster MJ, Sonner JM, Eger EI, 2nd, Pearce RA. Determination of the EC50 amnesic concentration of etomidate and its diffusion profile in brain tissue: implications for in vitro studies. Anesthesiology. 2007;106:114–123. doi: 10.1097/00000542-200701000-00020. [DOI] [PubMed] [Google Scholar]
- Boly M, Moran R, Murphy M, Boveroux P, Bruno MA, Noirhomme Q, Ledoux D, Bonhomme V, Brichant JF, Tononi G, Laureys S, Friston K. Connectivity changes underlying spectral EEG changes during propofol-induced loss of consciousness. J Neurosci. 2012;32:7082–7090. doi: 10.1523/JNEUROSCI.3769-11.2012. [DOI] [PMC free article] [PubMed] [Google Scholar]
- Brickley SG, Revilla V, Cull-Candy SG, Wisden W, Farrant M. Adaptive regulation of neuronal excitability by a voltage-independent potassium conductance. Nature. 2001;409:88–92. doi: 10.1038/35051086. [DOI] [PubMed] [Google Scholar]
- Brown EN, Lydic R, Schiff ND. General anesthesia, sleep, and coma. N Engl J Med. 2010;363:2638–2650. doi: 10.1056/NEJMra0808281. [DOI] [PMC free article] [PubMed] [Google Scholar]
- Brown N, Kerby J, Bonnert TP, Whiting PJ, Wafford KA. Pharmacological characterization of a novel cell line expressing human alpha(4)beta(3)delta GABA(A) receptors. Br J Pharmacol. 2002;136:965–974. doi: 10.1038/sj.bjp.0704795. [DOI] [PMC free article] [PubMed] [Google Scholar]
- Ching S, Cimenser A, Purdon PL, Brown EN, Kopell NJ. Thalamocortical model for a propofol-induced alpha-rhythm associated with loss of consciousness. Proc Natl Acad Sci U S A. 2010;107:22665–22670. doi: 10.1073/pnas.1017069108. [DOI] [PMC free article] [PubMed] [Google Scholar]
- Cope DW, Hughes SW, Crunelli V. GABAA receptor-mediated tonic inhibition in thalamic neurons. J Neurosci. 2005;25:11553–11563. doi: 10.1523/JNEUROSCI.3362-05.2005. [DOI] [PMC free article] [PubMed] [Google Scholar]
- Cope DW, Di Giovanni G, Fyson SJ, Orbán G, Errington AC, Lorincz ML, Gould TM, Carter DA, Crunelli V. Enhanced tonic GABAA inhibition in typical absence epilepsy. Nat Med. 2009;15:1392–1398. doi: 10.1038/nm.2058. [DOI] [PMC free article] [PubMed] [Google Scholar]
- Costa-Miserachs D, Portell-Cortés I, Torras-Garcia M, Morgado-Bernal I. Automated sleep staging in rat with a standard spreadsheet. J Neurosci Methods. 2003;130:93–101. doi: 10.1016/S0165-0270(03)00229-2. [DOI] [PubMed] [Google Scholar]
- Cremers T, Ebert B. Plasma and CNS concentrations of Gaboxadol in rats following subcutaneous administration. Eur J Pharmacol. 2007;562:47–52. doi: 10.1016/j.ejphar.2007.01.017. [DOI] [PubMed] [Google Scholar]
- De Biasi S, Vitellaro-Zuccarello L, Brecha NC. Immunoreactivity for the GABA transporter-1 and GABA transporter-3 is restricted to astrocytes in the rat thalamus. A light and electron-microscopic immunolocalization. Neuroscience. 1998;83:815–828. doi: 10.1016/S0306-4522(97)00414-4. [DOI] [PubMed] [Google Scholar]
- De Paepe P, Belpaire FM, Van Hoey G, Boon PA, Buylaert WA. Influence of hypovolemia on the pharmacokinetics and the electroencephalographic effect of etomidate in the rat. J Pharmacol Exp Ther. 1999;290:1048–1053. [PubMed] [Google Scholar]
- Diniz Behn CG, Klerman EB, Mochizuki T, Lin SC, Scammell TE. Abnormal sleep/wake dynamics in orexin knockout mice. Sleep. 2010;33:297–306. doi: 10.1093/sleep/33.3.297. [DOI] [PMC free article] [PubMed] [Google Scholar]
- Drasbek KR, Jensen K. THIP, a hypnotic and antinociceptive drug, enhances an extrasynaptic GABAA receptor-mediated conductance in mouse neocortex. Cereb Cortex. 2006;16:1134–1141. doi: 10.1093/cercor/bhj055. [DOI] [PubMed] [Google Scholar]
- Farrant M, Nusser Z. Variations on an inhibitory theme: phasic and tonic activation of GABA(A) receptors. Nat Rev Neurosci. 2005;6:215–229. doi: 10.1038/nrn1625. [DOI] [PubMed] [Google Scholar]
- Faulhaber J, Steiger A, Lancel M. The GABAA agonist THIP produces slow wave sleep and reduces spindling activity in NREM sleep in humans. Psychopharmacology. 1997;130:285–291. doi: 10.1007/s002130050241. [DOI] [PubMed] [Google Scholar]
- Forman SA. Clinical and molecular pharmacology of etomidate. Anesthesiology. 2011;114:695–707. doi: 10.1097/ALN.0b013e3181ff72b5. [DOI] [PMC free article] [PubMed] [Google Scholar]
- Fosse R, Stickgold R, Hobson JA. Brain-mind states: reciprocal variation in thoughts and hallucinations. Psychol Sci. 2001;12:30–36. doi: 10.1111/1467-9280.00306. [DOI] [PubMed] [Google Scholar]
- Franklin K, Paxinos G. The mouse brain in stereotaxic coordinates with CDROM. New York: Academic; 2007. [Google Scholar]
- Franks NP. General anaesthesia: from molecular targets to neuronal pathways of sleep and arousal. Nat Rev Neurosci. 2008;9:370–386. doi: 10.1038/nrn2372. [DOI] [PubMed] [Google Scholar]
- Gervasoni D, Lin SC, Ribeiro S, Soares ES, Pantoja J, Nicolelis MA. Global forebrain dynamics predict rat behavioral states and their transitions. J Neurosci. 2004;24:11137–11147. doi: 10.1523/JNEUROSCI.3524-04.2004. [DOI] [PMC free article] [PubMed] [Google Scholar]
- Grace KP, Hughes SW, Horner RL. Identification of a pharmacological target for genioglossus reactivation throughout sleep. Sleep. 2014;37:41–50. doi: 10.5665/sleep.3304. [DOI] [PMC free article] [PubMed] [Google Scholar]
- Herd MB, Brown AR, Lambert JJ, Belelli D. Extrasynaptic GABA(A) receptors couple presynaptic activity to postsynaptic inhibition in the somatosensory thalamus. J Neurosci. 2013;33:14850–14868. doi: 10.1523/JNEUROSCI.1174-13.2013. [DOI] [PMC free article] [PubMed] [Google Scholar]
- Herd MB, Lambert JJ, Belelli D. The general anaesthetic etomidate inhibits the excitability of mouse thalamocortical relay neurons by modulating multiple modes of GABA receptor-mediated inhibition. Eur J Neurosci. 2014;40:2487–2501. doi: 10.1111/ejn.12601. [DOI] [PMC free article] [PubMed] [Google Scholar]
- Hill-Venning C, Belelli D, Peters JA, Lambert JJ. Subunit-dependent interaction of the general anaesthetic etomidate with the gamma-aminobutyric acid type A receptor. Br J Pharmacol. 1997;120:749–756. doi: 10.1038/sj.bjp.0700927. [DOI] [PMC free article] [PubMed] [Google Scholar]
- Hirsch JC, Fourment A, Marc ME. Sleep-related variations of membrane potential in the lateral geniculate body relay neurons of the cat. Brain Res. 1983;259:308–312. doi: 10.1016/0006-8993(83)91264-7. [DOI] [PubMed] [Google Scholar]
- Hobson JA, Pace-Schott EF. The cognitive neuroscience of sleep: neuronal systems, consciousness and learning. Nat Rev Neurosci. 2002;3:679–693. doi: 10.1038/nrn915. [DOI] [PubMed] [Google Scholar]
- Hobson JA, Pace-Schott EF, Stickgold R. Dreaming and the brain: toward a cognitive neuroscience of conscious states. Behav Brain Sci. 2000;23:793–842. doi: 10.1017/s0140525x00003976. 2000; discussion 904–1121. [DOI] [PubMed] [Google Scholar]
- Jia F, Pignataro L, Schofield CM, Yue M, Harrison NL, Goldstein PA. An extrasynaptic GABAA receptor mediates tonic inhibition in thalamic VB neurons. J Neurophysiol. 2005;94:4491–4501. doi: 10.1152/jn.00421.2005. [DOI] [PubMed] [Google Scholar]
- Kersanté F, Rowley SC, Pavlov I, Gutièrrez-Mecinas M, Semyanov A, Reul JM, Walker MC, Linthorst AC. A functional role for both -aminobutyric acid (GABA) transporter-1 and GABA transporter-3 in the modulation of extracellular GABA and GABAergic tonic conductances in the rat hippocampus. J Physiol. 2013;591:2429–2441. doi: 10.1113/jphysiol.2012.246298. [DOI] [PMC free article] [PubMed] [Google Scholar]
- Kretschmannova K, Hines RM, Revilla-Sanchez R, Terunuma M, Tretter V, Jurd R, Kelz MB, Moss SJ, Davies PA. Enhanced tonic inhibition influences the hypnotic and amnestic actions of the intravenous anesthetics etomidate and propofol. J Neurosci. 2013;33:7264–7273. doi: 10.1523/JNEUROSCI.5475-12.2013. [DOI] [PMC free article] [PubMed] [Google Scholar]
- Kuizenga K, Wierda JM, Kalkman CJ. Biphasic EEG changes in relation to loss of consciousness during induction with thiopental, propofol, etomidate, midazolam or sevoflurane. Br J Anaesth. 2001;86:354–360. doi: 10.1093/bja/86.3.354. [DOI] [PubMed] [Google Scholar]
- Lopes da Silva F. Neural mechanisms underlying brain waves: from neural membranes to networks. Electroencephalogr Clin Neurophysiol. 1991;79:81–93. doi: 10.1016/0013-4694(91)90044-5. [DOI] [PubMed] [Google Scholar]
- Lopes da Silva FH, Vos JE, Mooibroek J, Van Rotterdam A. Relative contributions of intracortical and thalamo-cortical processes in the generation of alpha rhythms, revealed by partial coherence analysis. Electroencephalogr Clin Neurophysiol. 1980;50:449–456. doi: 10.1016/0013-4694(80)90011-5. [DOI] [PubMed] [Google Scholar]
- Madsen SM, Lindeburg T, Folsgard S, Jacobsen E, Sillesen H. Pharmacokinetics of the gamma-aminobutyric acid agonist THIP (Gaboxadol) following intramuscular administration to man, with observations in dog. Acta Pharmacol Toxicol. 1983;53:353–357. doi: 10.1111/j.1600-0773.1983.tb03434.x. [DOI] [PubMed] [Google Scholar]
- Maguire JL, Stell BM, Rafizadeh M, Mody I. Ovarian cycle-linked changes in GABA(A) receptors mediating tonic inhibition alter seizure susceptibility and anxiety. Nat Neurosci. 2005;8:797–804. doi: 10.1038/nn1469. [DOI] [PubMed] [Google Scholar]
- McCormick DA, Bal T. Sleep and arousal: thalamocortical mechanisms. Annu Rev Neurosci. 1997;20:185–215. doi: 10.1146/annurev.neuro.20.1.185. [DOI] [PubMed] [Google Scholar]
- Meera P, Olsen RW, Otis TS, Wallner M. Etomidate, propofol and the neurosteroid THDOC increase the GABA efficacy of recombinant alpha4beta3delta and alpha4beta3 GABA A receptors expressed in HEK cells. Neuropharmacology. 2009;56:155–160. doi: 10.1016/j.neuropharm.2008.08.011. [DOI] [PMC free article] [PubMed] [Google Scholar]
- Meera P, Wallner M, Otis TS. Molecular basis for the high THIP/gaboxadol sensitivity of extrasynaptic GABA(A) receptors. J Neurophysiol. 2011;106:2057–2064. doi: 10.1152/jn.00450.2011. [DOI] [PMC free article] [PubMed] [Google Scholar]
- Meuth SG, Aller MI, Munsch T, Schuhmacher T, Seidenbecher T, Meuth P, Kleinschnitz C, Pape HC, Wiendl H, Wisden W, Budde T. The contribution of TWIK-related acid-sensitive K+-containing channels to the function of dorsal lateral geniculate thalamocortical relay neurons. Mol Pharmacol. 2006;69:1468–1476. doi: 10.1124/mol.105.020594. [DOI] [PubMed] [Google Scholar]
- Mihalek RM, Banerjee PK, Korpi ER, Quinlan JJ, Firestone LL, Mi ZP, Lagenaur C, Tretter V, Sieghart W, Anagnostaras SG, Sage JR, Fanselow MS, Guidotti A, Spigelman I, Li Z, DeLorey TM, Olsen RW, Homanics GE. Attenuated sensitivity to neuroactive steroids in gamma-aminobutyrate type A receptor delta subunit knockout mice. Proc Natl Acad Sci U S A. 1999;96:12905–12910. doi: 10.1073/pnas.96.22.12905. [DOI] [PMC free article] [PubMed] [Google Scholar]
- Nuñez A, Curró Dossi R, Contreras D, Steriade M. Intracellular evidence for incompatibility between spindle and delta oscillations in thalamocortical neurons of cat. Neuroscience. 1992;48:75–85. doi: 10.1016/0306-4522(92)90339-4. [DOI] [PubMed] [Google Scholar]
- Peng Z, Hauer B, Mihalek RM, Homanics GE, Sieghart W, Olsen RW, Houser CR. GABA(A) receptor changes in delta subunit-deficient mice: altered expression of alpha4 and gamma2 subunits in the forebrain. J Comp Neurol. 2002;446:179–197. doi: 10.1002/cne.10210. [DOI] [PubMed] [Google Scholar]
- Pirker S, Schwarzer C, Wieselthaler A, Sieghart W, Sperk G. GABA(A) receptors: immunocytochemical distribution of 13 subunits in the adult rat brain. Neuroscience. 2000;101:815–850. doi: 10.1016/S0306-4522(00)00442-5. [DOI] [PubMed] [Google Scholar]
- Portas CM, Thakkar M, Rainnie D, McCarley RW. Microdialysis perfusion of 8-hydroxy-2-(di-n-propylamino)tetralin (8-OH-DPAT) in the dorsal raphe nucleus decreases serotonin release and increases rapid eye movement sleep in the freely moving cat. J Neurosci. 1996;16:2820–2828. doi: 10.1523/JNEUROSCI.16-08-02820.1996. [DOI] [PMC free article] [PubMed] [Google Scholar]
- Rowley JT, Stickgold R, Hobson JA. Eyelid movements and mental activity at sleep onset. Conscious Cogn. 1998;7:67–84. doi: 10.1006/ccog.1998.0333. [DOI] [PubMed] [Google Scholar]
- Saper CB, Chou TC, Scammell TE. The sleep switch: hypothalamic control of sleep and wakefulness. Trends Neurosci. 2001;24:726–731. doi: 10.1016/S0166-2236(00)02002-6. [DOI] [PubMed] [Google Scholar]
- Schultz B, Aaes-Jorgensen T, Bogeso KP, Jorgensen A. Preliminary studies on the absorption, distribution, metabolism, and excretion of THIP in animal and man using 14C-labelled compound. Acta Pharmacol Toxicol. 1981;49:116–124. doi: 10.1111/j.1600-0773.1981.tb00879.x. [DOI] [PubMed] [Google Scholar]
- Smith CG, Bowery NG, Whitehead KJ. GABA transporter type 1 (GAT-1) uptake inhibition reduces stimulated aspartate and glutamate release in the dorsal spinal cord in vivo via different GABAergic mechanisms. Neuropharmacology. 2007;53:975–981. doi: 10.1016/j.neuropharm.2007.09.008. [DOI] [PubMed] [Google Scholar]
- Steriade M. Central core modulation of spontaneous oscillations and sensory transmission in thalamocortical systems. Curr Opin Neurobiol. 1993;3:619–625. doi: 10.1016/0959-4388(93)90064-6. [DOI] [PubMed] [Google Scholar]
- Steriade M. Sleep, epilepsy and thalamic reticular inhibitory neurons. Trends Neurosci. 2005;28:317–324. doi: 10.1016/j.tins.2005.03.007. [DOI] [PubMed] [Google Scholar]
- Steriade M, Dossi RC, Nuñez A. Network modulation of a slow intrinsic oscillation of cat thalamocortical neurons implicated in sleep delta waves: cortically induced synchronization and brainstem cholinergic suppression. J Neurosci. 1991;11:3200–3217. doi: 10.1523/JNEUROSCI.11-10-03200.1991. [DOI] [PMC free article] [PubMed] [Google Scholar]
- Steriade M, McCormick DA, Sejnowski TJ. Thalamocortical oscillations in the sleeping and aroused brain. Science. 1993;262:679–685. doi: 10.1126/science.8235588. [DOI] [PubMed] [Google Scholar]
- Stickgold R, Malia A, Fosse R, Propper R, Hobson JA. Brain-mind states: I. Longitudinal field study of sleep/wake factors influencing mentation report length. Sleep. 2001;24:171–179. doi: 10.1093/sleep/24.2.171. [DOI] [PubMed] [Google Scholar]
- Stórustovu S, Ebert B. Gaboxadol: in vitro interaction studies with benzodiazepines and ethanol suggest functional selectivity. Eur J Pharmacol. 2003;467:49–56. doi: 10.1016/S0014-2999(03)01603-0. [DOI] [PubMed] [Google Scholar]
- Suffczynski P, Kalitzin S, Pfurtscheller G, Lopes da Silva FH. Computational model of thalamo-cortical networks: dynamical control of alpha rhythms in relation to focal attention. Int J Psychophysiol. 2001;43:25–40. doi: 10.1016/S0167-8760(01)00177-5. [DOI] [PubMed] [Google Scholar]
- Talavera JA, Esser SK, Amzica F, Hill S, Antognini JF. Modeling the GABAergic action of etomidate on the thalamocortical system. Anesth Analg. 2009;108:160–167. doi: 10.1213/ane.0b013e31818d40aa. [DOI] [PMC free article] [PubMed] [Google Scholar]
- Uchida I, Kamatchi G, Burt D, Yang J. Etomidate potentiation of GABAA receptor gated current depends on the subunit composition. Neurosci Lett. 1995;185:203–206. doi: 10.1016/0304-3940(95)11263-V. [DOI] [PubMed] [Google Scholar]
- Vyazovskiy VV, Kopp C, Bösch G, Tobler I. The GABAA receptor agonist THIP alters the EEG in waking and sleep of mice. Neuropharmacology. 2005;48:617–626. doi: 10.1016/j.neuropharm.2004.12.015. [DOI] [PubMed] [Google Scholar]
- Winsky-Sommerer R, Vyazovskiy VV, Homanics GE, Tobler I. The EEG effects of THIP (Gaboxadol) on sleep and waking are mediated by the GABA(A)delta-subunit-containing receptors. Eur J Neurosci. 2007;25:1893–1899. doi: 10.1111/j.1460-9568.2007.05455.x. [DOI] [PubMed] [Google Scholar]