

Abstract
Replay of neuronal activity during hippocampal sharp wave-ripples (SWRs) is essential in memory formation. To understand the mechanisms underlying the initiation of irregularly occurring SWRs and the generation of periodic ripples, we selectively manipulated different components of the CA3 network in mouse hippocampal slices. We recorded EPSCs and IPSCs to examine the buildup of neuronal activity preceding SWRs and analyzed the distribution of time intervals between subsequent SWR events. Our results suggest that SWRs are initiated through a combined refractory and stochastic mechanism. SWRs initiate when firing in a set of spontaneously active pyramidal cells triggers a gradual, exponential buildup of activity in the recurrent CA3 network. We showed that this tonic excitatory envelope drives reciprocally connected parvalbumin-positive basket cells, which start ripple-frequency spiking that is phase-locked through reciprocal inhibition. The synchronized GABAA receptor-mediated currents give rise to a major component of the ripple-frequency oscillation in the local field potential and organize the phase-locked spiking of pyramidal cells. Optogenetic stimulation of parvalbumin-positive cells evoked full SWRs and EPSC sequences in pyramidal cells. Even with excitation blocked, tonic driving of parvalbumin-positive cells evoked ripple oscillations. Conversely, optogenetic silencing of parvalbumin-positive cells interrupted the SWRs or inhibited their occurrence. Local drug applications and modeling experiments confirmed that the activity of parvalbumin-positive perisomatic inhibitory neurons is both necessary and sufficient for ripple-frequency current and rhythm generation. These interneurons are thus essential in organizing pyramidal cell activity not only during gamma oscillation, but, in a different configuration, during SWRs.
Keywords: basket cell, current generator, hippocampus, inhibition, oscillation, rhythm
Introduction
Different types of behavior are accompanied by distinct brain states, which are characterized by various EEG patterns that indicate unique underlying network dynamics. Hippocampal sharp wave-ripple complexes (SWRs) occur during behavioral immobility and non-REM sleep (Buzsáki et al., 1983; Buzsáki, 1986) and consist of an aperiodically occurring field potential transient, the sharp wave, and a superimposed fast, periodic (150–200 Hz) oscillation, the ripples. SWRs were proposed to play an important role in memory consolidation (Buzsáki, 1989). Indeed, during SWRs, information captured during previous exploratory behavior is replayed (Nádasdy et al., 1999; Foster and Wilson, 2006; Diba and Buzsáki, 2007) in a time-compressed manner, and the interaction between the hippocampus and neocortical cell assemblies results in the stabilization of memory traces (Wiltgen et al., 2004). Selective disruption of SWRs (Girardeau et al., 2009) causes memory deficits in hippocampus-dependent memory tasks.
In vivo and in vitro studies (Nádasdy et al., 1999; Csicsvari et al., 2000; Klausberger et al., 2003, 2004, 2005; Maier et al., 2003; Lasztóczi et al., 2011; Lapray et al., 2012; Hájos et al., 2013) revealed the behavior of principal cells and different subtypes of inhibitory neurons during SWRs and analyzed extracellular and intracellular currents. It was proposed that the strong recurrent collateral system of pyramidal cells (PCs) in CA3 enables this region to initiate SWRs (Buzsáki and Chrobak, 1995; Csicsvari et al., 2000), which are then transmitted to CA1 via the Schaffer collaterals (Csicsvari et al., 2000; Ellender et al., 2010). However, most of the results to date derive from the CA1 area and are descriptive, found only correlations, and did not reveal mechanisms or causal relationships. In particular, the following important questions remain open: How are the irregularly occurring SWRs initiated and shaped in the CA3 area, and what are the current- and rhythm-generating mechanisms of the periodic ripple oscillations?
To answer these questions, we developed an in vitro model system (Hájos et al., 2009) that allows rapid pharmacological interventions, local drug applications, and the parallel measurement of network and cellular activity during spontaneous SWRs in the CA3 area of the mouse hippocampus.
Materials and Methods
Animals were kept and used according to the regulations of the European Community's Council Directive of November 24, 1986 (86/609/EEC), and experimental procedures were reviewed and approved by the Animal Welfare Committee of the Institute of Experimental Medicine, Hungarian Academy of Sciences, Budapest. CD1 or C57BL/6J mice of both sexes (postnatal days 17–29) were used in most of the experiments unless specified otherwise. SWRs with similar characteristics can be recorded from both ventral and dorsal slices and also from slices prepared from older animas (we recorded from slices of up to 250-d-old animals).
Transgenic animals.
A transgenic mouse strain was used to selectively obtain recordings from perisomatic inhibitory cells. Parvalbumin-positive (PV+) cells [PV-containing basket cells (PVBCs) and axo-axonic cells] were sampled in a strain where enhanced green fluorescent protein expression was controlled by the PV promoter (Meyer et al., 2002). For optogenetic stimulation of PV+ cells, the B6;129S-Gt(ROSA)26Sortm32(CAG-COP4*H134R/EYFP)Hze/J (The Jackson Laboratory; RRID:IMSR_JAX:012569) strain was crossed with B6;129P2-Pvalbtm1(cre)Arbr/J (The Jackson Laboratory; RRID:IMSR_JAX:008069) animals to generate mice that selectively express channelrhodposin-2 (ChR2) under the PV promoter. A white light-emitting diode (3 mW) was used to illuminate (whole) slices from below. In contrast to other experiments, here we used older animals (postnatal days 60–300) because of low expression of ChR2-EYFP before this age. SWRs were spontaneously generated in these slices with similar properties as observed in young animals. In control animals, no changes were detected in response to illumination.
Transfection.
To selectively express eNpHR 3.0 PV+ cells, B6;129P2-Pvalbtm1(cre)Arbr/J (The Jackson Laboratory; RID:IMSR_JAX:008069) animals were given stereotaxic injections of pAAV-Ef1a-DIO eNpHR 3.0-EYFP (Penn Vector Core). The following coordinates were used (in mm): anteroposterior, −2.6; mediolateral, ±2.5 and ±3.1; dorsoventral, −2.1 and −2.5; 50 nl each). Two to three weeks after injection, horizontal or coronal slices were prepared as described below. A compact diode laser (640 nm; TOPTICA Photonics) was used for illumination. We quantified the accuracy of NpHR 3.0 expression in PV+ neurons and counted the number of cells expressing the two signals in the CA3 area of three animals. We found that 71.5% (198 of 277 cells) of PV cells expressed NpHR 3.0 in their membranes. We did not find NpHR 3.0-positive cells without PV immunoreactivity.
Slice preparation and recording conditions.
In all cases, the mice were decapitated under deep isoflurane anesthesia. The brain was removed and placed into an ice-cold cutting solution, which had been bubbled with 95% O2–5% CO2 (carbogen gas) for at least 30 min before use. The cutting solution contained the following (in mm): 205 sucrose, 2.5 KCl, 26 NaHCO3, 0.5 CaCl2, 5 MgCl2, 1.25 NaH2PO4, 10 glucose, saturated with 95% O2–5% CO2. Horizontal hippocampal slices of 300–600 μm thickness were cut using a Vibratome (Leica VT1000S or VT1200S). After acute slice preparation, the slices were placed into an interface-type holding chamber for recovery. This chamber contained standard ACSF at 35°C that gradually cooled down to room temperature. The ACSF had the following composition (in mm): 126 NaCl, 2.5 KCl, 26 NaHCO3, 2 CaCl2, 2 MgCl2, 1.25 NaH2PO4, 10 glucose, saturated with 95% O2–5% CO2. The composition of the modified ACSF (mACSF) used in experiment presented in Figure 2, F and G, was as follows (in mm): 126 NaCl, 3.5 KCl, 26 NaHCO3, 1.6 CaCl2, 1.2 MgCl2, 1.25 NaH2PO4, 10 glucose saturated with 95% O2–5% CO2. After incubation for at least 1.5 h, slices were transferred individually into a submerged-style recording chamber equipped with a dual superfusion system for improved metabolic supply to the slices (Hájos et al., 2009). In this design, the slices were placed on a metal mesh, and two separate fluid inlets allowed ACSF to flow both above and below the slices at a rate of 3–3.5 ml/min for each flow channel at 30–32°C (Supertech Instruments; www.super-tech.eu).
Figure 2.

SWR initiation can be explained by a combined stochastic-refractory model. A, Color-coded SWR IEI distributions from 84 slices (warm colors indicate high values). B, Three examples of SWR IEI distribution. Note that a universal gap (red arrowheads in A and B) occurs at short IEI lengths, which suggests some form of refractoriness after a SWR. C, Although the experimentally measured interevent interval distributions (blue traces) show substantial variability across our experiments (n = 84), all of these distributions can be fitted quite accurately using a simple mathematical model. The model assumes that, after a SWR event, the next SWR is initiated when a critical number of PCs fire within a fixed time window and that this critical number transiently increases after a SWR, because of a decrease in the efficacy of synaptic transmission and/or cellular excitability, and recovers exponentially with a given time constant. The fits (red curves) were obtained by assuming a PC population of 10,000 neurons, fitting a common coincidence detection window, PC activity level, and recovery time constant for all experiments, and fitting the values of the threshold level of coincident firing and its relative change after a SWR individually for each experiment. The IEI distribution predicted by this model can be calculated explicitly and is given in Materials and Methods. Only those experiments (68 of 84) with at least 100 SWR IEIs shorter than 4 s were used for this analysis. Twenty randomly selected examples are shown. D, E, Puffing 1 μm TTX (the 2 vertical pink bars) into stratum radiatum via a glass capillary (n = 21) reduced the SWR rate [E, inset; median, 0.66 Hz (first quartile, 0.56; third quartile, 0.98) and 0.53 Hz (0.43; 0.95) in control conditions and after TTX application, respectively; p < 0.001, Wilcoxon signed-rank test] and increased IEI variability (red, blue, and green horizontal bars indicate sampling period for distributions shown in E). F, G, Increasing cellular excitability by changing ACSF composition (modified ACSF, gray box; see Materials and Methods; n = 6) elevated the SWR rate [G, inset; 1.18 Hz (0.63; 1.55) in control conditions and 1.71 Hz (1.20; 1.87) after modified ACSF application; p = 0.03, Wilcoxon signed-rank test] and decreased IEI variability (red and green horizontal bars indicate sampling period for distributions shown in G). Insets in E and G show normalized changes from all experiments.
Standard patch electrodes were used in all recording configurations (i.e., in whole-cell, patch-clamp, and loose-patch recordings and for field potential recordings). Pipette resistances were 3–6 MΩ when filled either with the intracellular solution or with ACSF. ACSF-filled pipettes were used for local field potential (LFP) recordings and loose-patch recordings of firing patterns. After recording the action potentials, the pipette was withdrawn from the slice, and the same cell was repatched and filled with a new pipette containing the intracellular solution.
The composition of the intracellular pipette solution was as follows: 138 mm K-gluconate, 3 mm CsCl, 10 mm phosphocreatine, 4 mm ATP, 0.4 mm GTP, 10 mm HEPES, 0.2 mm QX-314, 3 mg/ml biocytin, adjusted to pH 7.3–7.35 using KOH (285–290 mOsm/l). Whole-cell series resistance was in the range of 5–15 MΩ. Both extracellular and whole-cell recordings were performed with a Multiclamp 700A or 700B amplifier (Molecular Devices). Voltage measurements were not corrected for the liquid junction potential. Both field and unit recordings were low-pass filtered at 3 kHz using the built-in Bessel filter of the amplifier. Data were digitized at 6 kHz with a PCI-6042E board (National Instruments) and recorded with EVAN 1.3 software (courtesy of Prof. I. Mody, University of California Los Angeles, Los Angeles, CA). All data were analyzed off-line using custom-made programs written in MATLAB 7.0.4 and Delphi 6.0 by A.I.G.
Local drug injections.
Drugs were dissolved in HEPES-based buffer (in mm; 126 NaCl, 10 glucose, 2.5 KCl, 1.25 NaH2PO4, 2 CaCl2, 2 MgCl2, 26 HEPES, pH 7.3), which contained phenol red to visualize the spread of the solution injected. Control injections were made with the solution without drugs (n = 5), and no effects were detected on the examined SWR parameters [sharp wave amplitude, p = 0.81; ripple amplitude, p = 0.63; ripple cycle count, p = 0.62; multiunit (MU) count during SWR, p = 0.42; SWR rate, p = 1; Wilcoxon signed-rank test]. The amount of drug injected was controlled by the duration of mouth-applied pressure (from 10 s to 1 min). To validate that local drug injection has no effect on global network behavior, an additional electrode (marked as a control channel in Fig. 3) was placed next to the “puffing channel” (at ∼150 μm distance). After drug injection, SWR parameters on the control channel showed no significant differences compared with the baseline period (e.g., in case of agatoxin; n = 7; sharp wave amplitude, p = 0.63; ripple amplitude, p = 0.63; ripple cycle count, p = 0.62; multiunit count during SWR, p = 0.42; SWR rate, p = 1; Wilcoxon signed-rank test).
Figure 3.
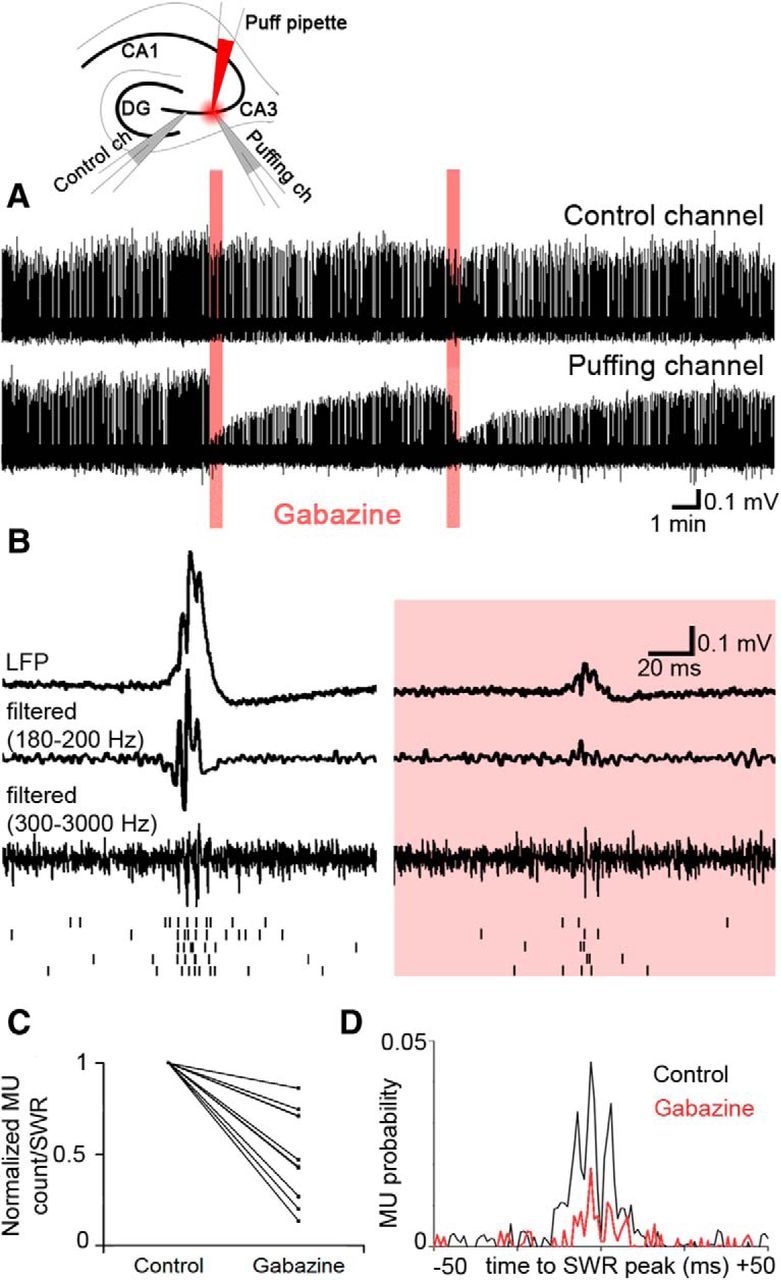
Perisomatic inhibitory currents are essential for the generation of the SWR LFP in stratum pyramidale. To examine the contribution of perisomatically evoked inhibitory currents to the SWR LFP, gabazine was locally puffed next to a recording electrode in stratum pyramidale (experimental setup is shown at the top). A, There were no changes in global network activity as measured by the nearby (∼100–150 μm) control electrode (top). On the electrode (marked “puffing channel”) located close to the gabazine puff (n = 8; 10 μm gabazine), robust changes were detected. B, Averages (n = 20) of SWR LFPs (top), traces filtered for ripple frequency (middle), and MUs (bottom) triggered by the SWR peak during baseline activity (left) and after the puff (right). At the bottom, a raster plot of spikes is shown from consecutive SWRs. C, After the gabazine puff, the amplitude of the SWR envelope [5.17 mV (4.21; 6.71) in control and 2.81 mV (2.06; 4) after the application of gabazine] and the amplitude of ripple oscillations decreased strongly (ripple negative peaks were below the detection limit after gabazine puffs). D, The ripple phase-locked MUs vanished after the gabazine puff, and their frequency also decreased [5.17 (4.21; 6.71) vs 2.81 (2.06; 4) MUs/SWR in control and after application of gabazine, respectively; p < 0.001].
To check for agatoxin effects other than blocking perisomatic inhibitory transmission, we puffed the drug onto PCs recorded in whole-cell mode, while inhibition was blocked. No change in the membrane potential was observed (n = 5; p = 0.89, Wilcoxon signed-ranked test).
Recording of field potentials, cellular firing, and drug effects.
LFP and loose-patch recordings in the one- or two-channel configuration were performed with ACSF-filled standard patch pipettes (3–6 MΩ). An additional pipette was used to inject drugs within 20 μm from one of the recording electrodes during local drug injection experiments (Figs. 2–4). MUs were detected as negative deflections larger than 3 SDs and duration of 0.05–1.5 ms in the 400 Hz high-pass-filtered signal.
Figure 4.

Perisomatic inhibition mediated by synapses using P/Q-type voltage-gated Ca2+ channels is responsible for SWR generation and MU synchronization in stratum pyramidale. Puffing ω-agatoxin, a blocker of P/Q-type voltage-gated Ca2+ channels, produced similar effects to gabazine. A, LFP recordings from the channel where toxin was locally applied (red bars indicate the period of injections). The control channel is not shown (∼100 μm distance; no changes; n = 7). B–D, Averages (n = 20) of SWRs during the baseline period (left) and after the puff (right; 1 μm ω-agatoxin). Puffing ω-agatoxin also reduced SWR amplitude [0.54 mV (0.33; 0.56) in control and 0.15 mV (0.06; 0.25) after ω-agatoxin application; p = 0.016, Wilcoxon signed-rank test], disrupted the ripple oscillation, and reduced the number [C; 7.05(6.05; 8.15) vs 4.52(1.42; 5.62) MU events/SWR in control and after the puff, respectively; p = 0.03] and phase-locking (D) of MUs similarly to gabazine. E, F, When we applied ω-conotoxin, a blocker of N-type voltage-gated Ca2+ channels (right; n = 9), there were no changes in SWR parameters [SWR amplitude, ripple amplitude, and ripple cycles; p = 0.65, 0.74, and 0.74, respectively; Wilcoxon signed-rank test], including MU rate (G) and synchrony (H).
Anatomical identification.
The recorded cells were filled with biocytin. After the recording, the slices were fixed in 4% paraformaldehyde in 0.1 m phosphate buffer (PB; pH 7.4) for at least 3 h, followed by washout with PB several times. Then, sections were blocked with normal goat serum (NGS; 10%) diluted in Tris-buffered saline, pH 7.4, followed by incubations in Alexa Fluor 488-conjugated streptavidin (1:3000; Invitrogen). Sections were then mounted on slides in Vectashield (Vector Laboratories) and were morphologically identified on the basis of their dendritic and axonal arborization. To distinguish basket cells and axo-axonic cells, slices were resliced to 40-μm-thick sections and processed for immunofluorescence double labeling. Ankyrin G immunostaining was applied together with biocytin visualization as described previously (Gulyás et al., 2010).
For camera lucida reconstruction of some representative cells after fluorescent examination, neurons were visualized using avidin-biotinylated horseradish peroxidase complex reaction (Vector Laboratories) with nickel intensified with 3–3-diaminobenzidine tetrahydrochloride (0.05% solution in Tris buffer, pH 7.4; Sigma) as a chromogen giving a dark reaction product. Then, slices were dehydrated and embedded in Drucupan (Fluka), and cells were reconstructed using a drawing tube.
Immunostaining for parvalbumin in ChR2-PV mice.
After recording, slices were immediately transferred to a fixative containing 4% paraformaldehyde (TAAB) in 0.1 m PB and fixed overnight. After fixation, slices were washed thoroughly in 0.1 m PB and resectioned to 40-μm-thick sections. After washing several times, slices were transferred to a solution containing 10% NGS and 0.5% Triton X-100 in 0.1 m PB, followed by incubation overnight in a mixture of rabbit anti-parvalbumin (1:2000, catalog #235 RRID:AB_10000343; Swant) diluted in 0.1 m PB containing 5% NGS, 5% normal horse serum, and 0.5% Triton X-100. After several washes in 0.1 m PB, the sections were treated with Cy3-conjugated donkey anti-rabbit secondary antibody (1:400, catalog #711-166-152 RRID:AB_2307437; Jackson ImmunoResearch Labs). After several washes, sections were mounted on slides in Vectashield. Maximum intensity z-projection images were taken using an A1R confocal laser-scanning microscope (Nikon Europe) using a 60× (NA 1.4) objective. We quantified the accuracy of ChR2 expression in PV+ neurons by counting the number of cells expressing the two signals in the hippocampal CA3 area of three animals. We found that 87.7% (256 of 292 cells) of PV cells expressed ChR2 in their membranes but never saw ChR2-expressing elements without PV immunoreactivity.
Drugs.
All salts and drugs were obtained from Sigma-Aldrich except gabazine, which was purchased from Tocris Bioscience, and ω-conotoxin and ω-agatoxin, which were purchased from Almone Labs.
Digital signal processing and analysis.
Signals were filtered with a two-way RC filter to reserve phase. All automatic detection steps were supervised. Spike detection in loose-patch recordings was done on 500 Hz high-pass-filtered traces using a threshold value of six times the SD of the signal. SWRs were predetected on 30 Hz low-pass-filtered field recordings using a threshold value of four times the SD of the signal. The predetected SWRs were then redetected using a program that measured various SWR features and eliminated recording artifacts similar to SWRs. Namely, on the low-pass-filtered signal, the program measured: (1) peak amplitude and peak time of sharp waves; (2) duration of the sharp wave positive phase crossing three times the SD; and (3) amplitude, time, and half-decay of the negativity after the SWRs. On a ripple bandpass-filtered trace (180–200 Hz), the program also detected (4) the time of ripple-negative peaks, and taking the absolute value of the ripple bandpassed signal and low-pass filtering, it calculated (5) the ripple power peak, time, and area. Ripple frequency was calculated by fast Fourier transformation or by calculating the characteristic ripple negativity interevent interval (IEI). We identified the ripple cycle closest to the SWR peak and used its negative peak as triggering event for averages and correlations to preserve ripple phase. Averages shown in Figures 3 and 4 were calculated from 20-20 SWRs immediately before and after puff application of drugs. For the calculation of peristimulus time histograms shown in Figure 1, the start of postsynaptic currents (PSCs) was defined as the PSC event time. Averaged ripple cycles in Figure 6E show the interaction between ripple cycle number and optical stimulation length. In the graph in Figure 6F, ripple cycle numbers were first detected in individual SWRs and then averaged to plot. Since it is easier to detect ripples on averaged traces than on individual SWRs, the number of ripple cycles is systematically higher in Figure 6E than of corresponding points of the graph in Figure 6F.
Figure 1.

A gradual buildup of activity precedes ripple-modulated neuronal firing during SWRs. A, Camera lucida reconstruction of a recorded PVBC (left) and a PC (right). str. l-m., Stratum lacunosum-moleculare; str. rad., stratum radiatum; str. pyr., stratum pyramidale; str. o., stratum oriens. B, IPSCs and EPSCs were recorded from PCs and different subsets of interneurons (n = 79) from the CA3 area during spontaneous SWR activity. Using the LFP (top trace), we automatically detected sharp wave peaks (using low-pass filtered traces; second trace), ripple negative peak times (bandpass filtered; third trace), and multiunits (high-pass filtered; fourth trace), together with IPSCs (fifth trace) or EPSCs (LFP and voltage-clamp recording from another experiment). C, We then created peristimulus time histograms of EPSCs (blue), IPSCs (red), and ripple negativities (RIPN; light gray) around SWR peaks. Note that (1) there is considerable baseline excitatory activity between SWRs (arrow), accompanied by a much smaller amount of inhibitory activity (p < 0.001); (2) both excitatory and inhibitory activity start to increase ∼55 ms before the SWR peak (gray box; significantly different from baseline at p = 0.01, assuming independent samples from a Poisson distribution) and closely follows an exponentially increasing curve until 20 ms before the SWR peak (p = 0.01); and (3) ripple modulation of activity starts when the level of excitatory (and inhibitory) activity reaches a threshold (vertical line). D, Peak-normalized peristimulus time histograms of EPSCs and IPSCs showing the buildup of activity before the SWR peak. Note that EPSCs and IPSCs get out of phase when ripple modulation starts. E, Here, we show at higher magnification the summed EPSC and IPSC number before a SWR starts. The net excitatory activity (blue) starts to deviate significantly (p = 0.01) from its baseline value [749.4; 99% confidence interval (CI): 680; 821] 55 ms before the SWR peak. F, From this point, the number of EPSCs closely follows an exponential curve staying within the corresponding 99% confidence interval until 20 ms before the SWR peak, where it becomes ripple modulated. The latter fact becomes clearly visible when the exponential curve is subtracted from the original EPSC distribution (bottom line). G, In the case of IPSCs (red), the baseline activity is lower (133.4; 99% CI: 105,164), and its starts to deviate significantly from baseline (p = 0.01) somewhat later compared with EPSCs, 52 ms before the SWR peak. Ripple modulation starts similarly 20 ms before the SWR peak (bottom).
Figure 6.

SWRs can be elicited by transient optogenetic driving of PV+ inhibitory neurons. A, Immunofluorescent staining against PV (red) in the CA3 area of animals expressing ChR2-eYFP (green) under the control of the PV promoter shows that ChR2 is localized exclusively in the plasma membranes of PV+ inhibitory neurons. str. o., Stratum oriens; str. rad., stratum radiatum; str. pyr., stratum pyramidale. B, Spontaneous and light-evoked (blue bars, stimulation periods) SWRs recorded from a slice in control conditions and with ionotropic excitatory transmission blocked (red bar). Note that spontaneous SWRs (s-SWR) disappear after the blockade of fast synaptic excitation (20 μm NBQX and 100 μm AP-5; n = 9). C, During the control period, optogenetic stimulation of the PV+ cell population evoked SWRs between s-SWRs (asterisks, left) There was no significant difference between light-evoked and spontaneous SWR parameters [sharp wave amplitude, p = 0.63; ripple amplitude, p = 0.81; ripple cycle number, p = 0.82; SWR duration, p = 1, Wilcoxon signed-rank test]. After the blockade of fast excitatory synaptic transmission (right), sharp wave-like transients with ripple oscillations could still be evoked [ripple frequency was 189 ± 16.7 Hz at light evoked and 186 ± 5.3 at spontaneous; p = 0.62, paired t test], albeit at a smaller amplitude [0.13 mV (0.11; 0.17) for spontaneous and 0.07 mV (0.06; 0.09) for evoked SWRs; p = 0.016, Wilcoxon signed-rank test]. D, Examples of s-SWR (left), light-evoked SWR (middle), and light-evoked SWR during the blockade of fast excitatory synaptic transmission (right). E, SWR peak-triggered averages of stimulus-evoked ripple oscillations during spontaneous SWR activity (left) and during the blockade of AMPA and NMDA receptors (right). F, Correlation between the length of light stimulation and the number of evoked ripple cycles during baseline conditions (ACSF; black squares) and after blocking fast excitatory transmission (red squares; mean ± SD). Under baseline conditions, any stimulation length shorter than the duration of spontaneous ripple duration evoked the same number of ripple cycles. Longer stimulation increased the number of ripple cycles to a small extent. The number of ripple oscillation cycles becomes the function of light stimulus duration in the absence of fast excitatory synaptic transmission.
On-line detection of SWRs.
We used an Arduino UNO microcontroller board (http://arduino.cc) running a script (written by A.I.G.) that read the signal from the amplifier, and when the amplitude of the LFP crossed a manually set value, it triggered the onset of laser illumination through a digital signal with a modifiable delay and length.
Modeling.
We used the following simple model to fit the IEI distributions of SWRs. We assume that, after a given SWR event, the next SWR is generated when the number of PCs firing (c out of a total N) in a relevant time bin (the integration time of PCs, Δt) first exceeds a threshold value. We also assume that the threshold increases transiently after a SWR and then decays back to its baseline value (n) after an exponential time course (with time constant τ). We aim to calculate the probability that the number of PCs firing within the integration time window first exceeds the threshold after a period t* after the previous SWR. This can be obtained as the probability that no threshold crossing occurred in any of the time bins before time t* and that the threshold is crossed during the time bin at time t*. We assume that the firing of PCs can be approximated by independent Poisson processes (of rate r) between SWRs. For realistic values of r (<1 Hz) and Δt (at most, a few tens of milliseconds), the probability of a given PC firing more than one spike in a given time bin is vanishingly small, and the probability that it fires one spike is approximately r × Δt. Therefore, the total number of PC spikes in a time bin follows a binomial distribution with parameters N and r × Δt. The probability that the first threshold crossing occurs in the kth time bin is then given by the following:
 |
where ck is the actual number of active cells in the kth bin, nk is the threshold at that time point, and pk is the probability of any one cell firing in that time bin. A continuous approximation to this formula is as follows:
 |
where cdf stands for cumulative density function and I is the incomplete β function. Assuming that r(t) = r is constant and n changes as follows:
 |
after a SWR at time 0, we fit the parameters r, Δt, and τ concurrently for all experiments and the parameters n0 and q individually for each experiment, using the nonlinear least squares optimization function lsqnonlin of MATLAB (R2009b).
Model network of reciprocally connected CA3 PV+ basket cells.
PVBCs were modeled as single-compartment linear integrate-and-fire neurons. The parameters of the model cell were set such that the firing frequency versus input current relationship (f–I curve) of the model cell approximated closely the f–I curve of real CA3 PVBCs as measured by a series of step current injections during somatic whole-cell recordings (n = 4) in the slice. The resulting parameters were as follows: membrane resistance, 200 MOhm; membrane time constant, 14 ms; mean resting potential, −70 mV; action potential threshold, −50 mV; reset potential, −64 mV; absolute refractory period, 0.1 ms. The actual value of the resting potential varied from cell to cell according to a uniform distribution with standard deviation 2.5 mV to create heterogeneity among the PVBCs. We estimated, based on published cell counts (Jinno and Kosaka, 2010), that the number of relatively intact PVBCs in the CA3 region of a 600-μm-thick slice from the ventral hippocampus is around 150. We estimated the probability that a given PVBC establishes synaptic contact with another arbitrarily chosen PVBC in the slice to be about 0.15. Synaptic inputs were assumed to have an exponential time course (time constant, 1.5 ms), a delay of 1.5 ms, a reversal potential of −70 mV, and a maximal conductance of 2 nS (Bartos, 2002). Each PVBC received a step current injection of amplitude 400 pA, lasting for 50 ms. The simulation was implemented using the PyNN (Davison et al., 2008; RRID:nif-0000-23351) simulation package, and simulations were run using the NEST simulator (Gewaltig and Diesmann, 2007; RRID:nif-0000-00162).
Statistics.
Throughout this manuscript, we used median, first, and third quartiles for the description of data groups because they usually did not show Gaussian distribution. In these cases, the Wilcoxon signed-rank test was used to test for statistically significant differences between groups. The application of other statistical tests is indicated in the text.
Results
A prolonged buildup of neuronal activity precedes ripple-modulated firing during SWRs
In our modified submerged slice chamber, SWRs occur spontaneously in the CA3 region of hippocampal slices (Hájos et al., 2009, 2013). SWRs were routinely present in slices of 400 μm (in 60 of 72 slices) to 600 μm (55 of 61) thickness; were occasionally, at a low rate, in 350-μm-thick slices (9 of 40); and were seen only exceptionally in 300-μm-thick (or thinner) slices (3 of 300), suggesting that SWR generation requires a minimum network size and/or connectivity. We recently characterized spontaneously occurring SWRs in vitro (Hájos et al., 2013) and showed that they are transient highly synchronous events that are distinct from pharmacologically induced epileptiform bursts (Karlocai et al., 2014).
To study the initiation of SWRs, we first examined how the activity of inhibitory and excitatory neurons evolves before, during, and after a SWR (Fig. 1). We reasoned that the distribution of EPSCs and IPSCs in relation to SWRs (Hájos et al., 2013) will reveal the evolution of excitatory and inhibitory neuronal activity. We constructed summed peristimulus time histograms of detected excitatory and inhibitory synaptic events. We found significant baseline excitatory activity between SWRs that were not accompanied by comparable inhibitory activity. Approximately 55 ms before the sharp wave peak, the frequency of EPSCs and IPSCs started to increase almost simultaneously. For the next 35 ms, until 20 ms before the peak of the SWRs, the increase of both excitation and inhibition closely followed an exponential curve. At this point, where activity was already severalfold higher than baseline, both types of activity started to be modulated at ripple frequency, and excitatory and inhibitory events shifted 180° out of phase. This threshold also coincided with the point where ripple modulation started to appear over the slow sharp wave envelope in the LFP signal.
Stochastic activity of PCs combined with a refractory mechanism initiate SWRs
SWRs are irregularly occurring events, whose timing cannot be explained using a traditional oscillator model. Therefore, to examine what mechanism initiates the observed exponential buildup, we detected SWRs and calculated their IEI distribution from 84 slices (Fig. 2). The shape of the IEI distribution showed considerable variation across experiments, with many distributions (particularly those with larger means) having a long, approximately exponential tail at large IEIs, indicating a random component in SWR initiation. We also observed a universal gap at short IEI lengths (∼200 ms) that suggests the presence of some refractory mechanism at the network or cellular level.
Our results so far suggested the following working hypothesis: SWRs are initiated from randomly fluctuating baseline activity when a sufficiently large number of PCs is active within a critical time window to initiate a buildup of activity in the recurrent excitatory network of CA3 PCs (de la Prida et al., 2006). We instantiated the above hypothesis in a simple mathematical model and calculated the probability that the critical amount of coincident firing occurs first after a given time after the previous SWR. The model assumes that the amount of required coincidence increases temporarily after a SWR event (attributable to transient changes in synaptic transmission and/or cellular excitability) and then decays back to its baseline value with some time constant (see Materials and Methods). When we assumed that some parameters of the model (such as the threshold amount of coincident firing) may vary from experiment to experiment, whereas others (such as the baseline firing rate and the refractory time constant) are shared between all slices, we could fit all experimentally determined IEI distributions with distributions produced by the model very precisely (Fig. 2C), supporting the validity of the model combining stochastic initiation with network refractoriness.
The stochastic element of the model predicts that the larger or more active the network is, the more frequent and regularly timed the SWRs are. The fact that SWRs were rarely observed in slices thinner than 350 μm is consistent with this prediction. We conducted two additional sets of experiments to test the predictions. To reduce functional network size, we locally injected a small amount of tetrodotoxin (TTX) into stratum radiatum via a glass capillary to block axonal conduction in some of the recurrent PC collaterals (Fig. 2D,E). After application of TTX, the incidence of SWRs decreased significantly, and the IEI distribution became wider. Conversely, when we slightly increased cellular excitability with a mACSF (Fig. 2F,G), the SWR rate increased and the IEI distribution became narrower. These results support the validity of our model and reinforce the presence of a stochastic element in SWR initiation.
Inhibitory currents mediated by PV+ cells contribute to the SWR local field potential and synchronize multiunit activity in stratum pyramidale
To identify the role of synaptic currents in the generation of the LFP and neuronal spiking in stratum pyramidale during sharp wave-ripples, we used a local injection of gabazine, a GABAA receptor antagonist, to eliminate perisomatic inhibition arriving onto PCs (Fig. 3). Excitatory inputs are not expected to contribute to stratum pyramidale LFP, because no excitatory input arrives onto the perisomatic region of PCs (Megías et al., 2001).
Gabazine was injected via a glass capillary next to an extracellular recording electrode (marked as “puffing channel” in figures), and a control electrode was placed at ∼150 μm distance to verify the local effect of the puff and to monitor network activity (experimental setup in Fig. 3, top; see also Materials and Methods). At the location of drug application, SWR amplitude decreased nearly to zero; ripple oscillations vanished; and, most importantly, the phase-locking of MU activity disappeared. Surprisingly, MU activity also decreased, suggesting that intact perisomatic inhibition may promote the firing of PCs during a SWR. The control electrode showed that the action of the drug was local and it did not influence network behavior, because the incidence of SWRs and their measured characteristics did not change after the puff. Furthermore, no changes were detected on the control and puffing channels when the drug-free buffer solution was injected (see Materials and Methods).
These results suggest that IPSCs contribute to the generation of the field potential signature of SWRs in stratum pyramidale, and, more importantly, perisomatic inhibition enforces ripple synchrony by phase-locking firing during SWRs.
To identify the type of neuron responsible for SWR-coupled perisomatic inhibition, we exploited the fact that the transmitter release of the two main classes of perisomatic region-targeting interneurons involves different voltage-dependent Ca2+ channels. Cholecystokinin-expressing basket cells express N-type Ca2+ channels at their axon terminals, which can be blocked by 500 nm ω-conotoxin, whereas PVBCs and axo-axonic cells have P/Q-type Ca2+ channels at their output synapses, which can be blocked by 500 nm ω-agatoxin (Wilson et al., 2001; Hefft and Jonas, 2005; Szabó et al., 2014).
When ω-agatoxin was injected locally into stratum pyramidale (Fig. 4A–D), we observed identical effects to those of the GABAA receptor antagonist gabazine: the sharp wave amplitude decreased, and the ripple oscillation vanished. Again, remarkably, the MU phase-locking disappeared, and the MU frequency dropped. Intracellular recording of IPSCs and EPSCs showed that perisomatic application of agatoxin significantly reduced inhibitory currents but had no effect on excitatory currents (data not shown). This is in agreement with the above quoted fact that PCs receive no excitatory input onto their perisomatic region (Megías et al., 2001).
Local puffs of ω-conotoxin did not evoke any detectable change in SWR parameters (Fig. 4E–H), indicating that cholecystokinin-expressing basket cells do not contribute to the generation of the SWR LFP or to MU phase-locking. This is also supported by in vivo and in vitro data (Klausberger et al., 2005; Lasztóczi et al., 2011; Hájos et al., 2013) in which this cell type was found to fire at low frequency during SWRs and showed no or weak phase-locking to ripple cycles.
In contrast, PV+ cells (especially PVBCs) were shown to fire phase-locked to the ripple oscillation during SWRs both in vivo and in vitro (Klausberger et al., 2003, 2005; Hájos et al., 2013). Our results indicate that PV+ cells are not just passive followers of the ripple oscillation, but their synaptic output contributes significantly to the field potential during SWRs and is also essential for the phase-locking of MU activity.
Reciprocally connected PV+ basket cells generate ripple oscillation when driven by tonic excitation
The next obvious question is how ripple phase-locked firing (Buzsáki et al., 2003) is generated. Gamma oscillations in the CA3 region are generated through the pyramidal–interneuron gamma oscillation (PING) mechanism (Whittington et al., 2000; Mann et al., 2005a), which involves reciprocal interactions between PCs and PV+ cells. However, theoretical studies strongly suggest that this mechanism cannot operate at ripple frequency (Brunel and Wang, 2003; Geisler et al., 2005). Modeling studies (Perkel and Mulloney, 1974; Brunel and Wang, 2003; Schomburg et al., 2012; Taxidis et al., 2012) suggest an alternative mechanism, whereby a mutually interconnected network of inhibitory cells driven by tonic excitation generates a high-frequency coherent oscillation. We will refer to rhythms generated through this mechanism as fast inhibitory neuronal oscillation (FINO).
PVBCs, but not axo-axonic cells, form mutually interconnected inhibitory networks in the hippocampus (Fukuda et al., 1996; Bartos, 2002). This fact, along with our observations that ripple oscillations start when the excitatory drive is sufficiently high (20 ms before SWR peak), and the fact that ripple oscillations disappear when the output synapses of PV+ cells are blocked suggests the following hypothesis. The tonic excitatory “envelope” arising from the buildup of activity of PCs drives the firing of PV+ cells. The activity of PVBCs then synchronizes at ripple frequency through the FINO mechanism, and their phasic inhibitory effect on PC output leads to ripple phase-modulated firing.
To verify the predicted role of PVBCs in the genesis of the ripple oscillation, we took advantage of the fact that the main axons of PV+ cells run at the border of strata pyramidale and lucidum (Pawelzik et al., 2002; Tukker et al., 2013). A small vertical cut here creates two separate, but internally connected subnetworks of PV+ cells without severing the recurrent collaterals of the PCs (which run in strata oriens and radiatum (Sik et al., 1993; Wittner et al., 2007) and thus retains a single continuous subnetwork of PCs. The cut is expected to decouple oscillations in the two halves of the slice (Fig. 5A–D). In control (uncut) slices, there is a strong coupling between sharp wave peaks and ripple negative peak times recorded by electrodes placed 150–200 μm apart in stratum pyramidale. Cutting the PV+ cell network into two halves between the two electrodes introduced a nondirectional jitter into relative sharp wave peak times but preserved their features. SWRs in the two halves were never separated by >20–25 ms and always occurred in both halves. The most striking result was that, whereas the ripple field oscillations and MU phase-locking were intact in both halves, the ripples (Fig. 5D) and, more remarkably, MU activity became massively uncorrelated between the two channels (Fig. 5C), as demonstrated by the cross-correlograms.
Figure 5.
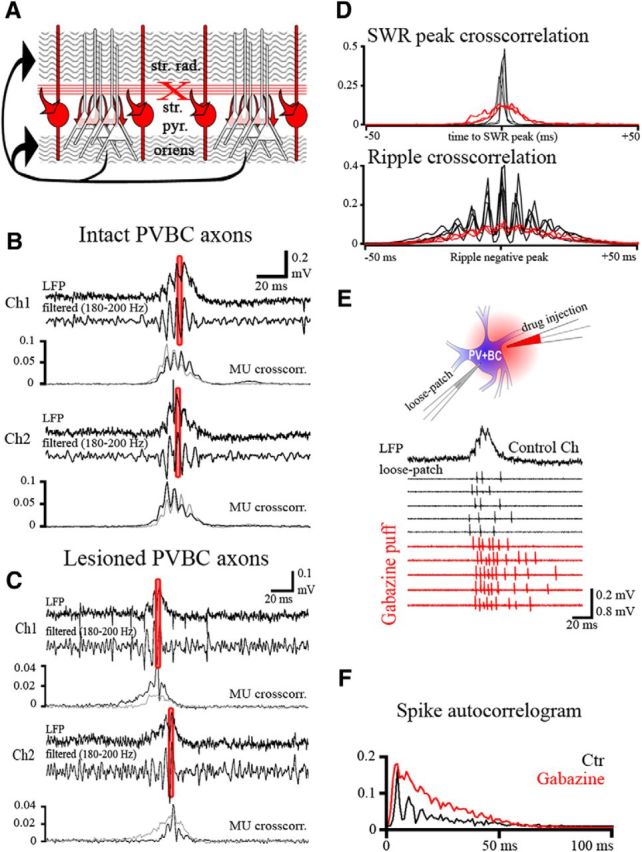
Cutting reciprocal connections between PV+ basket cells desynchronizes sharp waves and ripple oscillations. A, Outline of the experimental design. PVBCs and their axons are shown in red, and PCs and their recurrent collaterals are shown in black. The red X marks the position of the cut at the border of strata pyramidale (str. pyr.) and lucidum, which separates the reciprocally connected PVBCs by cutting their axons but leaves the recurrent collateral system of PCs, running in stratum oriens and stratum radiatum (str. rad.), intact. B, C, LFP recordings from two nearby (150 μm distance) sites in CA3 from a control slice (B; n = 4) and from two halves of a cut slice (C; n = 3). Both on Ch1 and Ch2, the unfiltered trace (top), the ripple-band filtered trace (middle), and the cross-correlation (crosscorr.) of SWR peak versus MU activity (bottom) on the same channel (black) and on the opposite channel (gray) are shown. D, Cross-correlation of sharp wave peaks (top) and ripple negativities (bottom) in the control (black) and cut (red) slices. Note the strong coupling between sharp wave peaks and ripple oscillations recorded concomitantly on the two electrodes in the control slice (B; black on D). Note that in the cut slice (C), SWRs are desynchronized (but remain close to each other) on the two channels (red cross-correlograms at the top in D). Ripple oscillations are present in both halves, but they lose their coherence among the two halves (red at the bottom in D). Also as shown by the black versus gray SWR to MU cross-correlograms, in the cut slice MUs are correlated with the local, but not with the opposite, SWR. E, PVBCs fire repetitive (3–5) action potentials locked to ripple oscillations under control conditions (PVBC in loose-patch configuration; black traces). Puffing gabazine onto their somatic region (n = 6) and thus removing their inhibitory inputs eliminated the ripple phase-locking of the cells' firing (relative to the ripples detected on the control channel; black trace on the top) and, as expected from disinhibition, increased their firing frequency [gray; 3.09 (2.46; 4.11) and 5.3 (4.7; 6.08) spikes/SWR before and after puff application of gabazine, respectively; p = 0.031, Wilcoxon signed-rank test]. F, The auto-correlogram of spikes demonstrates the loss of ripple modulation as a result of the removal of inhibition, suggesting that it is not the excitatory drive that phase-locks the firing of the cells.
These results revealed several key elements of the ripple generation mechanism. First, the tonic drive from the common excitatory buildup in the recurrent collateral system of the PCs drives the two PV+ cell subnetworks equally, but they start to generate ripple oscillations independently, and ripples are not coherent in the two halves. Reciprocal connections between PV+ cells thus have an essential role in ripple generation and synchrony. Second, although neurons in the two halves are expected to receive a common excitatory envelope, they fire (as indicated by the MUs associated with the local ripples) only when the local PV+ cell network is engaged, further supporting the idea that phasic perisomatic inhibition is somehow important in making PCs fire during ripples. Finally, the experiments also suggest that the neuronal coupling via gap junctions is not essential in ripple synchronization because these electrical connections among PV+ cells are found not in stratum pyramidale but further out in the basal and apical dendritic tufts (Fukuda and Kosaka, 2000), and thus they should have been preserved by the minor cut that desynchronized activity in the two halves of the cut slice.
To directly prove the role of reciprocal inhibition in phase-locking the firing of PV+ cells at the single-cell level, gabazine was puffed onto the somata of post hoc identified PVBCs recorded in the loose-patch configuration (Fig. 5E,F). The puff increased the frequency of their SWR-associated firing and abolished its ripple modulation, confirming the importance of phasic inhibitory input in timing the firing of PVBCs in the ripple-frequency range. This finding also argues against a critical role of gap junctions in the genesis of ripple oscillations because gabazine eliminated ripple phase-locking, yet it has not been reported to affect the function of gap junctions.
Optogenetic driving of PV+ inhibitory cells evokes sharp wave-ripples
To directly test the idea that selectively driving PV+ cells evokes high-frequency oscillation in the network, we used transgenic animals where the light-activated ion channel channelrhodopsin-2 was expressed exclusively in these types of interneurons (Fig. 6A). Under control conditions, when spontaneous SWRs occurred in the slice, brief light stimulations of the PV+ cells triggered field potential transients identical to spontaneous SWRs (Fig. 6B–F), regardless of stimulation length (5–50 ms). The evoked events contained both the slow component sharp wave and its superimposed ripple oscillation in the same amplitude ratio and timing as spontaneous SWRs. We then eliminated the contribution of PCs by blocking AMPA and NMDA receptor-mediated fast excitatory synaptic transmission by applying NBQX and AP-5 in the bath. After drug application, spontaneous SWR activity vanished, but light stimulation kept evoking field potential transients that had a slow sharp wave-like envelope ornamented with ripple-frequency oscillations. Under these conditions, the number of ripple cycles depended on the length of illumination, and ripple oscillations could be maintained longer than the duration of spontaneous SWRs. The experiment demonstrates that a tonic excitatory drive can generate phasic inhibitory activity. The same observations were made in slices where the dentate gyrus had been removed (n = 3), supporting the view that the CA3 network intrinsically generates SWRs.
The observation that (in the control case, but not when excitation is blocked) driving PV+ cells for even a short time initiates a full SWR suggests that PV+ cell activation somehow engages the excitatory neurons, which then sustain the drive to PV+ cells, and a normal SWR is played out (see phase-locked MU spikes in Fig. 7A). Indeed, when PV+ cells were driven by light pulses, a barrage of EPSCs could be recorded from either the PVBCs, superimposed on the light-evoked inward current (∼290 pA; n = 4), or the PCs (n = 13; Fig. 7B,C).
Figure 7.

Depolarization of PVCs drives multiunits and evokes EPSCs. A, As shown in Figure 6D, optogenetic stimulation of PVCs evokes SWRs similar to spontaneous ones. As shown by the cross-correlations between SWR peaks and MU activity, a 5 ms stimulation of PVCs generates MU distributions that are similar to those of spontaneously occurring SWRs. B, Optogenetic driving of PVCs evoked SWRs and repetitive action potentials in PVCs recorded in loose-patch configuration (top two traces; n = 2), as well as inward tonic currents (∼290 pA) ornamented with phasic EPSCs in whole-cell, voltage-clamp recordings (bottom trace and inset; n = 2). C, Transient (10 ms) optogenetic activation of the PVC population evoked a barrage of EPSCs in PCs (top; PCs held at −75 mV). The increase in EPSC occurrence in response to illumination (blue marks) is shown on a peristimulus time histogram (PSTH) of detected EPSCs around the start of the stimulation (bottom; n = 6; EPSC sums from 100 sweeps in 1 ms bins; average shown as the black trace). EPSC frequency significantly increased in response to the activation of PV+ inhibitory neurons [20.7 (15.4; 31.4) at baseline and 73.6 (71.2; 118.9) after illumination in hertz; p = 0.03, Wilcoxon signed-rank test]. We never saw ChR2-mediated currents in PCs (n = 13) that confirmed our anatomical data that there is no misexpression of ChR2 in CA3 PCs.
One additional observation confirmed our hypothesis regarding the mechanism of ripple generation. In some slices, light stimulation failed to evoke ripple oscillations when rapid excitatory transmission was blocked, probably because optical driving could not produce sufficient depolarization to drive high-frequency firing in PV+ cells. However, when we selectively depolarized PV+ cells with bath-applied CCK8 (Lee et al., 2011), SWR-like waveforms reappeared in response to illumination (Fig. 8A–C), strengthening the hypothesis that a tonic excitation of the mutually connected PV+ cells is sufficient to generate ripple-frequency firing through the FINO mechanism.
Figure 8.

Depolarization of PVCs with CCK8 facilitates optogenetically evoked SWRs after blockade of fast excitatory transmission. A, LFP recordings showing optogenetic stimulation (blue marks; 20 ms) of PV cells during the baseline period (top) and after blockade of AMPA and NMDA receptors (middle and bottom). Note that a selective tonic depolarization of PV cells with CCK8 (bottom; 500 nm; n = 4) assisted the optogenetic induction of SWR-like field potential transients in this experiment. B, C, Averages of evoked waveforms (60 events) before (B) and after (C) adding CCK8 to the bath solution.
Optogenetic silencing of PV+ inhibitory cells blocks sharp wave-ripples
To strengthen our claim for the role of PV+ cells in SWR generation, we tested the effect of temporarily silencing PV+ cells by optogenetic means under baseline conditions. eNpHR 3.0 was expressed in PV+ cells of the hippocampus after AAV-mediated Cre-dependent viral infection (Fig. 9A; n = 3 animals). The slices produced spontaneous SWRs, similar to the control animals. When on-line-detected SWRs were used to trigger short laser pulses (640 nm; 20 ms), SWRs were interrupted, i.e., their amplitude, duration, and ripple cycle count was significantly lower than that of control SWRs (Fig. 9B). When we applied long light stimuli (500 ms), we could block the generation of SWRs (Fig. 9C). These experiments support our conclusions that PV+ cells are essential for the initiation and maintenance of sharp waves and the generation of ripple oscillations.
Figure 9.

Silencing PV+ cells interrupts and blocks SWR generation. A, pAAV-Ef1a-DIO eNpHR 3.0-eYFP was injected into PVA-IRES-Cre animals to target PV+ cells in the hippocampal CA3 area (see Materials and Methods). Immunofluorescent staining against PV (red) and eNpHR 3.0-eYFP (green) demonstrated that eNpHR 3.0 was localized exclusively in the plasma membranes of PV+ inhibitory neurons (green arrowheads). PV cells not expressing eNpHR 3.0 were also found (28.5%). Insert, A PVBC is shown in current-clamp configuration, which is effectively silenced in response to illumination (calibration: 10 mV, 1 s). B, Spontaneous SWRs were present in the hippocampal slices prepared after 2–3 weeks after virus injection (black traces). Transient laser illumination (red marks) triggered by the early phase of spontaneous SWRs interrupted their further evolution (n = 3; gray traces). The illumination significantly decreased ripple amplitude [61.53% (percentage of the baseline value); p = 0.03; Wilcoxon signed-rank test], SWR length [56.78%; p = 0.02; Wilcoxon signed-rank test], and the number of ripple cycles [50.3%; p = 0.04; Wilcoxon signed-rank test]. C, Nontriggered, randomly timed, long (500 ms) illumination periods significantly reduced SWR initiation for the duration of the pulses (n = 3; 30.6%; p = 0.03; Wilcoxon signed-rank test).
Model network of reciprocally connected CA3 PV+ basket cells generates rhythmic activity at ripple frequency
To further support the idea that a network of interacting PVBCs is responsible for the generation of ripple oscillations, we built a simple model of the PVBC network in area CA3 in our slice experiments (see Materials and Methods). The model neurons were stimulated by simultaneous step current injections, whose amplitude (which was varied in the range 200–500 pA) was determined using the conductance values measured in our previous study (Hájos et al., 2013), and also matches the values we measured in the optogenetic experiments. The model cells started to fire shortly after the beginning of the stimulus and kept firing synchronously at high individual rates (Fig. 10A), which varied in the range 60–260 Hz (depending on the magnitude of the driving current), for the duration of the input. In contrast, the frequency of the population oscillation remained stable (∼180–220 Hz) when the excitatory drive was varied. Synchronous firing at ripple frequency was caused by inhibitory interactions between the cells, as eliminating these connections from the simulation resulted in asynchronous firing at an elevated rate (up to 300 Hz; Fig. 10B), similar to what we observed in the gabazine puff experiment shown in Figure 5E. These results reinforce the idea that a reciprocally connected PVBC network, when its members are sufficiently excited, generates ripple oscillations in CA3.
Figure 10.
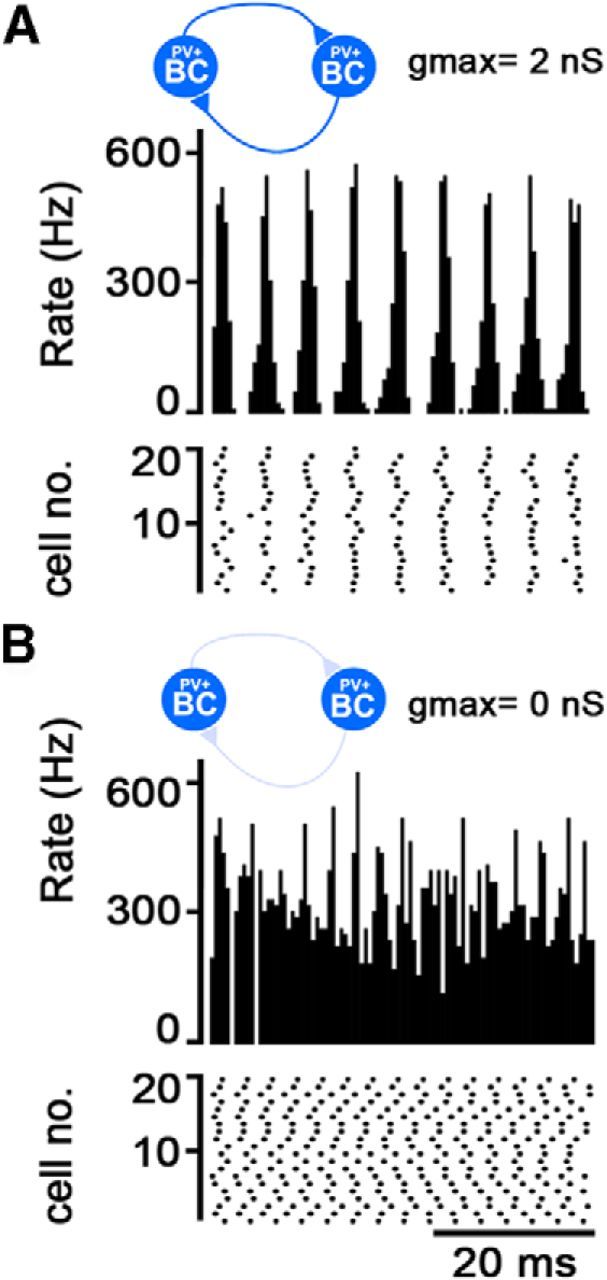
Network model of PVBC population generates ripple oscillation. A, Ripple-frequency (∼180 Hz), phase-locked firing evolves in a model network of 150 reciprocally connected PVBCs when they are driven by a 400 pA depolarizing current step, mimicking a 50-ms-long light activation (top row). Firing rasters of a subset of model PVBCs are shown in the second row. B, When reciprocal inhibition is removed, the phase-locking of firing disappears and cells increase their firing frequency, similar to what happened in the experiment shown in Figure 5, E and F.
Discussion
Our results suggest the following model for the generation of SWRs in CA3 (Fig. 11, left). First, a critical level of synchrony in PC firing, which is controlled by both stochastic and refractory mechanisms, initiates a buildup of activity in the recurrent excitatory collateral system of PCs. The resulting tonic excitation drives PVBC spiking. Their high-frequency firing is synchronized and phase-locked via reciprocal inhibition. Finally, this phasic activity of PVBCs phase-locks and, somewhat counterintuitively, promotes (rather than inhibits) the otherwise tonic firing of PCs.
Figure 11.

The mechanism of SWR generation and its comparison with the gamma-generating PING mechanism. Left, Steps of SWR generation: 1, sharp waves are initiated stochastically because of the buildup of excitatory activity in the recurrent collateral system of the excitatory PCs (red); 2, the strong excitation starts to drive the firing of PVBCs (blue); 3, their firing becomes ripple phase-locked and coherent because of their reciprocal inhibition; and 3′, this ripple phase-locked inhibition is also fed toward the PCs and promotes their phase-modulated firing. Note that in the FINO model, there is no cycle-by-cycle reciprocal interaction between the PCs and the PVBCs. Right, in the PING model, PC firing activates PVBCs that subsequently silence the PCs. When PCs recover from the inhibition, they begin to fire again and a new cycle starts. Note that here there is an alternation of excitatory and inhibitory activity because of the cycle-by-cycle interaction of PCs and PVBCs. The half-a-magnitude higher oscillation frequency is attributable to the facts that (1) IPSPs among PVBCs are faster than from PVBCs to PCs and (2) although in the FINO mechanism there is a single-step cycle (blue circular arrow), there is a two-step cycle in the PING mechanism (Brunel and Wang, 2003; Geisler et al., 2005).
Stochastic and refractory mechanisms govern the initiation of SWRs
The following facts suggested a combined stochastic/refractory model for SWR initiation (see also Peyrache et al., 2010): (1) there is a baseline level of excitatory activity between SWRs; (2) activity starts to build up >50 ms before SWR peak (see also Csicsvari et al., 2000); and (3) there is characteristic gap in the distribution of interevent intervals between subsequent SWRs. Similar ideas of activity buildup also emerged from previous studies (Miles and Wong, 1983; Csicsvari et al., 2000; de la Prida et al., 2006), and we verified the hypothesis in subsequent experiments.
The presence of a refractory mechanism is an essential component of the model. It ensures that a SWR does not restart within the observed 200–300 ms refractory window and may also be responsible for the termination of SWRs. Various cellular- and network-level refractory processes can be listed as potential candidates, but several of these appear to be inconsistent with the observations. The firing of PCs accommodates because of the activation of adaptation currents; thus, as a SWR builds up, PCs may be less and less likely to fire. Although we never observed PCs firing more than a single spike during SWRs, the slow buildup of depolarization or the occurrence of dendritic spikes could also reduce the responsiveness of PCs and help terminate SWRs even if the majority of PCs did not fire (Remy et al., 2009; Platkiewicz and Brette, 2011). Since PCs fire single spikes during SWRs the short-term depression of their terminals as a network-level refractory mechanism is not an option either. SWRs could yet be terminated by an inhibitory neuron population that activates slowly during the elevated activity. However, in our recent study (Hájos et al., 2013), we did not see interneurons activated during the second half of SWRs. Another candidate could be the short-term depression in the transmission of the repetitively firing PVCs (Galarreta and Hestrin, 1998; Kraushaar and Jonas, 2000; Bartos et al., 2001).
FINO underlies ripple generation and phase-locking of multiunit firing
Previous studies offer several hypotheses regarding the generation of high-frequency oscillations. Some models propose coordinated burst firing of PCs (de la Prida et al., 2006; Foffani et al., 2007; Jefferys et al., 2012), possibly synchronized via axonal gap junctions (Draguhn et al., 1998) or ephaptic entrainment (Anastassiou et al., 2010). Alternatively, fast oscillations may reflect the synchronized high-frequency firing of perisomatic region-targeting inhibitory interneurons (Buzsáki et al., 1992; Ylinen et al., 1995). Modeling studies (Perkel and Mulloney, 1974; Whittington et al., 1995; Wang and Buzsáki, 1996; Brunel and Wang, 2003; Taxidis et al., 2012) suggested a mechanism where a tonic excitatory drive generates a high-frequency coherent oscillation in a mutually interconnected network of inhibitory cells.
The somatic gabazine and agatoxin puff experiments revealed that eliminating perisomatic inhibition blocks ripple generation and eliminates MU phase-locking, and thus support the last model above, which we refer to as FINO. This model is clearly different from the gamma-generating PING mechanism (Fig. 11; Whittington et al., 2000; Mann et al., 2005a), which involves phasic reciprocal interactions between PCs and PVBC cells and cannot operate at ripple frequency (Brunel and Wang, 2003; Geisler et al., 2005). Our experiments and the neuronal network model also suggest that gap junctions are not essential components of the ripple-generating mechanism.
Whereas in the PING mechanism the activity of inhibitory neurons and PCs alternates and inhibitory neurons fire at a relatively low frequency, our results show that in the FINO mechanism, a strong tonic excitatory drive (that can be mimicked by optogenetic stimulation; Figs. 6–8) evokes high-frequency firing in PVBCs, and their reciprocal inhibitory connectivity is essential for coherence (Fig. 5). Thus, PVBCs are not only the current but also the rhythm generators of the ripple oscillation (Fig. 3).
The question why PVBCs inhibit PCs during gamma oscillations but only phase-lock PCs during SWRs can be resolved if we compare the results of the studies that measured synaptic input onto PCs during gamma oscillations (Hájos et al., 2004; Oren et al., 2006) and SWRs (Hájos et al., 2013). The comparison shows that although during gamma the ratio of the conductance of excitatory and inhibitory synaptic inputs onto PCs is 0.23, this ratio is twice as big during SWRs (0.47), suggesting a relatively stronger synaptic excitation of PCs during SWRs.
Although our results pinpoint PVBCs (but not CCK+ BCs) as critical components in the generation of ripple-frequency firing, we could not address the role of axo-axonic cells in the absence of selective tools. As axo-axonic cells are not reciprocally connected (Somogyi, 1977), they cannot participate in the FINO mechanism. Nevertheless, they may amplify the rhythm of PVBCs and participate in the selection of the subpopulation of PCs that start firing at the beginning of the SWR (Ellender et al., 2010). It is important to note, however, that they fire only in the first half of the ripple period (Klausberger et al., 2003; Hájos et al., 2013).
Although interneuronal synchronization through the FINO mechanism proved to be both necessary and sufficient for ripple generation, other resonance mechanisms, such as PC bursting or gap-junctional coupling, may amplify and tune the oscillation.
Control of firing of MUs: phase-locking and excitation by inhibition?
We have several matching observations suggesting that perisomatic inhibition, rather than inhibiting it, phase-locks and promotes MU firing during SWRs. Blocking perisomatic inhibition decreased MU frequency. When we separated the PVBC network into two halves, MU firing was associated with the local ripple oscillation and not with the common excitatory envelope, showing that local PVBC activity controls (phase-locks and promotes) MU firing in the given half. PV+ cells may also play a role in the initiation of SWRs as even a short (5 ms) optogenetic excitation of PV+ cells evoked a full SWR, associated MU firing, and EPSC sequences, suggesting that activation of PVBCs engages the PCs.
As our recording configuration does not allow us to infer the types of cells contributing to MU activity, the contribution of PCs and different types of inhibitory cells to phase-locked MUs must be inferred indirectly. Though PCs are numerous, they fire rarely, whereas inhibitory neurons in stratum pyramidale are in the minority (3–4% of neurons) but are more active (especially PVBCs). Thus, in principle, both populations could contribute equally. However, the experiment shown in Figure 5E reveals that PVBCs increase their SWR-related firing after the elimination of perisomatic inhibition, whereas the observed MU frequency drops at the same time. This suggests that the MUs we observe derive mostly from PCs (as other subpopulations of inhibitory cells fire much less than PVBCs (Hájos et al., 2013).
But how can perisomatic inhibition facilitate PC firing? There are several possible mechanisms: PV+ cells have been shown to inhibit dendritically projecting inhibitory neurons (Cobb et al., 1997). Therefore, when we eliminate perisomatic inhibition exerted by PV+ cells, dendritic inhibitory neurons will be disinhibited, and that might cause a drop in the firing of PCs (Lovett-Barron et al., 2012). Alternatively, phase-locked perisomatic IPSPs could facilitate the firing of PCs during SWRs. One evident mechanism of excitation by inhibition is rebound firing (Cobb et al., 1995). However, this scenario is not supported by experimental evidence: we and other laboratories have never seen rebound firing in CA3 PCs (Ellender et al., 2010). A somewhat similar and more plausible mechanism is that IPSCs de-inactivate voltage-gated ion channels [primarily transient sodium channels (Platkiewicz and Brette, 2011)] inactivated by the slowly ramping excitation during the build-up phase and help the cells fire phase-locked to ripples. The above mechanisms can even be synergistic. A more detailed examination of these possible mechanisms is necessary but is beyond the scope of this study.
PVBCs have been shown to be key players in the PING mechanism, which generates cholinergically induced gamma oscillations in CA3 (Mann et al., 2005b; Gulyás et al., 2010). Here, we show that the same interneurons are the necessary and sufficient elements of ripple generation but are recruited into a different mechanism (Fig. 11). The mechanisms we revealed may also be applied to the transmission and generation of SWRs in CA1. The excitatory envelope in CA1 is transmitted via the Schaffer collaterals from CA3. Feedforward excitation onto the local PVBCs that are also reciprocally connected may engage the FINO ripple generation locally, which could phase-lock CA1 PCs driven by excitation from CA3. Several studies noted previously that the ripple frequency in CA1 versus CA3 is different (Buzsáki et al., 1992; Nádasdy et al., 1999; Sullivan et al., 2011; Tukker et al., 2013) and concluded that ripples must be generated locally. Our results provided a mechanism for local ripple generation. The fact that ripples of CA1 are not coherent with ripples of CA3 (Patel et al., 2013) also supports that ripples are not transmitted from CA3 cycle by cycle but are generated locally and thus rejects the PING model (where cycles are transmitted individually from CA3 to CA1 by phasic excitation; Zemankovics et al., 2013) and supports the FINO mechanism.
Footnotes
This work was supported by the Hungarian Scientific Research Fund (OTKA K83251, NNF 85659), the National Office for Research and Technology (OMFB-01678/2009), ERC-2011-ADG-294313 (SERRACO), Kutatási és Technológiai Innovációs Alap AIK 12-1-2013-0005, and the EU FP7 Grant 604102 (Human Brain Project). We thank Drs. György Buzsáki, Liset Menendez de la Prida, and Viktor Varga for helpful comments on this manuscript. We thank Katalin Lengyel, Erzsébet Gregori, and Éva Krizsán for excellent technical assistance.
The authors declare no competing financial interests.
References
- Anastassiou CA, Montgomery SM, Barahona M, Buzsáki G, Koch C. The effect of spatially inhomogeneous extracellular electric fields on neurons. J Neurosci. 2010;30:1925–1936. doi: 10.1523/JNEUROSCI.3635-09.2010. [DOI] [PMC free article] [PubMed] [Google Scholar]
- Bartos M, Vida I, Frotscher M, Meyer A, Monyer H, Geiger JR, Jonas P. Fast synaptic inhibition promotes synchronized gamma oscillations in hippocampal interneuron networks. Proc Natl Acad Sci U S A. 2002;99:13222–13227. doi: 10.1073/pnas.192233099. [DOI] [PMC free article] [PubMed] [Google Scholar]
- Bartos M, Vida I, Frotscher M, Geiger JR, Jonas P. Rapid signaling at inhibitory synapses in a dentate gyrus interneuron network. J Neurosci. 2001;21:2687–2698. doi: 10.1523/JNEUROSCI.21-08-02687.2001. [DOI] [PMC free article] [PubMed] [Google Scholar]
- Brunel N, Wang XJ. What determines the frequency of fast network oscillations with irregular neural discharges? I. Synaptic dynamics and excitation-inhibition balance. J Neurophysiol. 2003;90:415–430. doi: 10.1152/jn.01095.2002. [DOI] [PubMed] [Google Scholar]
- Buzsáki G. Hippocampal sharp waves: their origin and significance. Brain Res. 1986;398:242–252. doi: 10.1016/0006-8993(86)91483-6. [DOI] [PubMed] [Google Scholar]
- Buzsáki G. Two-stage model of memory trace formation: a role for “noisy” brain states. Neuroscience. 1989;31:551–570. doi: 10.1016/0306-4522(89)90423-5. [DOI] [PubMed] [Google Scholar]
- Buzsáki G, Chrobak JJ. Temporal structure in spatially organized neuronal ensembles: a role for interneuronal networks. Curr Opin Neurobiol. 1995;5:504–510. doi: 10.1016/0959-4388(95)80012-3. [DOI] [PubMed] [Google Scholar]
- Buzsáki G, Leung LW, Vanderwolf CH. Cellular bases of hippocampal EEG in the behaving rat. Brain Res. 1983;287:139–171. doi: 10.1016/0165-0173(83)90037-1. [DOI] [PubMed] [Google Scholar]
- Buzsáki G, Horváth Z, Urioste R, Hetke J, Wise K. High-frequency network oscillation in the hippocampus. Science. 1992;256:1025–1027. doi: 10.1126/science.1589772. [DOI] [PubMed] [Google Scholar]
- Buzsáki G, Buhl DL, Harris KD, Csicsvari J, Czéh B, Morozov A. Hippocampal network patterns of activity in the mouse. Neuroscience. 2003;116:201–211. doi: 10.1016/S0306-4522(02)00669-3. [DOI] [PubMed] [Google Scholar]
- Cobb SR, Buhl EH, Halasy K, Paulsen O, Somogyi P. Synchronization of neuronal activity in hippocampus by individual GABAergic interneurons. Nature. 1995;378:75–78. doi: 10.1038/378075a0. [DOI] [PubMed] [Google Scholar]
- Cobb SR, Halasy K, Vida I, Nyiri G, Tamás G, Buhl EH, Somogyi P. Synaptic effects of identified interneurons innervating both interneurons and pyramidal cells in the rat hippocampus. Neuroscience. 1997;79:629–648. doi: 10.1016/S0306-4522(97)00055-9. [DOI] [PubMed] [Google Scholar]
- Csicsvari J, Hirase H, Mamiya A, Buzsáki G. Ensemble patterns of hippocampal CA3-CA1 neurons during sharp wave-associated population events. Neuron. 2000;28:585–594. doi: 10.1016/S0896-6273(00)00135-5. [DOI] [PubMed] [Google Scholar]
- Davison AP, Brüderle D, Eppler J, Kremkow J, Muller E, Pecevski D, Perrinet L, Yger P. PyNN: a common interface for neuronal network simulators. Front Neuroinform. 2008;2:11. doi: 10.3389/neuro.11.011.2008. [DOI] [PMC free article] [PubMed] [Google Scholar]
- de la Prida LM, Huberfeld G, Cohen I, Miles R. Threshold behavior in the initiation of hippocampal population bursts. Neuron. 2006;49:131–142. doi: 10.1016/j.neuron.2005.10.034. [DOI] [PubMed] [Google Scholar]
- Diba K, Buzsáki G. Forward and reverse hippocampal place-cell sequences during ripples. Nat Neurosci. 2007;10:1241–1242. doi: 10.1038/nn1961. [DOI] [PMC free article] [PubMed] [Google Scholar]
- Draguhn A, Traub RD, Schmitz D, Jefferys JG. Electrical coupling underlies high-frequency oscillations in the hippocampus in vitro. Nature. 1998;394:189–192. doi: 10.1038/28184. [DOI] [PubMed] [Google Scholar]
- Ellender TJ, Nissen W, Colgin LL, Mann EO, Paulsen O. Priming of hippocampal population bursts by individual perisomatic-targeting interneurons. J Neurosci. 2010;30:5979–5991. doi: 10.1523/JNEUROSCI.3962-09.2010. [DOI] [PMC free article] [PubMed] [Google Scholar]
- Foffani G, Uzcategui YG, Gal B, Menendez de la Prida L. Reduced spike-timing reliability correlates with the emergence of fast ripples in the rat epileptic hippocampus. Neuron. 2007;55:930–941. doi: 10.1016/j.neuron.2007.07.040. [DOI] [PubMed] [Google Scholar]
- Foster DJ, Wilson MA. Reverse replay of behavioural sequences in hippocampal place cells during the awake state. Nature. 2006;440:680–683. doi: 10.1038/nature04587. [DOI] [PubMed] [Google Scholar]
- Fukuda T, Kosaka T. Gap junctions linking the dendritic network of GABAergic interneurons in the hippocampus. J Neurosci. 2000;20:1519–1528. doi: 10.1523/JNEUROSCI.20-04-01519.2000. [DOI] [PMC free article] [PubMed] [Google Scholar]
- Fukuda T, Aika Y, Heizmann CW, Kosaka T. Dense GABAergic input on somata of parvalbumin-immunoreactive GABAergic neurons in the hippocampus of the mouse. Neurosci Res. 1996;26:181–194. doi: 10.1016/S0168-0102(96)01102-9. [DOI] [PubMed] [Google Scholar]
- Galarreta M, Hestrin S. Frequency-dependent synaptic depression and the balance of excitation and inhibition in the neocortex. Nat Neurosci. 1998;1:587–594. doi: 10.1038/2882. [DOI] [PubMed] [Google Scholar]
- Geisler C, Brunel N, Wang XJ. Contributions of intrinsic membrane dynamics to fast network oscillations with irregular neuronal discharges. J Neurophysiol. 2005;94:4344–4361. doi: 10.1152/jn.00510.2004. [DOI] [PubMed] [Google Scholar]
- Gewaltig M-O, Diesmann M. NEST (NEural Simulation Tool) Scholarpedia. 2007;2:1430. doi: 10.4249/scholarpedia.1430. [DOI] [Google Scholar]
- Girardeau G, Benchenane K, Wiener S, Buzsáki G, Zugaro M. Selective suppression of hippocampal ripples impairs spatial memory. Nat. Neurosci. 2009;12:1222–1223. doi: 10.1038/nn.2384. [DOI] [PubMed] [Google Scholar]
- Gulyás AI, Szabó GG, Ulbert I, Holderith N, Monyer H, Erdélyi F, Szabó G, Freund TF, Hájos N. Parvalbumin-containing fast-spiking basket cells generate the field potential oscillations induced by cholinergic receptor activation in the hippocampus. J Neurosci. 2010;30:15134–15145. doi: 10.1523/JNEUROSCI.4104-10.2010. [DOI] [PMC free article] [PubMed] [Google Scholar]
- Hájos N, Pálhalmi J, Mann EO, Németh B, Paulsen O, Freund TF. Spike timing of distinct types of GABAergic interneuron during hippocampal gamma oscillations in vitro. J Neurosci. 2004;24:9127–9137. doi: 10.1523/JNEUROSCI.2113-04.2004. [DOI] [PMC free article] [PubMed] [Google Scholar]
- Hájos N, Ellender TJ, Zemankovics R, Mann EO, Exley R, Cragg SJ, Freund TF, Paulsen O. Maintaining network activity in submerged hippocampal slices: importance of oxygen supply. Eur J Neurosci. 2009;29:319–327. doi: 10.1111/j.1460-9568.2008.06577.x. [DOI] [PMC free article] [PubMed] [Google Scholar]
- Hájos N, Karlócai MR, Németh B, Ulbert I, Monyer H, Szabó G, Erdélyi F, Freund TF, Gulyás AI. Input–output features of anatomically identified CA3 neurons during hippocampal sharp wave/ripple oscillation in vitro. J Neurosci. 2013;33:11677–11691. doi: 10.1523/JNEUROSCI.5729-12.2013. [DOI] [PMC free article] [PubMed] [Google Scholar]
- Hefft S, Jonas P. Asynchronous GABA release generates long-lasting inhibition at a hippocampal interneuron-principal neuron synapse. Nat Neurosci. 2005;8:1319–1328. doi: 10.1038/nn1542. [DOI] [PubMed] [Google Scholar]
- Jefferys JG, Menendez de la Prida L, Wendling F, Bragin A, Avoli M, Timofeev I, Lopes da Silva FH. Mechanisms of physiological and epileptic HFO generation. Prog Neurobiol. 2012;98:250–264. doi: 10.1016/j.pneurobio.2012.02.005. [DOI] [PMC free article] [PubMed] [Google Scholar]
- Jinno S, Kosaka T. Stereological estimation of numerical densities of glutamatergic principal neurons in the mouse hippocampus. Hippocampus. 2010;20:829–840. doi: 10.1002/hipo.20685. [DOI] [PubMed] [Google Scholar]
- Karlocai MR, Kohus Z, Kali S, Ulbert I, Szabo G, Mate Z, Freund TF, Gulyas AI. Physiological sharp wave-ripples and interictal events in vitro: what's the difference? Brain. 2014;137:463–485. doi: 10.1093/brain/awt348. [DOI] [PubMed] [Google Scholar]
- Klausberger T, Magill PJ, Márton LF, Roberts JD, Cobden PM, Buzsáki G, Somogyi P. Brain-state- and cell-type-specific firing of hippocampal interneurons in vivo. Nature. 2003;421:844–848. doi: 10.1038/nature01374. [DOI] [PubMed] [Google Scholar]
- Klausberger T, Márton LF, Baude A, Roberts JD, Magill PJ, Somogyi P. Spike timing of dendrite-targeting bistratified cells during hippocampal network oscillations in vivo. Nat Neurosci. 2004;7:41–47. doi: 10.1038/nn1159. [DOI] [PubMed] [Google Scholar]
- Klausberger T, Marton LF, O'Neill JH, Huck JH, Dalezios Y, Fuentealba P, Suen WY, Papp E, Kaneko T, Watanabe M, Csicsvari J, Somogyi P. Complementary roles of cholecystokinin- and parvalbumin-expressing GABAergic neurons in hippocampal network oscillations. J Neurosci. 2005;25:9782–9793. doi: 10.1523/JNEUROSCI.3269-05.2005. [DOI] [PMC free article] [PubMed] [Google Scholar]
- Kraushaar U, Jonas P. Efficacy and stability of quantal GABA release at a hippocampal interneuron–principal neuron synapse. J Neurosci. 2000;20:5594–5607. doi: 10.1523/JNEUROSCI.20-15-05594.2000. [DOI] [PMC free article] [PubMed] [Google Scholar]
- Lapray D, Lasztoczi B, Lagler M, Viney TJ, Katona L, Valenti O, Hartwich K, Borhegyi Z, Somogyi P, Klausberger T. Behavior-dependent specialization of identified hippocampal interneurons. Nat Neurosci. 2012;15:1265–1271. doi: 10.1038/nn.3176. [DOI] [PMC free article] [PubMed] [Google Scholar]
- Lasztóczi B, Tukker JJ, Somogyi P, Klausberger T. Terminal field and firing selectivity of cholecystokinin-expressing interneurons in the hippocampal CA3 area. J Neurosci. 2011;31:18073–18093. doi: 10.1523/JNEUROSCI.3573-11.2011. [DOI] [PMC free article] [PubMed] [Google Scholar]
- Lee SY, Földy C, Szabadics J, Soltesz I. Cell-type-specific CCK2 receptor signaling underlies the cholecystokinin-mediated selective excitation of hippocampal parvalbumin-positive fast-spiking basket cells. J Neurosci. 2011;31:10993–11002. doi: 10.1523/JNEUROSCI.1970-11.2011. [DOI] [PMC free article] [PubMed] [Google Scholar]
- Lovett-Barron M, Turi GF, Kaifosh P, Lee PH, Bolze F, Sun XH, Nicoud J-F, Zemelman BV, Sternson SM, Losonczy A. Regulation of neuronal input transformations by tunable dendritic inhibition. Nat Neurosci. 2012;15:423–430. S1–S3. doi: 10.1038/nn.3024. [DOI] [PubMed] [Google Scholar]
- Maier N, Nimmrich V, Draguhn A. Cellular and network mechanisms underlying spontaneous sharp wave-ripple complexes in mouse hippocampal slices. J Physiol. 2003;550:873–887. doi: 10.1113/jphysiol.2003.044602. [DOI] [PMC free article] [PubMed] [Google Scholar]
- Mann EO, Radcliffe CA, Paulsen O. Hippocampal gamma-frequency oscillations: from interneurones to pyramidal cells, and back. J Physiol. 2005a;562:55–63. doi: 10.1113/jphysiol.2004.078758. [DOI] [PMC free article] [PubMed] [Google Scholar]
- Mann EO, Suckling JM, Hajos N, Greenfield SA, Paulsen O. Perisomatic feedback inhibition underlies cholinergically induced fast network oscillations in the rat hippocampus in vitro. Neuron. 2005b;45:105–117. doi: 10.1016/j.neuron.2004.12.016. [DOI] [PubMed] [Google Scholar]
- Megías M, Emri Z, Freund TF, Gulyás AI. Total number and distribution of inhibitory and excitatory synapses on hippocampal CA1 pyramidal cells. Neuroscience. 2001;102:527–540. doi: 10.1016/S0306-4522(00)00496-6. [DOI] [PubMed] [Google Scholar]
- Meyer AH, Katona I, Blatow M, Rozov A, Monyer H. In vivo labeling of parvalbumin-positive interneurons and analysis of electrical coupling in identified neurons. J Neurosci. 2002;22:7055–7064. doi: 10.1523/JNEUROSCI.22-16-07055.2002. [DOI] [PMC free article] [PubMed] [Google Scholar]
- Miles R, Wong RK. Single neurones can initiate synchronized population discharge in the hippocampus. Nature. 1983;306:371–373. doi: 10.1038/306371a0. [DOI] [PubMed] [Google Scholar]
- Nádasdy Z, Hirase H, Czurkó A, Csicsvari J, Buzsáki G. Replay and time compression of recurring spike sequences in the hippocampus. J Neurosci. 1999;19:9497–9507. doi: 10.1523/JNEUROSCI.19-21-09497.1999. [DOI] [PMC free article] [PubMed] [Google Scholar]
- Oren I, Mann EO, Paulsen O, Hájos N. Synaptic currents in anatomically identified CA3 neurons during hippocampal gamma oscillations in vitro. J Neurosci. 2006;26:9923–9934. doi: 10.1523/JNEUROSCI.1580-06.2006. [DOI] [PMC free article] [PubMed] [Google Scholar]
- Patel J, Schomburg EW, Berényi A, Fujisawa S, Buzsáki G. Local generation and propagation of ripples along the septotemporal axis of the hippocampus. J Neurosci. 2013;33:17029–17041. doi: 10.1523/JNEUROSCI.2036-13.2013. [DOI] [PMC free article] [PubMed] [Google Scholar]
- Pawelzik H, Hughes DI, Thomson AM. Modulation of inhibitory autapses and synapses on rat CA1 interneurones by GABA(A) receptor ligands. J Physiol. 2002;546:701–716. doi: 10.1113/jphysiol.2002.035121. [DOI] [PMC free article] [PubMed] [Google Scholar]
- Perkel DH, Mulloney B. Motor pattern production in reciprocally inhibitory neurons exhibiting postinhibitory rebound. Science. 1974;185:181–183. doi: 10.1126/science.185.4146.181. [DOI] [PubMed] [Google Scholar]
- Peyrache A, Benchenane K, Khamassi M, Wiener SI, Battaglia FP. Sequential reinstatement of neocortical activity during slow oscillations depends on cells' global activity. Front Syst Neurosci. 2010;3:18. doi: 10.3389/neuro.06.018.2009. [DOI] [PMC free article] [PubMed] [Google Scholar]
- Platkiewicz J, Brette R. Impact of fast sodium channel inactivation on spike threshold dynamics and synaptic integration. PLoS Comput Biol. 2011;7:e1001129. doi: 10.1371/journal.pcbi.1001129. [DOI] [PMC free article] [PubMed] [Google Scholar]
- Remy S, Csicsvari J, Beck H. Activity-dependent control of neuronal output by local and global dendritic spike attenuation. Neuron. 2009;61:906–916. doi: 10.1016/j.neuron.2009.01.032. [DOI] [PubMed] [Google Scholar]
- Schomburg EW, Anastassiou CA, Buzsáki G, Koch C. The spiking component of oscillatory extracellular potentials in the rat hippocampus. J Neurosci. 2012;32:11798–11811. doi: 10.1523/JNEUROSCI.0656-12.2012. [DOI] [PMC free article] [PubMed] [Google Scholar]
- Sik A, Tamamaki N, Freund TF. Complete axon arborization of a single CA3 pyramidal cell in the rat hippocampus, and its relationship with postsynaptic parvalbumin-containing interneurons. Eur J Neurosci. 1993;5:1719–1728. doi: 10.1111/j.1460-9568.1993.tb00239.x. [DOI] [PubMed] [Google Scholar]
- Somogyi P. A specific “axo-axonal” interneuron in the visual cortex of the rat. Brain Res. 1977;136:345–350. doi: 10.1016/0006-8993(77)90808-3. [DOI] [PubMed] [Google Scholar]
- Sullivan D, Csicsvari J, Mizuseki K, Montgomery S, Diba K, Buzsáki G. Relationships between hippocampal sharp waves, ripples, and fast gamma oscillation: influence of dentate and entorhinal cortical activity. J Neurosci. 2011;31:8605–8616. doi: 10.1523/JNEUROSCI.0294-11.2011. [DOI] [PMC free article] [PubMed] [Google Scholar]
- Szabó GG, Lenkey N, Holderith N, Andrási T, Nusser Z, Hájos N. Presynaptic calcium channel inhibition underlies CB1 cannabinoid receptor-mediated suppression of GABA release. J Neurosci. 2014;34:7958–7963. doi: 10.1523/JNEUROSCI.0247-14.2014. [DOI] [PMC free article] [PubMed] [Google Scholar]
- Taxidis J, Coombes S, Mason R, Owen MR. Modeling sharp wave-ripple complexes through a CA3-CA1 network model with chemical synapses. Hippocampus. 2012;22:995–1017. doi: 10.1002/hipo.20930. [DOI] [PubMed] [Google Scholar]
- Tukker JJ, Lasztóczi B, Katona L, Roberts JD, Pissadaki EK, Dalezios Y, Márton L, Zhang L, Klausberger T, Somogyi P. Distinct dendritic arborization and in vivo firing patterns of parvalbumin-expressing basket cells in the hippocampal area CA3. J Neurosci. 2013;33:6809–6825. doi: 10.1523/JNEUROSCI.5052-12.2013. [DOI] [PMC free article] [PubMed] [Google Scholar]
- Wang XJ, Buzsáki G. Gamma oscillation by synaptic inhibition in a hippocampal interneuronal network model. J Neurosci. 1996;16:6402–6413. doi: 10.1523/JNEUROSCI.16-20-06402.1996. [DOI] [PMC free article] [PubMed] [Google Scholar]
- Whittington MA, Traub RD, Jefferys JG. Synchronized oscillations in interneuron networks driven by metabotropic glutamate receptor activation. Nature. 1995;373:612–615. doi: 10.1038/373612a0. [DOI] [PubMed] [Google Scholar]
- Whittington MA, Traub RD, Kopell N, Ermentrout B, Buhl EH. Inhibition-based rhythms: experimental and mathematical observations on network dynamics. Int J Psychophysiol. 2000;38:315–336. doi: 10.1016/S0167-8760(00)00173-2. [DOI] [PubMed] [Google Scholar]
- Wilson RI, Kunos G, Nicoll RA. Presynaptic specificity of endocannabinoid signaling in the hippocampus. Neuron. 2001;31:453–462. doi: 10.1016/S0896-6273(01)00372-5. [DOI] [PubMed] [Google Scholar]
- Wiltgen BJ, Brown RA, Talton LE, Silva AJ. New circuits for old memories: the role of the neocortex in consolidation. Neuron. 2004;44:101–108. doi: 10.1016/j.neuron.2004.09.015. [DOI] [PubMed] [Google Scholar]
- Wittner L, Henze DA, Záborszky L, Buzsáki G. Three-dimensional reconstruction of the axon arbor of a CA3 pyramidal cell recorded and filled in vivo. Brain Struct Funct. 2007;212:75–83. doi: 10.1007/s00429-007-0148-y. [DOI] [PMC free article] [PubMed] [Google Scholar]
- Ylinen A, Bragin A, Nádasdy Z, Jandó G, Szabó I, Sik A, Buzsáki G. Sharp wave-associated high-frequency oscillation (200 Hz) in the intact hippocampus: network and intracellular mechanisms. J Neurosci. 1995;15:30–46. doi: 10.1523/JNEUROSCI.15-01-00030.1995. [DOI] [PMC free article] [PubMed] [Google Scholar]
- Zemankovics R, Veres JM, Oren I, Hájos N. Feedforward inhibition underlies the propagation of cholinergically induced gamma oscillations from hippocampal CA3 to CA1. J Neurosci. 2013;33:12337–12351. doi: 10.1523/JNEUROSCI.3680-12.2013. [DOI] [PMC free article] [PubMed] [Google Scholar]