

Abstract
Intense radiant heat pulses concomitantly activate Aδ- and C-fiber skin nociceptors, and elicit a typical double sensation: an initial Aδ-related pricking pain is followed by a C-related prolonged burning sensation. It has been repeatedly reported that C-fiber laser-evoked potentials (C-LEPs) become detectable only when the concomitant activation of Aδ-fibers is avoided or reduced. Given that the saliency of the eliciting stimulus is a major determinant of LEPs, one explanation for these observations is that the saliency of the C-input is smaller than that of the preceding Aδ-input. However, even if the saliency of the C-input is reduced because of the preceding Aδ-input, a C-LEP should still be visible even when preceded by an Aδ-LEP response. Here we tested this hypothesis by applying advanced signal processing techniques (peak alignment and time-frequency decomposition) to electroencephalographic data collected in two experiments conducted in 34 and 96 healthy participants. We show that, when using optimal stimulus parameters (delivering >80 stimuli within a small skin territory), C-LEPs can be reliably detected in most participants. Importantly, C-LEPs are observed even when preceded by Aδ-LEPs, both in average waveforms and single trials. By providing quantitative information about several response properties of C-LEPs (latency jitter, stimulus-response and perception–response functions, dependency on stimulus repetitions and stimulated area), these results define optimal parameters to record C-LEPs simply and reliably. These findings have important clinical implications for assessing small-fiber function in neuropathies and neuropathic pain.
Keywords: Aδ-fibers, C-fibers, evoked potentials, first pain, nociception, second pain
Introduction
Intense radiant heat pulses generated by infrared laser stimulators concomitantly activate Aδ- and C-fiber endings located in the superficial skin layers (Bromm and Treede, 1984). However, because of the different conduction velocity of Aδ (∼15 m/s) and C (∼1 m/s) afferents, laser stimuli elicit a typical double sensation: an initial Aδ fiber-related pricking pain is followed by a C fiber-related burning pain (Lewis and Pochin, 1937; Basbaum and Bushnell, 2009). The brain responses elicited by such stimuli (laser-evoked potentials; LEPs) show clear components at latencies compatible with the conduction velocity of Aδ-fibers (Aδ-LEPs or late LEPs; Treede et al., 1988a,b). In contrast, components related to the activation of C-fibers (C-LEPs or ultralate LEPs; Iannetti et al., 2003) are much more difficult to detect, and they have been suggested to appear only when the concomitant activation of Aδ-fibers is avoided or reduced (Bromm and Treede, 1983; Mouraux et al., 2003).
This notion is largely based on the reports of C-LEPs elicited by laser stimuli delivered at energies below the activation threshold of Aδ-fibers (Magerl et al., 1999), during selective blockade of myelinated afferents (Bromm and Treede, 1983), and in patients lacking myelinated afferents (Treede and Cole, 1993). Given that the saliency of the eliciting stimulus is a major determinant of LEPs (Iannetti et al., 2008; Mouraux and Iannetti, 2009; Ronga et al., 2013), one explanation for these observations is that the saliency of the C-fiber input is smaller than that of the preceding Aδ-input, because it is of lower intensity and higher temporal predictability. Indeed, both decreases of intensity within a stream of successive sensory stimuli (Ronga et al., 2013) and temporal predictability (Mouraux et al., 2003; Wang et al., 2010) are factors that reduce the amplitude of the LEP response.
However, it is important to highlight that even when stimulus saliency is reduced by, for example, repeating trains of three stimuli at 1 Hz (triplets: S1-S2-S3; Iannetti et al., 2008; Valentini et al., 2011; Ronga et al., 2013), both S2 and S3 still elicit an LEP response, albeit of small amplitude. Thus, a C-LEP response should still be visible even when preceded by an Aδ-LEP response, although of smaller amplitude compared with the C-LEP response elicited when C-fibers are activated selectively.
Here we tested this hypothesis by applying advanced signal processing techniques (peak alignment and time-frequency decomposition) to electroencephalographic (EEG) data collected from 34 healthy participants (Experiment 1). We characterized (1) the within- and between-subject latency variability of both Aδ-LEPs and C-LEPs; (2) the dependency of Aδ-LEP and C-LEP magnitudes on stimulus energy and subjective pain perception; (3) the correlation between Aδ-LEP and C-LEP magnitudes, both within- and between-subjects; and (4) the dependency of the C-LEP signal-to-noise ratio (SNR) on the number of stimulus repetitions. In addition, by comparing the EEG data collected in Experiment 1 with those collected from other 96 healthy participants (Experiment 2), we also assessed (5) the effect of stimulated area on the C-LEP latency jitter.
Materials and Methods
Experiment 1
Participants.
EEG data were collected from 34 healthy volunteers (17 females) aged 21.6 ± 1.7 years (mean ± SD, range = 18–25 years). All volunteers gave their written informed consent and were paid for their participation. The experiment procedures were approved by the local ethics committee.
Nociceptive stimulation and experimental design.
Nociceptive-specific radiant-heat stimuli were generated by an infrared neodymium yttrium aluminum perovskite (Nd:YAP) laser with a wavelength of 1.34 μm (Electronical Engineering). At this wavelength, laser pulses activate directly nociceptive terminals in the most superficial skin layers (Baumgärtner et al., 2005; Iannetti et al., 2006). Laser pulses were directed on a rectangular area (2 × 3 cm2, with the longer axis oriented mediolaterally) on the radial aspect of the left hand dorsum, between the first and the second metacarpus. A He-Ne laser pointed to the area to be stimulated. The laser beam was transmitted via an optic fiber and its diameter was set at ∼7 mm (≈38 mm2) by focusing lenses. The duration of the laser pulse was 4 ms. After each stimulus, the target of the laser beam was shifted by at least 1 cm in a random direction, to allow for passive skin cooling and avoid nociceptor fatigue or sensitization.
Participants were asked to report the intensity of pain perception elicited by the laser stimulus, using a numerical rating scale (NRS) ranging from 0 (“no pain”) to 10 (“pain as bad as it could be”), with 4 denoting pinprick pain threshold. Before EEG data collection, the highest laser energy to be used in the following experiment was individually determined by increasing the stimulus energy in steps of 0.25 J, until a rating of 8 out of 10 was obtained.
EEG data were collected in two separate blocks in the same session. In each block, we used between 12 and 15 levels of laser energy (from 1 J to 3.75–4.5 J, in step of 0.25 J), and we delivered five laser pulses of each energy, for a total of 60–75 laser stimuli per block (120–150 in total). The different number of laser energy levels was due to the fixed lower limit (1 J) and the variable upper limit (3.75–4.5 J) needed to achieve a rating of 8 out of 10 in each participant. The strongest laser energy applied was, on average, 3.98 ± 0.17 J (range = 3.75–4.5 J). Before each block, the surface temperature of the hand dorsum was measured using an infrared thermometer. The order of stimulus energies was pseudorandomized, and the interstimulus interval varied randomly between 10 and 15 s using a rectangular distribution. An auditory tone delivered between 3 and 6 s after the laser pulse (rectangular distribution) prompted the subjects to rate the intensity of pain perception elicited by the laser stimulus, using the same 0–10 NRS used in the preliminary thresholding.
Experiment 2
Participants.
EEG data were collected from 96 healthy volunteers (51 females) aged 21.6 ± 1.7 years (mean ± SD, range = 17–25 years). All volunteers gave their written informed consent and were paid for their participation. The experiment procedures were approved by the local ethics committee. This dataset was already published in a previous study (Hu et al., 2014).
Nociceptive stimulation and experimental design.
The stimulation parameters and experimental settings were identical to Experiment 1, except that (1) laser pulses were directed to a larger area (5 × 5 cm2) centered on the dorsum of the left hand, and (2) four stimulus energies were used (2.5, 3, 3.5, and 4 J). A total of 40 laser pulses (10 for each energy) were delivered in pseudorandom order.
EEG recording
Participants were seated in a comfortable chair in a silent, temperature-controlled room. They wore protective goggles and were asked to focus their attention on the stimuli and relax their muscles. EEG data were recorded using 64 Ag-AgCl scalp electrodes placed according to the International 10-20 system (Brain Products GmbH; pass band: 0.01–100 Hz; sampling rate: 1000 Hz). The nose was used as reference, and impedances of all electrodes were kept <10 kΩ. Electro-oculographic (EOG) signals were simultaneously recorded using surface electrodes to monitor ocular movements and eye blinks.
EEG data analysis
Preprocessing.
EEG data were processed using EEGLAB (Delorme and Makeig, 2004), an open source toolbox running in the MATLAB (MathWorks) environment. Continuous EEG data were bandpass filtered between 1 and 30 Hz. EEG epochs were extracted using a window analysis time of 3000 ms (1000 ms prestimulus and 2000 ms poststimulus) and baseline corrected using the prestimulus interval. Trials contaminated by eye-blinks and movements were corrected using an independent component analysis algorithm (Delorme and Makeig, 2004). In all datasets, these independent components had a large EOG channel contribution and a frontal scalp distribution.
Within- and between-subject latency variability of Aδ- and C-LEPs.
For each subject, all epochs were averaged, time-locked to the stimulus onset, thus yielding one average waveform across all stimulus energies. Single-subject average waveforms were subsequently averaged to obtain group-level waveforms. Group-level scalp topographies were computed by spline interpolation. Peak latencies of Aδ-N2, Aδ-P2, C-N2, and C-P2 waves were measured from the LEP waveform (Cz-nose) of each subject, averaged not only across all trials, but also across the trials elicited by four consecutive levels of stimulus energy (i.e., E1: 1–1.75 J; E2: 2–2.75 J; E3: 3–3.75 J). The C-N2 and C-P2 latencies were compared using one-way repeated-measures ANOVA, with three levels (1–1.75, 2–2.75, and 3–3.75 J). When the main effect of the ANOVA was significant, post hoc Tukey's pairwise comparisons were performed. The Aδ-N2 and Aδ-P2 were defined as the most negative and positive deflections (biphasic) between 150 and 500 ms after stimulus onset, and the C-N2 and C-P2 were defined as the most negative and positive deflections (biphasic) between 700 and 1300 ms after stimulus onset. The reliability of the measured LEP peak latencies was validated by testing whether the global field power (GFP) within the time intervals of Aδ- and C-LEPs was significantly different from baseline activity.
To assess the between-subject latency variability of each LEP wave, the absolute differences between single-subject peak latencies and the group-average were calculated for each subject. The between-subject latency variability of the four LEP waves was compared using one-way repeated-measures ANOVA, with four levels (Aδ-N2, Aδ-P2, C-N2, C-P2). When the main effect of the ANOVA was significant, post hoc Tukey's pairwise comparisons were performed.
To minimize the between-subject latency variability of late and ultralate LEP waves, single-subject LEP waveforms averaged across all stimulus energies were adjusted by aligning the single-subject peak latencies of Aδ-N2, Aδ-P2, C-N2, and C-P2 to the peak latency of their respective averages, and then interpolating linearly the amplitudes between each pair of consecutive LEP waves. This procedure yielded one aligned LEP waveform for each subject, in which the peak latencies of Aδ-N2, Aδ-P2, C-N2, and C-P2 were identical across all subjects.
A time-frequency distribution (TFD) of the EEG time course was obtained using a windowed Fourier transform (WFT) with a fixed 250 ms Hanning window. The WFT yielded, for each time course, a complex time-frequency estimate F(t, f) at each point (t, f) of the time-frequency plane, extending from −1000 to 2000 ms (in steps of 1 ms) in the time domain, and from 1 to 30 Hz (in steps of 1 Hz) in the frequency domain. The resulting spectrogram, P(t, f) = |F(t, f)|2, represents the signal power as a joint function of time and frequency at each time-frequency point. When applied to across-trial averages of the response in the time domain, the obtained TFDs only contain brain responses phase-locked to stimulus onsets. When applied to single-trial EEG responses, the obtained TFDs contained brain responses both phase-locked and non-phase-locked to stimulus onsets (Mouraux and Iannetti, 2008).
To distinguish between phase-locked and non-phase-locked EEG responses, we calculated the phase-locking value (PLV; Lachaux et al., 1999) for each subject, as follows:
 |
where N is the number of trials.
The spectrograms and PLVs were baseline-corrected (reference interval: −800 to −200 ms relative to stimulus onset) at each frequency f, using the subtraction approach (i.e., subtracting the average of the prestimulus interval from each poststimulus time point), which avoids the positive bias introduced by the percentage approach (i.e., dividing the poststimulus values obtained at each frequency with the subtraction approach by the average of the prestimulus values at that frequency; Hu et al., 2014). The reference interval was chosen to avoid the adverse influence of spectral estimates biased by windowing poststimulus activity and padding values.
To assess the within-subject latency variability of Aδ- and C-LEPs, the mean PLVs within their respective ROIs (Aδ-LEP: ROI1, 0–500 ms and 1–10 Hz; C-LEP: ROI2, 600–1100 ms and 1–10 Hz) were calculated. For each ROI, the obtained PLVs of Aδ- and C-LEPs were compared using paired sample t test.
Relationship between stimulus intensity and amplitude of Aδ- and C-LEPs.
For each subject, the aligned single-trial LEP waveforms were averaged for each level of stimulus energy, thus yielding 12 average waveforms (from 1 to 3.75 J, in step of 0.25 J). To assess the relationship between stimulus intensity and amplitude of Aδ- and C-LEPs, peak-to-peak amplitudes of late and ultralate N2-P2 complexes at each stimulus energy were measured from the average waveforms for each subject, and compared using a 12-level, one-way repeated-measures ANOVA. When the main effect of the ANOVA was significant, post hoc Tukey's pairwise comparisons were performed. Note that we decided to measure the peak-to-peak amplitudes of both late and ultralate N2-P2 complexes to avoid the confound represented by the negative signal drift clearly visible before (and possibly during) the ultralate LEPs (Fig. 3). Such a drift can be also observed in previous studies of C-fiber responses (Ploner et al., 2002, their Fig. 3).
Figure 3.

Relationship between LEP amplitude and stimulus intensity. Left, Group-level average LEP waveforms, sorted according to stimulus intensity (from 1 to 3.75 J, in steps of 0.25 J). The time windows of the N2–P2 complex at late (100–500 ms) and ultralate (700–1100 ms) latencies are enlarged and displayed side-by-side in the top and bottom parts of this figure, respectively. Right, Amplitudes of late (top) and ultralate (bottom) N2–P2 complexes at each level of stimulus intensity. Note how the late N2–P2 amplitudes increase significantly with stimulus energies larger than 2.75 J. In contrast, the ultralate N2–P2 amplitudes increase significantly with stimulus intensity up to 2.5 J, and then plateau.
Relationship between subjective pain intensity and amplitude of Aδ- and C-LEPs.
For each subject, the aligned single-trial LEP waveforms were also averaged according to the subjective pain intensity, thus yielding nine average waveforms (rating <1; 1≤ rating <2; 2 ≤ rating <3; 3≤ rating <4; 4≤ rating <5; 5≤ rating <6; 6≤ rating <7; 7≤ rating <8; 8≤ rating). To assess the relationship between intensity of pain perception and amplitude of Aδ- and C-LEPs, N2-P2 peak-to-peak amplitudes at each level of subjective pain intensity were measured from the respective average waveform in each subject, and were respectively compared using a 9-level, one-way repeated-measures ANOVA. When the main effect of the ANOVA was significant, post hoc Tukey's pairwise comparisons were performed.
Within- and between-subject relationship between Aδ- and C-LEPs.
Due to the two distinct stimulus-response function at low- and high-energy stimuli for both Aδ- and C-LEPs, LEP responses elicited by either low-energy stimuli (1.5–2.75 J; 6 levels altogether) or high-energy stimuli (2.5–3.75 J; 6 levels altogether) were selected to assess the relationship between Aδ- and C-LEPs. For each subject, the GFP of the N2-P2 complex at late (100–500 ms) and ultralate (700–1100 ms) latencies was calculated from the aligned single-trial LEP waveforms.
To assess the within-subject relationship between Aδ- and C-LEPs, the correlation between single-trial GFPs in the late and ultralate time windows were calculated using the correlation coefficient for parametric data (Pearson's R), for each subject (Iannetti et al., 2005). To compare correlation coefficients across participants, Pearson's R were transformed to Z values. Z values were finally compared against zero using a one-sample t test (Hu et al., 2011).
To assess the between-subject relationship between Aδ- and C-LEPs, single-trial LEP waveforms were averaged across the six low (1.5–2.75 J) and high (2.5–3.75 J) stimulus energies in each subject. The GFP of the N2-P2 complex at late and ultralate time windows was calculated from the average LEP waveforms for each subject. The correlation between single-subject GFPs of Aδ- and C-LEPs were tested using the correlation coefficient for parametric data (Pearson's R; Iannetti et al., 2005).
Effect of number of stimuli on the SNR of C-LEPs.
To assess the influence of the number of stimulus repetitions on the SNR of C-LEPs, we randomly selected between 1 and 120 trials in each subject, and estimated the SNR of C-LEPs from the resulting across-trial average waveforms. The SNR was estimated by dividing the variance of the C-LEPs (700–1100 ms) by the variance of the baseline activity (−1000 to 0 ms; Debener et al., 2007; Hu et al., 2010). This procedure was repeated by permuting the EEG trials 1000 times, which yielded a probability distribution of the SNR estimate for each number of stimulus repetitions. The estimated SNR of C-LEPs for each number of stimulus repetitions was compared with that of all trials using a paired sample t test. To account for multiple comparisons, the significance level (expressed as p value) was corrected using an false discovery rate procedure (Benjamini and Hochberg, 1995).
Effect of size of stimulated area on the latency jitter of C-LEPs.
To assess the influence of the size of the area within which that the laser pulses could be directed on the latency jitter of C-LEPs, we compared the time-frequency features of laser-evoked EEG responses in Experiment 1 (in which stimuli were delivered to a 2 × 3 cm2 rectangular area) and Experiment 2 (in which stimuli were delivered to a 5 × 5 cm2 squared area). Because in Experiment 1 we used more stimulus energies than in Experiment 2, we selected the trials of Experiment 1 with the same energies (2.5, 3, 3.5, and 4 J) of Experiment 2. For both datasets, the time-frequency features of C-LEPs (TFDs of single-subject averages, TFDs of single trials, and PLVs of single trials) were obtained by calculating the mean amplitudes and phase-locking values within the “C-LEPs” ROI (ROI2: 600–1100 ms and 1–10 Hz), and normalized by subtracting the mean values within the preceding “Aδ-LEPs” ROI (ROI1: 0–500 ms and 1–10 Hz). Each of the three normalized time-frequency features were compared between Experiments 1 and 2 using an unpaired sample t test.
Results
Psychophysics
In Experiment 1, the temperature of hand dorsum in the two recording blocks was 33.1 ± 1.6°C and 33.3 ± 1.4°C (t(33) = −0.63, p = 0.45, paired sample t test). Average ratings of pain perception elicited by the laser stimuli of different energies are summarized in Table 1. One-way repeated-measures ANOVA revealed that subjective pain intensity was significantly dependent on stimulus energy (F(11,396) = 115.8, p < 0.001).
Table 1.
Subjective pain intensity and peak-to-peak amplitude (μV) of the Aδ- and C- N2-P2 LEP complex at different stimulus energies (Experiment 1)
| Stimulus energies (J) |
||||||||||||
|---|---|---|---|---|---|---|---|---|---|---|---|---|
| 1 | 1.25 | 1.5 | 1.75 | 2 | 2.25 | 2.5 | 2.75 | 3 | 3.25 | 3.5 | 3.75 | |
| Rating | 2.1 ± 1.3 | 2.5 ± 1.2 | 2.9 ± 1.3 | 3.3 ± 1.3 | 3.4 ± 1.4 | 4.0 ± 1.3 | 4.4 ± 1.3 | 4.7 ± 1.4 | 5.2 ± 1.3 | 6.0 ± 1.3 | 7.0 ± 1.5 | 7.7 ± 1.4 |
| Aδ-LEPs | 1.3 ± 3.4 | −0.02 ± 4.2 | 0.4 ± 5.5 | 1.4 ± 5.1 | 0.8 ± 4.5 | 3.3 ± 6.0 | 3.1 ± 6.6 | 7.0 ± 8.4 | 15.0 ± 15.3 | 28.4 ± 19.9 | 42.6 ± 20.6 | 52.3 ± 22.3 |
| C-LEPs | −0.04 ± 4.9 | 2.1 ± 3.9 | 1.2 ± 5.5 | 2.8 ± 5.5 | 5.1 ± 6.2 | 7.1 ± 6.7 | 10.1 ± 8.1 | 12.0 ± 7.4 | 13.0 ± 7.7 | 11.0 ± 7.8 | 11.3 ± 7.1 | 10.4 ± 6.1 |
Within- and between-subject latency variability of Aδ- and C-LEPs
Figure 1 shows the grand average LEP waveforms and the aligned LEP waveforms, together with the scalp topographies at the peak latencies of the Aδ-N2, Aδ-P2, C-N2, and C-P2 waves (Experiment 1). Single-subject average waveforms are color-coded and superimposed. The black waveform represents the group level average. Scalp topographies of all four LEP peaks were remarkably similar between original and aligned waveforms. The Aδ-N2 and C-N2 extended bilaterally toward temporal regions, whereas the Aδ-P2 and C-P2 were more centrally distributed (Fig. 1, right; Kunde and Treede, 1993; Mouraux and Iannetti, 2009). The peak latencies of Aδ-N2, Aδ-P2, C-N2, and C-P2 waves were 230 ± 27, 385 ± 40, 830 ± 92, and 974 ± 122 ms, respectively. The GFP was significantly larger than the baseline activity (i.e., 2 SDs above the mean of the baseline) within two time intervals (136–503 ms, 689–1079 ms). The observations that the N2-P2 complex of Aδ-LEPs at Cz was included in the first time interval (136–503 ms) and the N2-P2 complex of C-LEPs was included in the second time interval (689–1079 ms) confirmed the reliability of the recorded C-LEP latencies.
Figure 1.

Aδ- and C-LEPs in the time-domain. LEPs were elicited by the stimulation of the left hand dorsum, and recorded from 64 channels, in 34 participants (Experiment 1). Displayed signals were recorded from the vertex (Cz vs nose reference). Colored waveforms represent single-subject averages, whereas the black waveform is the group average across subjects. The scalp topographies of late and ultralate N2 and P2 peaks are displayed at their peak latencies. Left, LEPs waveforms averaged according to stimulus onset. Histograms in the inset show the absolute values (mean ± SD) of the differences between single-subject and group-average latency for late and ultralate N2 and P2 peaks. Note how the between-subject variability of peak latency is significantly larger for C-LEP peaks (C-N2 and C-P2) than Aδ-LEP peaks (Aδ-N2 and Aδ-P2). Right, LEPs waveforms aligned according to the peak latency of the four waves (Aδ-N2, Aδ-P2, C-N2, and C-P2; see Materials and Methods for details).
The between-subject latency variability were as follows: 22.1 ± 15.8 ms (Aδ-N2), 32.4 ± 22.8 ms (Aδ-P2), 68.6 ± 60.8 ms (C-N2), and 92.6 ± 77.3 ms (C-P2). These values were significantly different (F(3,132) = 13.8, p < 0.001; one-way repeated-measures ANOVA). Post hoc Tukey's pairwise comparisons revealed that the latency jitter was significantly smaller in the Aδ-N2 than in the C-N2 and the C-P2 (p ≤ 0.001 for both comparisons), and that the latency jitter was significantly smaller in the Aδ-P2 than in the C-N2 and the C-P2 (p = 0.02 and p < 0.001, respectively). The peak latencies of the C-N2 wave were as follows: 829 ± 123 ms (level E1: 1–1.75 J), 840 ± 95 ms (level E2: 2–2.75 J), and 830 ± 101 ms (level E3: 3–3.75 J). The peak latencies of the C-P2 wave were as follows: 950 ± 142 ms (level E1: 1–1.75 J), 966 ± 113 ms (level E2: 2–2.75 J), and 971 ± 124 ms (level E3: 3–3.75 J). Both C-N2 and C-P2 latencies were not significantly different at different stimulus energies (C-N2 latency: F(2,99) = 0.12, p = 0.89; C-P2 latency: F(2,99) = 0.27, p = 0.76; one-way repeated-measures ANOVA).
Figure 2 shows the EEG responses elicited by laser stimulation in the time and the time-frequency domains (Cz-nose; Experiment 1). Figure 2, top, left, shows the grand average LEP waveforms in the time domain, characterized by a large late N2-P2 complex and a smaller ultralate N2-P2 complex. Figure 2, top, right, shows the group-level average of the TFDs obtained from the single-subject average LEPs. Figure 2, bottom, left, shows the group-level average of the TFDs obtained from single-trial LEPs. Both spectrograms contained clear responses at 0–500 ms and 1–10 Hz (ROI1), as well as at 600–1100 ms and 1- 10 Hz (ROI2). These time-frequency responses correspond to the late and ultralate N2-P2 complexes in the time domain (Fig. 2, top, left). Figure 2, bottom, right, shows the group-level PLVs, which indicate that both Aδ- and C-LEP responses are phase-locked to stimulus onset. The mean PLVs of Aδ-LEPs (ROI1: 0.15 ± 0.07) were significantly larger than C-LEPs (ROI2: 0.08 ± 0.05; t(33) = 5.53, p < 0.001; paired sample t test), a finding confirming that the within-subject latency variability was significantly smaller in Aδ-LEPs than in C-LEPs.
Figure 2.

Aδ- and C-LEPs in the time-frequency domain. Laser-evoked EEG responses were elicited by the stimulation of the left hand dorsum, and recorded from 64 channels, in 34 participants (Experiment 1). Displayed signals were recorded from the vertex (Cz vs nose reference). Top, Left, LEP waveforms in the time-domain. Colored waveforms represent single-subject averages, whereas the black waveform is the group average across subjects. Top, Right, Group-level average of the TFDs obtained from single-subject average LEPs. Bottom, Left, Group-level average of the TFDs obtained from single-trial LEPs. Bottom, Right, Group-level average of PLVs obtained from single-trial LEPs. Note that the within-subject latency variability of LEP responses, assessed using the PLVs, is significantly larger in C-LEPs (ROI2: 600–1100 ms and 1–10 Hz) than in Aδ-LEPs (ROI1: 0–500 ms and 1–10 Hz).
Relationship between stimulus intensities and amplitudes of Aδ- and C-LEPs
Figure 3 shows the average LEP waveforms for each level of stimulus energy, color-coded and superimposed (Experiment 1). The average peak-to-peak amplitude of the late N2-P2 complex of the LEP elicited by stimuli of different energies are plotted in Figure 3, top, right, and summarized in Table 1. The average peak-to-peak amplitude of the ultralate N2-P2 complex of the LEP elicited by stimuli of different energies are plotted in the Figure 3, bottom, right, and summarized in Table 1. Peak-to-peak amplitude of both late and ultralate N2-P2 complexes was significantly dependent on stimulus energy (late: F(11,396) = 74.7, p < 0.001; ultralate: F(11,396) = 17.9, p < 0.001; one-way repeated-measures ANOVA; Figure 3, right). Note how the late N2-P2 amplitudes increased significantly with stimulus energies >2.75 J. In contrast, the ultralate N2-P2 amplitudes increased significantly with stimulus intensity up to energy of 2.5 J, and then plateau.
Relationship between intensities of pain and amplitudes of Aδ- and C-LEPs
Figure 4 shows the average LEP waveforms for each level of subjective pain intensity, color-coded and superimposed (Experiment 1). The average peak-to-peak amplitude of the late N2-P2 complex of the LEP for different pain perception intensities are plotted in Figure 4, top, right, and summarized in Table 2. The average peak-to-peak amplitude of the ultralate N2-P2 complex of the LEP for different pain perception intensities are plotted in Figure 4, bottom, right, and summarized in Table 2. Peak-to-peak amplitude of both late and ultralate N2-P2 complexes was significantly dependent on subjective pain intensity (late: F(8,297) = 45.7, p < 0.001; ultralate: F(8,297) = 9.1, p < 0.001; one-way repeated-measures ANOVA; Fig. 4, right). Note how the late N2-P2 amplitudes increased significantly only when the subjective pain intensity was larger than 5. In contrast, the ultralate N2-P2 amplitudes increased significantly up to a subjective pain intensity of 5.
Figure 4.

Relationship between LEP amplitude and subjective pain intensity. Left, Group-level average LEP waveforms, sorted according to perceived pain intensity (from 0 to 10, in steps of 1). The time windows of the N2–P2 complex at late (100–500 ms) and ultralate (700–1100 ms) latencies are enlarged and displayed side-by-side in the top and bottom parts of this figure, respectively. Right, Amplitudes of late (top) and ultralate (bottom) N2–P2 complexes at each level of perceived pain intensity. Note how the late N2–P2 amplitudes increase significantly when the subjective pain intensity is larger than 5. In contrast, the ultralate N2–P2 amplitudes increase significantly up to the subjective pain intensity of 5.
Table 2.
Peak-to-peak amplitude (μV) of the Aδ- and C- N2-P2 LEP complex at different subjective pain intensities (Experiment 1)
| Pain perception intensities |
|||||||||
|---|---|---|---|---|---|---|---|---|---|
| Rating <1 | 1≤ Rating <2 | 2≤ Rating <3 | 3≤ Rating <4 | 4≤ Rating <5 | 5≤ Rating <6 | 6≤ Rating <7 | 7≤ Rating <8 | 8 ≤Rating | |
| Aδ-LEPs | 4.3 ± 7.4 | 1.9 ± 6.2 | 1.9 ± 5.5 | 2.3 ± 3.9 | 4.6 ± 9.8 | 16.5 ± 18.4 | 26.5 ± 23.6 | 41.1 ± 26.2 | 57.2 ± 24.0 |
| C-LEPs | 0.5 ± 7.8 | 1.8 ± 5.9 | 1.8 ± 8.8 | 4.1 ± 4.9 | 6.5 ± 6.2 | 8.4 ± 6.6 | 9.5 ± 6.0 | 9.8 ± 7.0 | 9.6 ± 7.2 |
Within- and between-subject relationships between Aδ- and C-LEPs
The top panels of Figure 5 shows the average LEP waveforms elicited by stimuli at the six low and high energies (Experiment 1). At within-subject level, whereas in the response elicited by the six high energies there was a significant negative correlation between single-trial GFPs of the N2-P2 complex at late and ultralate latencies (mean r = −0.093 ± 0.194, t(33) = −2.77, p = 0.009; one-sample t test; Fig. 5, middle, right), in those elicited by the six low energies there was a significant positive correlation between single-trial GFPs of the N2-P2 complex at late and ultralate latencies (mean r = 0.053 ± 0.133, t(33) = 2.30, p = 0.028; one-sample t test; Fig. 5, middle, left). In contrast, in the response elicited by either the six low- or the six high-energies there was no significant between-subject correlation between GFPs of the N2-P2 complex at late and ultralate latencies (low-energies: r = 0.099, p = 0.58; high-energies: r = 0.067, p = 0.71; Fig. 5, bottom).
Figure 5.

The relationship between Aδ- and C-LEPs at within- and between-subject levels. Top, Aligned LEP waveforms at low (1.5–2.75 J; left) and high (2.5–3.75 J; right) stimulus intensities are color-coded and superimposed. N2–P2 complex at late (100–500 ms) and ultralate (700–1100 ms) latencies at each level of stimulus intensity are highlighted by gray bars. Middle, Significant within-subject correlation is observed between GFPs of N2–P2 complex at late and ultralate latencies (low-energies: mean r = 0.053 ± 0.133, t(33) = 2.30, p = 0.028; high-energies: mean r = −0.093 ± 0.194, t(33) = −2.77, p = 0.009). Each red dot represents the value measured from a single trial of a representative subject. Black solid line represents the best linear fit. Bottom, Lack of significant across-subject correlation between GFPs of N2–P2 complex at late and ultralate latencies (low-energies: r = 0.099, p = 0.58; high-energies: r = 0.067, p = 0.71). Each colored dot represents a single subject.
Effect of number of stimuli on the SNR of C-LEPs
The SNR of C-LEPs was markedly enhanced when the number of stimulus repetitions was increased (e.g., 1 trial: SNR = 1.95 ± 1.65; 30 trials: SNR = 5.08 ± 5.86; all trials: SNR = 9.58 ± 9.84; Fig. 6, bottom; Experiment 1). Compared with C-LEPs averaged across all trials, the SNR of C-LEPs averaged across <79 trials was significantly reduced (t(33) > 2.84, pfdr < 0.05, paired sample t test; Fig. 6, bottom). When a small number of stimuli were delivered (e.g., 30 trials), C-LEPs, albeit possibly present, were hard to be identified due to low SNR (Fig. 6, top).
Figure 6.

Effect of number of stimuli on the SNR of C-LEPs. Top, LEP waveforms obtained averaging 30 randomly selected trials (left) and all trials (right) of a representative subject. Green and red denote Aδ- and C-LEPs, respectively. Circles and squares denote N2 and P2 peaks, respectively. The red question mark shows an unclear C-LEP response. Bottom, SNR of the C-LEPs is markedly enhanced when the number of stimulus repetitions is increased. The SNR of the C-LEP obtained averaging all trials is significantly higher than the SNR of C-LEPs obtained averaging <79 trials (t(33) > 2.84, pfdr < 0.05, paired sample t test).
Effect of size of stimulated area on the latency jitter of C-LEPs
The normalized PLVs of single-trial C-LEPs (Fig. 7, bottom row) were significantly larger in Experiment 1 than in Experiment 2 (−0.093 ± 0.099 vs −0.14 ± 0.11; t(128) = 2.20, p = 0.027, unpaired sample t test). This finding indicated that the larger the stimulated area, the larger the C-LEP latency jitter. As expected, the TFDs of single-subject averages and the TFDs of single trials were not significantly different between Experiments 1 and 2 (single-subject TFDs: −2.65 ± 2.67 vs −3.90 ± 3.55, t(128) = 1.83, p = 0.07; single-trial TFDs: −5.63 ± 4.31 vs −6.92 ± 4.88, t(128) = 1.32, p = 0.18, unpaired sample t test).
Figure 7.
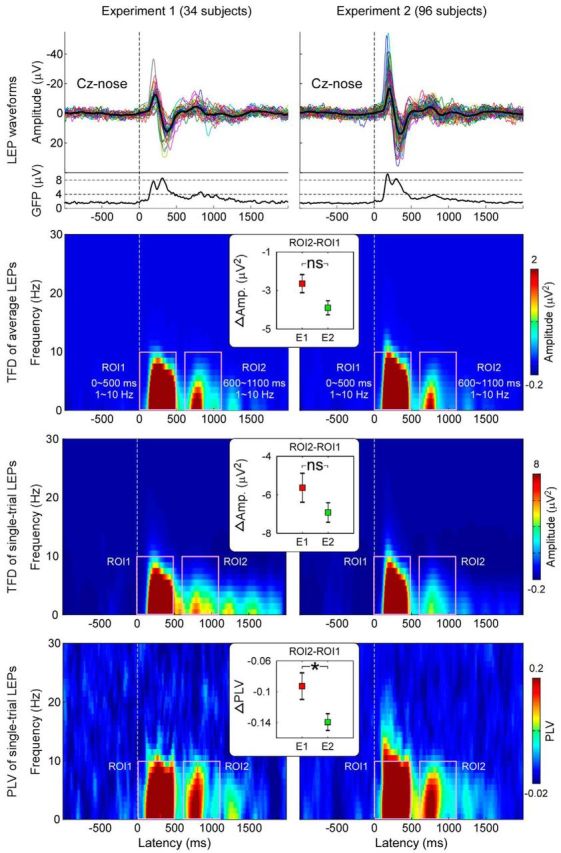
Effect of size of stimulated area on the latency jitter of C-LEPs. In Experiment 1 (34 participants, left), laser pulses were delivered to a 2 × 3 cm2 rectangular area, whereas in Experiment 2 (96 participants, right), they were delivered to a 5 × 5 cm2 squared area. LEP waveforms in the time-domain, TFDs of single-subject averages, TFDs of single trials, and PLVs of single trials are displayed from top to bottom. Note that normalized PLVs of C-LEPs (ROI2–ROI1) are significantly larger in Experiment 1 than in Experiment 2, indicating that the larger the stimulated area, the larger the C-LEP latency jitter.
Discussion
By applying advanced signal processing techniques to two large multichannel EEG datasets (34 and 96 volunteers), we quantified several properties of the brain response related to the activation of C-fiber nociceptive afferents (C-LEPs). First, latency jitter was significantly larger in C-LEPs than Aδ-LEPs, both within- and between-subjects (Figs. 1, 2). Second, the C-LEP latency jitter was significantly reduced when the size of stimulated area was decreased (Fig. 7). Third, amplitudes of Aδ- and C-LEPs were differentially dependent on stimulus intensity, as well as on subjective pain perception (Figs. 3, 4). Fourth, at within-subject level, there was a significant negative correlation between Aδ- and C-LEP amplitudes at high energies, but positive correlation at low-energies (Fig. 5). Fifth, the SNR of C-LEPs was markedly enhanced when the stimulus was repeated up to 80 times (Fig. 6).
Based on these response properties, we defined the optimal stimulus parameters to elicit a clearly detectable C-LEPs in most single participants. Importantly, C-LEPs were observed even when preceded by Aδ-LEPs, both in average waveforms (Figs. 1, 2, 8) and single-trial waveforms (Fig. 5). This approach is simple, robust, and does not require the previously suggested laborious methods to activate C-fibers in isolation. These findings have important implications in the assessment of small-fiber function in neuropathies and neuropathic pain.
Figure 8.

Aδ- and C-LEPs in each of the 34 participants of Experiment 1. Displayed signals were recorded from the vertex (Cz vs nose reference). For each of the 34 participants, LEP waveforms are averaged across trials in the time domain. Green and red denote Aδ- and C-LEP responses, respectively. Circles and squares denote N2 and P2 peaks, respectively. Unclear C-LEP responses are highlighted with red question marks.
Can C-LEPs be detected only when activation of Aδ-nociceptors is avoided?
A reliable detection of C-fiber LEPs is highly needed in both basic and clinical neuroscience (Plaghki and Mouraux, 2003; Haanpää et al., 2011). Therefore, in the past three decades a large effort has been devoted to devise stimulation techniques to reliably measure C-LEPs in humans. However, such effort has not yielded the longed result, and the descriptions of C-LEP recordings are sparse, inconsistent, and, therefore, not easily applicable to the clinical arena. The only coherent observation so far is that C-LEPs are more easily recorded when C-nociceptors are activated selectively, i.e., when the concomitant activation of Aδ-nociceptors is avoided or reduced (Bromm and Treede, 1983; Cruccu et al., 2003; Treede et al., 2003).
Indeed, it has been reported that C-LEPs can be recorded either in patients lacking myelinated afferents (Treede et al., 1988a; Lankers et al., 1991; Cruccu et al., 2003) or in healthy subjects using elegant but sophisticated techniques that avoid the activation of Aδ-fibers by exploiting the different physiological properties of Aδ- and C-nociceptors (Towell et al., 1996; Magerl et al., 1999). These techniques include using laser beams of extremely small diameters to exploit the higher density of C-fibers than Aδ-fibers (Bragard et al., 1996), performing a nerve compression block to exploit the higher resistance of C-fibers to ischemia (Bromm et al., 1983), adjusting the stimulus intensity to exploit the lower heat threshold of C-fibers than Aδ-fibers (Magerl et al., 1999; Jankovski et al., 2013). Importantly, all these approaches (1) are complex and difficult to implement, and (2) yield a weak C-fiber input (because of, e.g., stimulation of few afferent at low-energies), resulting in C-LEPs of low SNR.
Here we show that this notion is not true, and that C-LEPs can be reliably recorded without using the techniques described above. The reliability of our approach is confirmed by the following two observations: (1) C-LEP amplitude was significantly larger at high stimulus energies (>2.5 J) than at low stimulus energies (<2.5 J), and (2) both C-N2 and C-P2 latencies were independent of stimulus energy (i.e., their presence was independent of the activation of Aδ-fibers). As a matter of fact, we show that a C-LEP is clearly present even when preceded by an Aδ-LEP, and that Aδ- and C-LEPs can coexist in the same single trial (Experiments 1 and 2; Figs. 1–4, 8). This observation, although in contradiction with most of the previous literature on the topic, is not surprising when considering both the physiological properties of Aδ- and C-nociceptors and the main determinants of the LEP amplitude.
Indeed, when Aδ- and C-nociceptors are concomitantly activated by a single laser pulse, because of the slower conduction velocity of C (∼1 m/s) versus Aδ afferents (∼10 m/s), the C-related prolonged burning sensation always follows the initial Aδ-related pricking pain by a constant interval (Lewis and Pochin, 1937). Thus, the C-input has both a lower intensity and a higher temporal predictability than the preceding Aδ-input, and both factors are known to reduce the amplitude of the LEP response (Wang et al., 2010; Ronga et al., 2013). Thus, it makes physiological sense that a C-LEP response is larger when the C-input is not preceded by a (1) stronger and (2) time-locked Aδ-input. This observation provides strong support to the notion that also C-LEPs largely reflect saliency-related neural processes possibly related to the detection of relevant changes in the sensory environment (Downar et al., 2000). However, when laser stimuli are repeated at short and constant interval of 900 ms (Bromm and Treede, 1987a) or 1000 ms (Iannetti et al., 2008; i.e., intervals similar to that between the Aδ-related first pain and the C-related second pain), they are still salient enough to capture attention and elicit a cortical response, even when the preceding stimuli are identical (Iannetti et al., 2008; Valentini et al., 2011) or even stronger (Ronga et al., 2013). For these reasons it is not surprising that a clear C-LEP is detected even when the C-input is preceded by the Aδ-input (Figs. 1, 2, 8).
It is interesting to note that at high stimulus intensities (2.5–3.75 J) there was a significant intraindividual negative correlation between the GFPs of N2-P2 complex at Aδ- and C-latencies (Fig. 5). This negative correlation can be parsimoniously explained by the reduced saliency of the C-input when it is preceded by a stronger Aδ-input (Iannetti et al., 2008). In contrast, at low stimulus intensities (1.5–2.75 J) there was a significant intraindividual positive correlation between the GFPs of N2-P2 complex at Aδ and C latencies. This observation confirms the concomitant activation of Aδ- and C-nociceptors, thus providing additional support to the notion that C-LEPs can be observed even when preceded by Aδ-LEPs, both in average waveforms and single trials (Fig. 5).
Effect of stimulated area on C-LEP detectability
We observed that the latency jitter is significantly larger in C-LEPs than in Aδ-LEPs, by ∼150% between-subjects and by ∼100% within-subjects (Experiment 1; Figs. 1, 2). This indicates that both across-trial and across-subject averaging result in severe distortions of C-LEPs and, therefore, in their amplitude reduction. Several strategies have been proposed to reduce such nuisance: manually correction of response latency (Bromm and Treede, 1987b), spectral analysis of the expected time-window (Arendt-Nielsen, 1990), and time-frequency analysis (Mouraux et al., 2003). However, all these approaches can minimize the influence of latency jitter on the detection of C-LEPs, but do not reduce their latency jitter per se. Therefore, an important solution would be to reduce the jitter, instead of correct it a posteriori. Given the slow and variable conduction velocity of C-fibers (Torebjörk and Hallin, 1974), changes of just 1 cm in their length would result in latency shifts of 10 ms. Traditionally, LEPs are recorded shifting randomly the laser beam within a large area (e.g., 5 × 5 cm2) of the hand or foot dorsum, which likely introduces a significant amount of response jitter.
Here, we quantified the reduction of latency jitter as a function of the stimulated area. Delivering laser pulses on a smaller area (2 × 3 cm2, Experiment 1) reduced the jitter by ∼50% compared with a larger area (5 × 5 cm2, Experiment 2; Fig. 7). This indicates that delivering laser pulses on a relatively small area dramatically enhances the likelihood of detecting C-LEPs. Indeed, a C-LEP was present in most participants when stimuli were delivered to small areas (33/34, Experiment 1; Fig. 8), but only in 71/96 participants when stimuli were delivered to larger areas (Experiment 2).
Effect of stimulus repetitions on C-LEP SNR
The SNR of C-LEPs was strongly dependent on the number of stimulus repetitions, with a steady SNR increase until ∼80 stimuli (Experiment 1; Fig. 6). This figure should represent the minimum number of repetitions needed to elicit clear C-LEPs when using the parameters of Experiment 1. Given that the SNR improvement as a function of stimulus repetition is also dependent on the latency jitter (Luck, 2005), this figure should be significantly increased when stimuli are delivered to a larger skin area.
Dependency of C-LEPs on stimulus energy and subjective perception
By using a wide range of stimulus energies (12–15) we provide the first fine-grained description of stimulus-response and percept-response functions of Aδ-LEPs and C-LEPs (Figs. 3, 4). Aδ-LEP and C-LEP amplitudes complementary covered the entire spectrum of the energies applied and of the sensation elicited (Figs. 3, 4). C-LEPs started to be observed at the lowest energies, and increased monotonically with both stimulus energy and perceived intensity, until 2.75 J or pricking pain threshold. Above these points, the C-LEP amplitude plateaued and did not increase further, and Aδ-LEPs started to be detected and increased monotonically until the highest energies delivered and the strongest sensations elicited. These stimulus-response functions are strikingly similar to the recruitment curves of Aδ- and C-nociceptors in monkeys (Treede et al., 1994; Bromm and Lorenz, 1998), indicating that the intensity-dependent features of Aδ- and C-LEPs mainly reflect the different physiological properties of Aδ- and C-fibers, as well as their clearly different activation threshold. This result has one important practical implication: stimulus energies should be chosen depending on the physiological (or clinical) objective. Indeed, to record C-LEPs with maximal SNR, only stimuli around the pinprick threshold should be employed. Instead, to obtain a stimulus-response curve reflecting the function of C-fiber pathways, graded stimuli from detection up to pinprick threshold should be used.
Notes
Supplemental material for this article is available at http://iannettilab.webnode.com/products/supplementary-materials/. Supplemental materials contain results showing: (1) the reliability of recorded C-LEP latencies, (2) the relationship between stimulus energy and amplitudes of Aδ- and C-LEPs, (3) the coexistence of Aδ- and C-LEPs in single trials, and (4) the effect of waveform alignment on LEPs. In addition, they contain a summary of post hoc comparisons of subjective pain intensity, peak-to-peak amplitude of Aδ and C N2-P2 complexes at different stimulus energies and pain intensities. This material has not been peer reviewed.
Footnotes
L.H. is supported by the National Natural Science Foundation of China (31200856), Natural Science Foundation Project of Chongqing Science and Technology Commission (CQ CSTC), Fundamental Research Funds for the Central Universities (SWU1409105), and Key Laboratory of Mental Health, Institute of Psychology, Chinese Academy of Sciences; G.D.I. is a University Research Fellow of The Royal Society; the collaboration between L.H. and G.D.I. is generously supported by the IASP Developed-Developing Countries Collaborative Research Grant.
The authors declare no competing financial interests.
References
- Arendt-Nielsen L. Second pain event related potentials to argon laser stimuli: recording and quantification. J Neurol Neurosurg Psychiatry. 1990;53:405–410. doi: 10.1136/jnnp.53.5.405. [DOI] [PMC free article] [PubMed] [Google Scholar]
- Basbaum AI, Bushnell MC. Science of pain. Oxford: Academic; 2009. [Google Scholar]
- Baumgärtner U, Cruccu G, Iannetti GD, Treede RD. Laser guns and hot plates. Pain. 2005;116:1–3. doi: 10.1016/j.pain.2005.04.021. [DOI] [PubMed] [Google Scholar]
- Benjamini Y, Hochberg Y. Controlling the false discovery rate: a practical and powerful approach to multiple testing. J Roy Stat Soc B Met. 1995;57:289–300. [Google Scholar]
- Bragard D, Chen AC, Plaghki L. Direct isolation of ultra-late (C-fibre) evoked brain potentials by CO2 laser stimulation of tiny cutaneous surface areas in man. Neurosci Lett. 1996;209:81–84. doi: 10.1016/0304-3940(96)12604-5. [DOI] [PubMed] [Google Scholar]
- Bromm B, Lorenz J. Neurophysiological evaluation of pain. Electroencephalogr Clin Neurophysiol. 1998;107:227–253. doi: 10.1016/S0013-4694(98)00075-3. [DOI] [PubMed] [Google Scholar]
- Bromm B, Treede RD. CO2 laser radiant heat pulses activate C nociceptors in man. Pflugers Arch. 1983;399:155–156. doi: 10.1007/BF00663913. [DOI] [PubMed] [Google Scholar]
- Bromm B, Treede RD. Nerve fibre discharges, cerebral potentials and sensations induced by CO2 laser stimulation. Hum Neurobiol. 1984;3:33–40. [PubMed] [Google Scholar]
- Bromm B, Treede RD. Human cerebral potentials evoked by CO2 laser stimuli causing pain. Exp Brain Res. 1987a;67:153–162. doi: 10.1007/BF00269463. [DOI] [PubMed] [Google Scholar]
- Bromm B, Treede RD. Pain related cerebral potentials: late and ultralate components. Int J Neurosci. 1987b;33:15–23. doi: 10.3109/00207458708985926. [DOI] [PubMed] [Google Scholar]
- Bromm B, Neitzel H, Tecklenburg A, Treede RD. Evoked cerebral potential correlates of C-fibre activity in man. Neurosci Lett. 1983;43:109–114. doi: 10.1016/0304-3940(83)90137-4. [DOI] [PubMed] [Google Scholar]
- Cruccu G, Pennisi E, Truini A, Iannetti GD, Romaniello A, Le Pera D, De Armas L, Leandri M, Manfredi M, Valeriani M. Unmyelinated trigeminal pathways as assessed by laser stimuli in humans. Brain. 2003;126:2246–2256. doi: 10.1093/brain/awg227. [DOI] [PubMed] [Google Scholar]
- Debener S, Strobel A, Sorger B, Peters J, Kranczioch C, Engel AK, Goebel R. Improved quality of auditory event-related potentials recorded simultaneously with 3-T fMRI: removal of the ballistocardiogram artefact. Neuroimage. 2007;34:587–597. doi: 10.1016/j.neuroimage.2006.09.031. [DOI] [PubMed] [Google Scholar]
- Delorme A, Makeig S. EEGLAB: an open source toolbox for analysis of single-trial EEG dynamics including independent component analysis. J Neurosci Methods. 2004;134:9–21. doi: 10.1016/j.jneumeth.2003.10.009. [DOI] [PubMed] [Google Scholar]
- Downar J, Crawley AP, Mikulis DJ, Davis KD. A multimodal cortical network for the detection of changes in the sensory environment. Nat Neurosci. 2000;3:277–283. doi: 10.1038/72991. [DOI] [PubMed] [Google Scholar]
- Haanpää M, Attal N, Backonja M, Baron R, Bennett M, Bouhassira D, Cruccu G, Hansson P, Haythornthwaite JA, Iannetti GD, Jensen TS, Kauppila T, Nurmikko TJ, Rice AS, Rowbotham M, Serra J, Sommer C, Smith BH, Treede RD. NeuPSIG guidelines on neuropathic pain assessment. Pain. 2011;152:14–27. doi: 10.1016/j.pain.2010.07.031. [DOI] [PubMed] [Google Scholar]
- Hu L, Mouraux A, Hu Y, Iannetti GD. A novel approach for enhancing the signal-to-noise ratio and detecting automatically event-related potentials (ERPs) in single trials. Neuroimage. 2010;50:99–111. doi: 10.1016/j.neuroimage.2009.12.010. [DOI] [PubMed] [Google Scholar]
- Hu L, Liang M, Mouraux A, Wise RG, Hu Y, Iannetti GD. Taking into account latency, amplitude and morphology: improved estimation of single-trial ERPs by wavelet filtering and multiple linear regression. J Neurophysiol. 2011;106:3216–3229. doi: 10.1152/jn.00220.2011. [DOI] [PMC free article] [PubMed] [Google Scholar]
- Hu L, Xiao P, Zhang ZG, Mouraux A, Iannetti GD. Single-trial time-frequency analysis of electrocortical signals: baseline correction and beyond. Neuroimage. 2014;84:876–887. doi: 10.1016/j.neuroimage.2013.09.055. [DOI] [PubMed] [Google Scholar]
- Iannetti GD, Truini A, Romaniello A, Galeotti F, Rizzo C, Manfredi M, Cruccu G. Evidence of a specific spinal pathway for the sense of warmth in humans. J Neurophysiol. 2003;89:562–570. doi: 10.1152/jn.00393.2002. [DOI] [PubMed] [Google Scholar]
- Iannetti GD, Zambreanu L, Cruccu G, Tracey I. Operculoinsular cortex encodes pain intensity at the earliest stages of cortical processing as indicated by amplitude of laser-evoked potentials in humans. Neuroscience. 2005;131:199–208. doi: 10.1016/j.neuroscience.2004.10.035. [DOI] [PubMed] [Google Scholar]
- Iannetti GD, Zambreanu L, Tracey I. Similar nociceptive afferents mediate psychophysical and electrophysiological responses to heat stimulation of glabrous and hairy skin in humans. J Physiol. 2006;577:235–248. doi: 10.1113/jphysiol.2006.115675. [DOI] [PMC free article] [PubMed] [Google Scholar]
- Iannetti GD, Hughes NP, Lee MC, Mouraux A. Determinants of laser-evoked EEG responses: pain perception or stimulus saliency? J Neurophysiol. 2008;100:815–828. doi: 10.1152/jn.00097.2008. [DOI] [PMC free article] [PubMed] [Google Scholar]
- Jankovski A, Plaghki L, Mouraux A. Reliable EEG responses to the selective activation of C-fibre afferents using a temperature-controlled infrared laser stimulator in conjunction with an adaptive staircase algorithm. Pain. 2013;154:1578–1587. doi: 10.1016/j.pain.2013.04.032. [DOI] [PubMed] [Google Scholar]
- Kunde V, Treede RD. Topography of middle-latency somatosensory evoked potentials following painful laser stimuli and non-painful electrical stimuli. Electroencephalogr Clin Neurophysiol. 1993;88:280–289. doi: 10.1016/0168-5597(93)90052-Q. [DOI] [PubMed] [Google Scholar]
- Lachaux JP, Rodriguez E, Martinerie J, Varela FJ. Measuring phase synchrony in brain signals. Hum Brain Mapp. 1999;8:194–208. doi: 10.1002/(SICI)1097-0193(1999)8:4<194::AID-HBM4>3.0.CO;2-C. [DOI] [PMC free article] [PubMed] [Google Scholar]
- Lankers J, Frieling A, Kunze K, Bromm B. Ultralate cerebral potentials in a patient with hereditary motor and sensory neuropathy type I indicate preserved C-fibre function. J Neurol Neurosurg Psychiatry. 1991;54:650–652. doi: 10.1136/jnnp.54.7.650. [DOI] [PMC free article] [PubMed] [Google Scholar]
- Lewis T, Pochin EE. The double pain response of the human skin to a single stimulus. Clin Sci. 1937;3:37–67. [Google Scholar]
- Luck SJ. An introduction to the event-related potential technique. Cambridge: MIT; 2005. [Google Scholar]
- Magerl W, Ali Z, Ellrich J, Meyer RA, Treede RD. C- and Aδ-fiber components of heat-evoked cerebral potentials in healthy human subjects. Pain. 1999;82:127–137. doi: 10.1016/S0304-3959(99)00061-5. [DOI] [PubMed] [Google Scholar]
- Mouraux A, Iannetti GD. Across-trial averaging of event-related EEG responses and beyond. Magn Reson Imaging. 2008;26:1041–1054. doi: 10.1016/j.mri.2008.01.011. [DOI] [PubMed] [Google Scholar]
- Mouraux A, Iannetti GD. Nociceptive laser-evoked brain potentials do not reflect nociceptive-specific neural activity. J Neurophysiol. 2009;101:3258–3269. doi: 10.1152/jn.91181.2008. [DOI] [PubMed] [Google Scholar]
- Mouraux A, Guérit JM, Plaghki L. Non-phase locked electroencephalogram (EEG) responses to CO2 laser skin stimulations may reflect central interactions between A partial partial differential- and C-fibre afferent volleys. Clin Neurophysiol. 2003;114:710–722. doi: 10.1016/S1388-2457(03)00027-0. [DOI] [PubMed] [Google Scholar]
- Plaghki L, Mouraux A. How do we selectively activate skin nociceptors with a high power infrared laser? Physiology and biophysics of laser stimulation. Neurophysiol Clin. 2003;33:269–277. doi: 10.1016/j.neucli.2003.10.003. [DOI] [PubMed] [Google Scholar]
- Ploner M, Gross J, Timmermann L, Schnitzler A. Cortical representation of first and second pain sensation in humans. Proc Natl Acad Sci U S A. 2002;99:12444–12448. doi: 10.1073/pnas.182272899. [DOI] [PMC free article] [PubMed] [Google Scholar]
- Ronga I, Valentini E, Mouraux A, Iannetti GD. Novelty is not enough: laser-evoked potentials are determined by stimulus saliency, not absolute novelty. J Neurophysiol. 2013;109:692–701. doi: 10.1152/jn.00464.2012. [DOI] [PMC free article] [PubMed] [Google Scholar]
- Torebjörk HE, Hallin RG. Identification of afferent C units in intact human skin nerves. Brain Res. 1974;67:387–403. doi: 10.1016/0006-8993(74)90489-2. [DOI] [PubMed] [Google Scholar]
- Towell AD, Purves AM, Boyd SG. CO2 laser activation of nociceptive and non-nociceptive thermal afferents from hairy and glabrous skin. Pain. 1996;66:79–86. doi: 10.1016/0304-3959(96)03016-3. [DOI] [PubMed] [Google Scholar]
- Treede RD, Cole JD. Dissociated secondary hyperalgesia in a subject with a large-fibre sensory neuropathy. Pain. 1993;53:169–174. doi: 10.1016/0304-3959(93)90077-3. [DOI] [PubMed] [Google Scholar]
- Treede RD, Meier W, Kunze K, Bromm B. Ultralate cerebral potentials as correlates of delayed pain perception: observation in a case of neurosyphilis. J Neurol Neurosurg Psychiatry. 1988a;51:1330–1333. doi: 10.1136/jnnp.51.10.1330. [DOI] [PMC free article] [PubMed] [Google Scholar]
- Treede RD, Kief S, Hölzer T, Bromm B. Late somatosensory evoked cerebral potentials in response to cutaneous heat stimuli. Electroencephalogr Clin Neurophysiol. 1988b;70:429–441. doi: 10.1016/0013-4694(88)90020-X. [DOI] [PubMed] [Google Scholar]
- Treede RD, Meyer RA, Lesser RP. Similarity of threshold temperatures for first pain sensation, laser-evoked potentials and nociceptor activation. In: Gebhart GF, Hammond DL, Jensen TS, editors. Proceedings of the 7th World Congress on pain; Seattle: IASP; 1994. pp. 857–865. [Google Scholar]
- Treede RD, Lorenz J, Baumgärtner U. Clinical usefulness of laser-evoked potentials. Neurophysiol Clin. 2003;33:303–314. doi: 10.1016/j.neucli.2003.10.009. [DOI] [PubMed] [Google Scholar]
- Valentini E, Torta DM, Mouraux A, Iannetti GD. Dishabituation of laser-evoked EEG responses: dissecting the effect of certain and uncertain changes in stimulus modality. J Cogn Neurosci. 2011;23:2822–2837. doi: 10.1162/jocn.2011.21609. [DOI] [PubMed] [Google Scholar]
- Wang AL, Mouraux A, Liang M, Iannetti GD. Stimulus novelty, and not neural refractoriness, explains the repetition suppression of laser-evoked potentials. J Neurophysiol. 2010;104:2116–2124. doi: 10.1152/jn.01088.2009. [DOI] [PubMed] [Google Scholar]