

This study provides an updated birth weight reference by using a more reliable GA estimate and reflects the current sociodemographic composition of the United States.
Abstract
OBJECTIVE:
To provide an updated birth weight–for–gestational age (BW-for-GA) reference in the United States by using the most recent, nationally representative birth data with obstetric estimates of gestational age (GA).
METHODS:
We abstracted 3 285 552 singleton births between 22 and 42 weeks’ gestation with nonmissing race and/or ethnicity, infant sex, parity, birth weight, and obstetric estimate of GA from the 2017 US natality files. We used 2 techniques (nonlinear, resistant smoothing [4253H] and lambda-mu-sigma) to derive smoothed BW-for-GA curves and compared resulting BW-for-GA cut-points at the third, 10th, 90th, and 97th percentiles with US references from 1999 to 2009.
RESULTS:
The smoothed BW-for-GA curves from both techniques overlapped considerably with each other, with strong agreements seen between the 2 techniques (>99% agreement; κ-statistic >0.9) for BW-for-GA cut-points at the third, 10th, 90th, and 97th percentiles across all GAs. Cut-points from 2017 using the lambda-mu-sigma method captured 9.8% to 10.2% of births <10th and >90th percentiles and 2.6% to 3.3% of births below the third and above the 97th percentile across all GAs. However, cut-points from US references in 1999 and 2009 (when GA was based on last menstrual period) captured a much larger range of proportions of 2017 births at these thresholds, especially among preterm and postterm GA categories.
CONCLUSIONS:
We have provided an updated BW-for-GA reference in the United States using the most recent births with obstetric estimates of GA and information to calculate continuous measures of birth size that are sex or parity specific.
What’s Known on This Subject:
Previous birth weight–for–gestational age references in the United States primarily incorporated gestational age estimated from maternal reports of last menstrual period rather than more accurate estimates and may not reflect the current sociodemographic composition of the United States.
What This Study Adds:
We have provided an updated birth weight–for–gestational age reference that uses the most recent birth data in the United States with obstetric estimates of gestational age and information to calculate continuous measures of birth size that are sex or parity specific.
Fetal growth, typically measured as birth weight for gestational age (BW-for-GA), is an important clinical indicator of perinatal morbidity, survival, and long-term health outcomes in children and their mothers.1 Clinicians often use percentile thresholds (eg, ≤10th or ≥90th) of BW-for-GA from population-based references to identify at-risk infants who may have had restricted or excessive fetal growth. Additionally, researchers are increasingly making use of fetal growth measures on the continuous scale (ie, BW-for-GA z scores) to inform their studies examining predictors of fetal growth or associations of fetal growth with later outcomes.2
Although previous US references have provided the information needed to calculate continuous and categorical measures of fetal growth,3,4 they are based on data that may not reflect the most current sociodemographic composition of the United States. These references have also not compared existing methods for developing smoothed percentile curves5,6 because there may be 1 that is optimal.7 Furthermore, existing US references rely on gestational age (GA) estimated from maternal reports of last menstrual period (LMP),3,4,8 which are more prone to systematic error than obstetric estimates (ie, the clinician’s best estimate incorporating all perinatal factors, including ultrasound, menstrual history, and laboratory values). Although 1 study in 2011 used obstetric GA estimates to create US BW-for-GA references, it did not include births from all US states because obstetric GA had not yet been adopted as the reporting standard on US birth certificates at the time.9 Beginning in 2014, the National Center for Health Statistics (NCHS) adopted the obstetric estimate as the new standard of GA reporting on all birth certificates because of increasing evidence of its greater validity.10 Recently, the American College of Obstetricians and Gynecologists, American Institute of Ultrasound in Medicine, and Society for Maternal-Fetal Medicine recommended using the obstetric estimate for purposes of research and surveillance.11 Given the concerns regarding the validity of LMP-based birth weight references, we believed it would be useful to create a nationally representative birth weight reference based on obstetric estimates of GA.
Therefore, we aim to create an updated BW-for-GA reference in the United States using the most recent, nationally representative data on birth weight and obstetric estimates of GA and compare 2 previously applied smoothing techniques (the nonlinear, resistant smoothing technique5 and the lambda-mu-sigma [LMS] method6) for developing percentile curves.
Methods
Study Population
We used data on 3 864 754 live births from the 2017 US natality files,12 a database of US birth certificates publicly available from the National Vital Statistics System of the NCHS. We restricted our analysis to singleton live births at 22 to 42 completed weeks’ gestation and excluded mothers <18 years old (as fetal growth differs in adolescent versus adult mothers13); newborns with missing birth weight, parity, or race and/or ethnicity; and those with imputed GA or plurality. We used the obstetric estimate of gestation at delivery as our primary source of GA.10 To further reduce likely errors in GA reporting, we restricted our analysis to records in which both the LMP and obstetric estimates of GA were within 2 weeks of each other.4
We applied the criteria of Alexander et al8 to exclude records with implausible birth weights at each GA and in which the GA- and sex-specific birth weight z scores (calculated by using GA-specific medians and SDs within the current data set) were beyond the acceptable range (for GA ≥37 weeks, <−5 or >+5 SDs; for GA <37 weeks, <−4 or >+3 SDs).4 We retained data on 3 285 552 births (85.0%; Fig 1). This study was exempt from institutional review board review under paragraph 4 of the Department of Health and Human Services Code of Regulations.
FIGURE 1.

Flowchart of eventual study sample.
Statistical Analysis
We applied 2 techniques to generate GA-specific percentiles for birth weight. The first is a nonlinear, resistant smoothing technique (4253H, twice)5 previously used to generate reference percentiles from the 1999–2009 US natality files. This method has been detailed previously3,4; briefly, it is not based on distributional assumptions and reduces the impact of irregularities in the percentile curves across GA groups to obtain smoothed estimates. It provides smoothed percentiles but not z scores.
The second is the LMS technique, which models birth weight as a function of GA by fitting the Box-Cox t distribution that takes into account the degree of skewness (L), central tendency (M), dispersion (S), and kurtosis of the data.14 The model estimates the LMS parameters, which are smoothed by using P-splines to obtain GA-specific percentiles from the smoothed model parameters. Furthermore, it permits transformation of birth weight into GA-specific birth weight z scores and percentiles by using the following formulas:
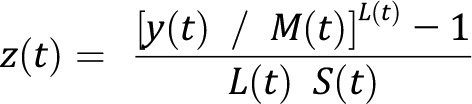 |
where t represents GA (in completed weeks), and y represents birth weight.
With the values of L(t), M(t), and S(t), the 100α percentile is given by the following:
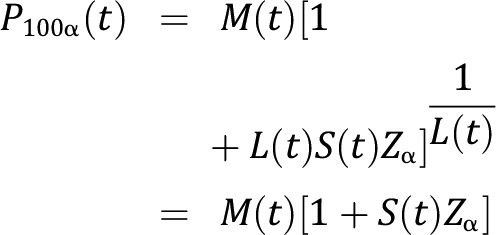 |
where Zα is the standard normal deviate that gives 100α% cumulative probability. This method relies on the assumption that after transformation, the variables of interest would follow a normal distribution.15
We plotted the smoothed percentiles of birth weight across completed weeks’ gestation at the third, 10th, 50th, 90th, and 97th percentiles to identify deviations in the percentile curves generated using both techniques. We used κ-statistics to assess for agreement of BW-for-GA cut-points generated from both techniques at the following thresholds: ≤3rd or 10th percentile and ≥90th or 97th percentile.
We also used smoothed BW-for-GA cut-points at the third, 10th, 90th, and 97th percentiles previously derived from the 1999–2009 US birth weight references (in which GA was LMP based) and applied them to our current 2017 data set. We compared the proportion of births at these cut-points from different reference years (and using the LMP measure of GA) to those derived by using the 2017 data (and obstetric measure of GA). We used the Generalized Additive Models for Location Scale and Shape package in R version 3.4.4 for the LMS smoothing technique and Stata 15.1 (Stata Corp, College Station, TX) for the 4253H smoothing technique and all other analyses.
Results
Population Description
A total of 3 028 526 births (92.2%) were term (37‒41 6/7 weeks), 61 106 (1.9%) were early preterm (22‒33 6/7 weeks), 185 724 (5.6%) were late preterm (34‒36 6/7 weeks), and 10 196 (0.3%) were postterm (42 weeks). Male infants comprised 1 682 373 (51.2%), and female infants comprised 1 603 179 (48.8%) births. There were 1 011 524 (30.8%) first-born infants, 939 181 (28.6%) second-born infants, and 1 334 847 (40.6%) third-or-more–born infants. Additionally, 1 730 913 (52.7%) were non-Hispanic white, 454 698 (13.8%) were non-Hispanic black, 774 265 (23.6%) were Hispanic, and 325 676 (9.9%) were Asian American or other.
Comparisons Between LMS and 4253H Smoothing Methods
The smoothed birth weight curves derived for male and female infants at the third, 10th, 50th, 90th, and 97th percentiles by using the LMS technique overlapped considerably at all GAs with those derived by using the 4253H smoothing technique (Fig 2). For example, in male infants, the estimated 10th percentile cut-point at 40 weeks was 3068 g by using LMS and 3065 g by using the 4253H smoothing technique, whereas the 90th percentile cut-points were 4122 and 4125 g, respectively. Similarly, in female infants, the estimated 10th percentile cut-points at 40 weeks were 2958 and 2955 g by using the LMS and the 4253H smoothing techniques, respectively, whereas the 90th percentile cut-points were 3968 and 3969 g, respectively. We observed strong agreements (>99% agreement; κ-statistic >0.9) for BW-for-GA cut-points at the third, 10th, 90th, and 97th percentiles between the LMS and 4253H smoothing techniques across all GAs (Table 1).
FIGURE 2.

Comparison of smoothed BW-for-GA percentile curves between the LMS and 4253H smoothing technique.
TABLE 1.
Agreement of BW-for-GA Cut-points Generated by the LMS and 4253H Smoothing Techniques
| GA, wk | % Agreement, κ-Statistic of BW-for-GA Percentile | |||
|---|---|---|---|---|
| Third | 10th | 90th | 97th | |
| 22 | 99.6, 0.94 | 99.4, 0.96 | 97.9, 0.89 | 99.4, 0.89 |
| 23 | 99.3, 0.88 | 98.8, 0.93 | 98.9, 0.94 | 99.4, 0.90 |
| 24 | 99.3, 0.89 | 99.4, 0.97 | 99.6, 0.98 | 99.7, 0.94 |
| 25 | 99.9, 0.97 | 97.9, 0.90 | 99.1, 0.95 | 99.7, 0.95 |
| 26 | 99.6, 0.93 | 98.6, 0.93 | 98.6, 0.92 | 99.6, 0.94 |
| 27 | 99.9, 0.99 | 99.1, 0.95 | 99.4, 0.97 | 99.6, 0.92 |
| 28 | 99.7, 0.95 | 98.5, 0.92 | 99.7, 0.99 | 99.9, 0.99 |
| 29 | 99.9, 0.98 | 99.3, 0.96 | 98.9, 0.94 | 99.7, 0.95 |
| 30 | 99.8, 0.96 | 99.3, 0.96 | 98.9, 0.94 | 99.8, 0.97 |
| 31 | 99.8, 0.97 | 99.3, 0.96 | 99.0, 0.94 | 99.8, 0.96 |
| 32 | 99.9, 0.98 | 99.7, 0.98 | 99.2, 0.95 | 99.8, 0.97 |
| 33 | 99.9, 0.98 | 99.5, 0.97 | 99.9, 0.99 | 99.4, 0.91 |
| 34 | 99.7, 0.95 | 99.9, 0.99 | 99.5, 0.97 | 99.7, 0.95 |
| 35 | 99.8, 0.96 | 99.9, 0.99 | 99.4, 0.97 | 99.2, 0.87 |
| 36 | 99.9, 0.97 | 99.9, 0.99 | 99.5, 0.97 | 99.9, 0.99 |
| 37 | 99.9, 0.99 | 99.7, 0.99 | 99.9, 0.99 | 99.8, 0.97 |
| 38 | 99.9, 0.99 | 99.9, 0.99 | 99.9, 0.99 | 99.8, 0.97 |
| 39 | 99.8, 0.96 | 99.9, 0.99 | 99.9, 0.99 | 99.9, 0.98 |
| 40 | 99.7, 0.94 | 99.9, 0.99 | 99.9, 0.99 | 99.9, 0.99 |
| 41 | 99.7, 0.94 | 99.3, 0.96 | 99.9, 0.99 | 99.9, 0.99 |
| 42 | 99.9, 0.98 | 99.9, 0.99 | 99.8, 0.99 | 99.6, 0.93 |
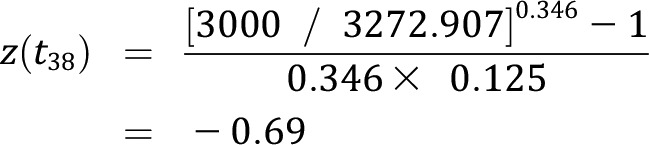
We have provided GA-specific LMS values (Tables 2 and 3) and BW-for-GA cut-points at the third, 10th, 25th, 50th, 75th, 90th, and 97th percentiles (Supplemental Tables 4 through 11) for male and female infants as well as first-, second-, and third-or-more–born infants. As expected, at each GA, the median values (representing birth weights) were higher among male than female infants and among non–first-born than first-born infants of both sexes. The LMS values can be used for calculation of BW-for-GA z scores that are sex or parity specific. For example, suppose we wanted to calculate the BW-for-GA z score of a female infant born at 3000 g at 38 weeks’ gestation; we could use the corresponding LMS values at 38 weeks’ gestation with the z score equation provided in our Methods section; this would correspond to the following:
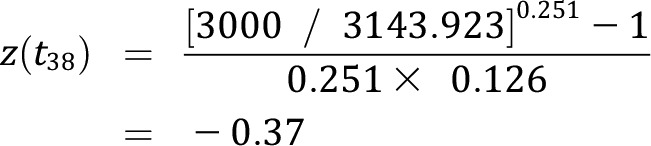 |
Similarly, for a male infant born at 3000 g at 38 weeks’ gestation, the z score would correspond to the following:
 |
Additionally, we created an interactive Web application z score calculator (https://izzuddin-aris.shinyapps.io/BW-for-GA_z-score_webapp/) that provides sex- and parity-specific z scores and percentiles either for 1 or many infants, of which the latter is based on a user-specified data set containing GA, infant sex, parity, and birth weight. We have provided details and instructions on its usage in the Supplemental Information.
TABLE 2.
LMS Values For Each GA in Male Infants
| GA, wk | All (n = 1 682 373) | First-born (n = 519 640) | Second-born (n = 480 397) | Third-born or More (n = 682 336) | ||||||||
|---|---|---|---|---|---|---|---|---|---|---|---|---|
| Skewness | Central Tendency | Dispersion | Skewness | Central Tendency | Dispersion | Skewness | Central Tendency | Dispersion | Skewness | Central Tendency | Dispersion | |
| 22 | 1.362 | 494.570 | 0.142 | 1.514 | 503.890 | 0.139 | 1.416 | 490.613 | 0.143 | 1.412 | 491.272 | 0.144 |
| 23 | 1.435 | 595.591 | 0.153 | 1.520 | 592.519 | 0.156 | 1.577 | 594.991 | 0.153 | 1.345 | 595.448 | 0.155 |
| 24 | 1.509 | 681.817 | 0.168 | 1.510 | 683.038 | 0.175 | 1.713 | 683.382 | 0.164 | 1.363 | 681.511 | 0.167 |
| 25 | 1.559 | 777.477 | 0.183 | 1.466 | 773.691 | 0.194 | 1.783 | 778.435 | 0.176 | 1.460 | 778.720 | 0.177 |
| 26 | 1.554 | 886.921 | 0.196 | 1.377 | 873.465 | 0.209 | 1.758 | 894.750 | 0.189 | 1.604 | 893.221 | 0.186 |
| 27 | 1.484 | 1008.568 | 0.206 | 1.259 | 987.207 | 0.218 | 1.642 | 1013.942 | 0.198 | 1.676 | 1025.615 | 0.192 |
| 28 | 1.368 | 1142.504 | 0.209 | 1.149 | 1113.391 | 0.220 | 1.467 | 1136.068 | 0.201 | 1.590 | 1168.299 | 0.195 |
| 29 | 1.238 | 1290.461 | 0.204 | 1.066 | 1262.635 | 0.215 | 1.284 | 1289.005 | 0.198 | 1.393 | 1318.953 | 0.192 |
| 30 | 1.124 | 1465.963 | 0.196 | 1.009 | 1429.091 | 0.207 | 1.129 | 1467.644 | 0.193 | 1.200 | 1491.746 | 0.187 |
| 31 | 1.041 | 1660.905 | 0.189 | 0.973 | 1607.149 | 0.199 | 1.024 | 1664.078 | 0.187 | 1.061 | 1688.923 | 0.181 |
| 32 | 0.980 | 1855.855 | 0.182 | 0.945 | 1802.863 | 0.191 | 0.977 | 1862.363 | 0.178 | 0.992 | 1895.276 | 0.176 |
| 33 | 0.934 | 2081.769 | 0.173 | 0.930 | 2022.571 | 0.179 | 0.959 | 2086.358 | 0.169 | 0.944 | 2121.876 | 0.170 |
| 34 | 0.905 | 2328.236 | 0.163 | 0.929 | 2268.521 | 0.166 | 0.927 | 2337.080 | 0.159 | 0.880 | 2361.383 | 0.160 |
| 35 | 0.872 | 2586.847 | 0.152 | 0.910 | 2531.031 | 0.156 | 0.856 | 2609.473 | 0.150 | 0.830 | 2622.735 | 0.150 |
| 36 | 0.712 | 2840.807 | 0.144 | 0.826 | 2764.645 | 0.146 | 0.706 | 2853.999 | 0.140 | 0.682 | 2867.194 | 0.142 |
| 37 | 0.486 | 3057.622 | 0.135 | 0.659 | 2982.338 | 0.136 | 0.476 | 3084.363 | 0.132 | 0.358 | 3097.129 | 0.135 |
| 38 | 0.346 | 3272.907 | 0.125 | 0.491 | 3188.996 | 0.124 | 0.332 | 3290.043 | 0.123 | 0.318 | 3313.787 | 0.124 |
| 39 | 0.355 | 3461.522 | 0.117 | 0.392 | 3377.400 | 0.117 | 0.316 | 3481.397 | 0.115 | 0.332 | 3497.917 | 0.116 |
| 40 | 0.434 | 3572.973 | 0.112 | 0.410 | 3511.618 | 0.112 | 0.439 | 3595.810 | 0.110 | 0.484 | 3626.356 | 0.112 |
| 41 | 0.498 | 3686.785 | 0.111 | 0.485 | 3636.136 | 0.110 | 0.521 | 3713.892 | 0.109 | 0.554 | 3750.680 | 0.112 |
| 42 | 0.593 | 3797.275 | 0.116 | 0.604 | 3740.548 | 0.110 | 0.622 | 3806.397 | 0.113 | 0.679 | 3867.182 | 0.118 |
TABLE 3.
LMS Values For Each GA in Female Infants
| GA, wk | All (n = 1 603 179) | First-born (n = 491 884) | Second-born (n = 458 784) | Third-born or More (n = 652 511) | ||||||||
|---|---|---|---|---|---|---|---|---|---|---|---|---|
| Skewness | Central Tendency | Dispersion | Skewness | Central Tendency | Dispersion | Skewness | Central Tendency | Dispersion | Skewness | Central Tendency | Dispersion | |
| 22 | 0.868 | 469.074 | 0.137 | 0.603 | 466.402 | 0.158 | 1.086 | 477.578 | 0.140 | 1.114 | 468.365 | 0.134 |
| 23 | 1.061 | 552.366 | 0.156 | 0.788 | 545.404 | 0.176 | 1.194 | 556.563 | 0.159 | 1.212 | 553.062 | 0.151 |
| 24 | 1.181 | 633.758 | 0.180 | 0.930 | 625.038 | 0.195 | 1.262 | 635.634 | 0.180 | 1.265 | 640.210 | 0.171 |
| 25 | 1.207 | 725.641 | 0.200 | 1.016 | 712.144 | 0.211 | 1.267 | 725.021 | 0.199 | 1.266 | 734.829 | 0.188 |
| 26 | 1.174 | 823.942 | 0.212 | 1.047 | 812.602 | 0.221 | 1.215 | 823.842 | 0.211 | 1.243 | 834.294 | 0.201 |
| 27 | 1.123 | 937.473 | 0.216 | 1.041 | 924.822 | 0.223 | 1.133 | 931.891 | 0.215 | 1.213 | 948.241 | 0.208 |
| 28 | 1.067 | 1062.797 | 0.217 | 1.017 | 1041.628 | 0.220 | 1.046 | 1059.154 | 0.216 | 1.157 | 1083.759 | 0.208 |
| 29 | 1.001 | 1208.956 | 0.213 | 0.983 | 1170.746 | 0.214 | 0.975 | 1210.711 | 0.212 | 1.063 | 1237.360 | 0.204 |
| 30 | 0.916 | 1375.672 | 0.205 | 0.905 | 1325.737 | 0.207 | 0.904 | 1378.155 | 0.205 | 0.944 | 1408.759 | 0.196 |
| 31 | 0.818 | 1555.810 | 0.196 | 0.771 | 1505.975 | 0.202 | 0.839 | 1560.118 | 0.198 | 0.843 | 1589.373 | 0.186 |
| 32 | 0.720 | 1758.998 | 0.188 | 0.638 | 1703.148 | 0.193 | 0.787 | 1764.394 | 0.190 | 0.757 | 1794.154 | 0.178 |
| 33 | 0.659 | 1978.934 | 0.177 | 0.571 | 1922.379 | 0.180 | 0.761 | 1989.897 | 0.180 | 0.702 | 2014.675 | 0.170 |
| 34 | 0.674 | 2225.948 | 0.164 | 0.620 | 2174.540 | 0.167 | 0.758 | 2230.023 | 0.166 | 0.666 | 2257.301 | 0.160 |
| 35 | 0.680 | 2487.121 | 0.153 | 0.715 | 2432.968 | 0.155 | 0.697 | 2502.026 | 0.152 | 0.612 | 2517.864 | 0.152 |
| 36 | 0.546 | 2731.347 | 0.147 | 0.698 | 2671.268 | 0.147 | 0.560 | 2740.178 | 0.144 | 0.472 | 2755.493 | 0.146 |
| 37 | 0.369 | 2936.346 | 0.139 | 0.544 | 2872.597 | 0.138 | 0.392 | 2954.137 | 0.138 | 0.268 | 2970.125 | 0.139 |
| 38 | 0.251 | 3143.923 | 0.126 | 0.371 | 3071.299 | 0.125 | 0.277 | 3158.383 | 0.124 | 0.208 | 3180.603 | 0.126 |
| 39 | 0.232 | 3324.318 | 0.117 | 0.258 | 3250.409 | 0.116 | 0.215 | 3338.457 | 0.115 | 0.232 | 3357.969 | 0.117 |
| 40 | 0.293 | 3436.793 | 0.111 | 0.276 | 3383.711 | 0.110 | 0.304 | 3455.533 | 0.110 | 0.355 | 3485.223 | 0.112 |
| 41 | 0.364 | 3546.078 | 0.110 | 0.312 | 3497.869 | 0.109 | 0.385 | 3571.537 | 0.109 | 0.496 | 3604.003 | 0.110 |
| 42 | 0.477 | 3623.167 | 0.118 | 0.395 | 3592.890 | 0.114 | 0.434 | 3636.667 | 0.115 | 0.704 | 3686.437 | 0.118 |
The coefficients of skewness and kurtosis for the quantile residuals by using the LMS technique were −0.002 and 3.00, respectively, indicating a good approximation of a normal distribution of BW-for-GA z score (Supplemental Fig 4).
Comparisons With Previous References
BW-for-GA cut-points derived from the 2017 data set by using the LMS method identified 9.8% to 10.2% of births as ≤10th or ≥90th percentile and 2.6% to 3.3% of births as ≤3rd and ≥97th percentile across preterm, term, and postterm GA categories. However, as shown in Fig 3, cut-points from US references based on data from 1999 to 2009 yielded a much larger variation in proportions of 2017 births at these thresholds, especially for preterm and postterm GA categories. Among preterm births, the 10th percentile cut-points from previous references captured 11.5% to 14.4% of births, whereas the 90th and 97th percentiles captured a smaller proportion of births than expected (90th percentile, 1.8%‒7.5%; 97th percentile, 0.2%‒2.2%). In postterm births, the third and 10th percentiles using the earlier reference data captured a smaller proportion of births (third percentile, 1.0%‒1.9%; 10th percentile, 3.9%‒6.1%), whereas the 90th and 97th percentiles captured a larger proportion of births than expected (90th percentile, 17.0%‒17.6%; 97th percentile, 5.6%‒6.3%). Among term births, the percentile cut-points from the 2009 reference captured similar proportions of births when compared with our methods. The 1999 reference, however, captured a smaller proportion of births than expected at the 90th (7.9%) and the 97th (2.2%) percentiles.
FIGURE 3.

Prevalence of births at the third, 10th, 90th, and 97th percentiles in preterm (22‒36 weeks’ gestation), term (37‒41 weeks’ gestation), and postterm (42 weeks’ gestation) infants according to previous US birth weight references.
Discussion
In this study, we have provided an updated BW-for-GA reference using nationwide US birth data in 2017 together with information required to calculate continuous and/or categorical measures of birth size that are sex or parity specific. This reference reflects the current sociodemographic composition of the United States.
An important contribution of our new reference is the use of the obstetric, rather than LMP, estimate of GA. Birth weight is generally well measured, even in administrative data.16 Population references for BW-for-GA thus depend greatly on accurate assessments of GA. Previous studies questioned the accuracy of the LMP, used in most previous birth weight references, as a method of calculating GA.17,18 In an analysis of singleton births from the 2005 natality files, Callaghan et al19 reported that using the obstetric estimate of gestation resulted in BW-for-GA distributions that were identical to the gold standard of estimated GA, defined as when obstetric and LMP estimates of GA agreed within 1 week of each other, the mother entered prenatal care in the first trimester, and no congenital anomalies were present. Using LMP estimates, however, resulted in BW-for-GA distributions that were substantially different from the gold standard.19 This suggests that previous US BW-for-GA references that used LMP estimates of GA should be revisited. Furthermore, beginning in the 2014 data year, NCHS adopted the obstetric estimate as the new standard of GA reporting on birth certificates10 because of evidence of its greater validity.
Hence, our updated BW-for-GA charts not only reflect size at birth in the current US population, it is also based on a more reliable measure of GA. Previous studies showed that other determinants of fetal growth, including maternal height, prepregnancy weight, gestational weight gain, rates of gestational diabetes, and smoking during pregnancy, have been changing over time. For example, maternal weight and gestational weight gain have both shown increases over the past decades in the United States.20,21 Recent surveillance data now show that the rate of gestational diabetes increased by 0.4 percentage points from 2012 to 2016.22 On the other hand, smoking during pregnancy, a strong predictor of lower fetal growth, has been declining.23 These secular trends in pregnancy characteristics are likely to contribute to changes in birth weight distributions over time, further emphasizing the need for a fetal growth reference that reflects the current sociodemographic composition of the United States.
Another important contribution of our study pertains to the feasibility of the LMS smoothing technique to derive BW-for-GA curves for the US natality data set. Currently, a variety of methods are available for developing smoothed percentile curves, and there is no single method that is effective for all situations and purposes. Previous US birth weight references had used the 4253H smoothing technique,3,4 which makes no parametric or other modeling assumptions, and the eventual percentile curves often tend to be close to the empirical data. The LMS technique, commonly used to derive BW-for-GA curves in other populations,24,25 has yet to be demonstrated to be appropriate for US birth data because it requires more assumptions (ie, after transforming birth weight into BW-for-GA z scores, the z scores are normally distributed).7 We have provided evidence that BW-for-GA curves derived by using both techniques overlapped considerably at all GAs. Furthermore, the LMS technique permits direct calculation of z scores, is easier to use, and provides investigators with a continuous measure of birth weight disentangled from the effects of gestational length, making it useful for studies examining predictors of fetal growth or associations of fetal growth on later outcomes.
When we applied cut-points from previous US references to the 2017 data set, we noted discrepancies from expected proportions that were most apparent in pre- and postterm GAs, likely due to the use of the obstetric estimate of GA in the 2017 data set. Compared with our reference, previous references identified a greater proportion of preterm births as small for GA (<10th percentile) and a lower proportion of births as large for GA (>90th percentile). This indicated that BW-for-GA cut-points for preterm births from previous US references were larger compared with ours (particularly evident for the 1999 reference), perhaps because of the bimodal distribution of birth weights commonly observed among preterm births when GA is based primarily on LMP. This phenomenon is characterized by a dominant distribution consistent with the expected birth weight for preterm infants and a secondary distribution consistent with the expected birth weight for term infants, which would shift the BW-for-GA cut-point to be larger than expected.26 We observed smaller differences between the 2009 reference and our reference, which could be due to a “cleaning algorithm” used by the authors to eliminate the second mode of birth weight distribution in the preterm GA range when constructing the 2009 references.4 The use of the obstetric estimate of GA also likely eliminated this bimodal distribution of birth weight among preterm births in our reference.
Conversely, in postterm births, previous references classified substantially fewer births as small for GA (below both the third and 10th percentiles) but greater proportion of births as large for GA, indicating that BW-for-GA cut-points for postterm births from previous US references were smaller compared with ours. These differences could also result from the different sources of GA used between references. It has been shown that LMP tends to overestimate GA in the postterm range when compared with the obstetric estimate10; thus, BW-for-GA cut-points for postterm births from previous US references would be smaller than expected when used on a data set in which GA is based on the obstetric estimate. In term infants, we observed a smaller proportion of births than expected at the 90th and 97th percentiles for the 1999 reference compared with our reference, suggesting a secular trend of decreasing fetal growth, as previously reported.27 The small differences between the 2009 and 2017 references, however, suggest that fetal growth may have stabilized from 2009. Further studies are warranted to examine the factors related to these trends.
The strengths of our study include a large sample involving almost all births in the most recent year in which data are available and therefore is nationally representative of current size for GA in the United States. Furthermore, the use of the obstetric estimate provides a more reliable measure of GA compared with previous US references, especially because the NCHS had adopted the obstetric estimate as the new standard of GA reporting on birth certificates, beginning in 2014.10 However, there are some limitations to consider. First, our reference, like those published previously,3,4,8 is based on cross-sectional data at birth and does not reflect longitudinal growth of individual infants. Second, we chose not to construct BW-for-GA standards, which are generated from exclusion of high-risk pregnancies associated with alterations in birth weight.28 Standards, such as those by the International Fetal and Newborn Growth Consortium for the 21st Century and Eunice Kennedy Shriver National Institute of Child Health and Human Development Fetal Growth Studies,29,30 differ conceptually from references, and given the limitations of vital records data,31 we cannot apply the same criteria used to generate standards in our current data set. Further studies are warranted to compare existing standards with our reference in predicting important health outcomes. We also chose not to compare our reference to other frequently used references by Fenton et al32 or Olsen et al33 because those references did not include births from all US states and therefore may not be nationally representative of size for GA in United States. Third, we chose not to provide race-specific birth weight percentiles; whereas sex and parity are immutable, differences in birth weight by race and/or ethnicity may likely reflect disparities in obstetric care and social and environmental circumstances.34 Fourth, we were unable to provide birth length-for-GA, weight-for-length, or head-circumference–for–GA references because neither head circumference nor recumbent length are reported on US birth certificates. Lastly, despite the large sample size, there are a smaller number of infants at GA extremes; these estimates may be less reliable, particularly when stratified by sex and parity, and should be interpreted cautiously.
Conclusions
We have provided an updated and nationally representative birth weight reference that uses a more reliable estimate of GA and reflects the most recent sociodemographic composition in the United States. Given the concerns regarding the validity of LMP-based references, the need for an obstetric estimate-based reference has become increasingly appreciated. This new reference will allow researchers and clinicians to weigh its appropriateness against their specific needs.
Glossary
- BW-for-GA
birth weight for gestational age
- GA
gestational age
- LMP
last menstrual period
- LMS
lambda-mu-sigma
- NCHS
National Center for Health Statistics
Footnotes
Dr Aris conducted the analyses, interpreted the results, drafted the initial manuscript, and reviewed and revised the manuscript; Drs Kleinman, Belfort, and Kaimal interpreted the results and critically reviewed the manuscript for important intellectual content; Dr Oken conceived and conceptualized the study, interpreted the results, and critically reviewed the manuscript for important intellectual content; and all authors approved the final manuscript as submitted and agree to be accountable for all aspects of the work.
FINANCIAL DISCLOSURE: The authors have indicated they have no financial relationships relevant to this article to disclose.
FUNDING: Supported by the National University of Singapore Overseas Postdoctoral Fellowship (2017) and the National Institutes of Health (P30 DK092924 and UH3 OD023286). Funded by the National Institutes of Health (NIH).
POTENTIAL CONFLICT OF INTEREST: The authors have indicated they have no potential conflicts of interest to disclose.
References
- 1.Fall CH. Fetal malnutrition and long-term outcomes. Nestle Nutr Inst Workshop Ser. 2013;74:11–25 [DOI] [PMC free article] [PubMed] [Google Scholar]
- 2.Qin C, Dietz PM, England LJ, Martin JA, Callaghan WM. Effects of different data-editing methods on trends in race-specific preterm delivery rates, United States, 1990-2002. Paediatr Perinat Epidemiol. 2007;21(suppl 2):41–49 [DOI] [PubMed] [Google Scholar]
- 3.Oken E, Kleinman KP, Rich-Edwards J, Gillman MW. A nearly continuous measure of birth weight for gestational age using a United States national reference. BMC Pediatr. 2003;3:6. [DOI] [PMC free article] [PubMed] [Google Scholar]
- 4.Talge NM, Mudd LM, Sikorskii A, Basso O. United States birth weight reference corrected for implausible gestational age estimates. Pediatrics. 2014;133(5):844–853 [DOI] [PubMed] [Google Scholar]
- 5.Velleman PF. Definition and comparison of robust nonlinear data smoothing algorithms. J Am Stat Assoc. 1980;75(371):609–615 [Google Scholar]
- 6.Cole TJ, Green PJ. Smoothing reference centile curves: the LMS method and penalized likelihood. Stat Med. 1992;11(10):1305–1319 [DOI] [PubMed] [Google Scholar]
- 7.Flegal KM. Curve smoothing and transformations in the development of growth curves. Am J Clin Nutr. 1999;70(1):163S–165S [DOI] [PubMed] [Google Scholar]
- 8.Alexander GR, Himes JH, Kaufman RB, Mor J, Kogan M. A United States national reference for fetal growth. Obstet Gynecol. 1996;87(2):163–168 [DOI] [PubMed] [Google Scholar]
- 9.Duryea EL, Hawkins JS, McIntire DD, Casey BM, Leveno KJ. A revised birth weight reference for the United States. Obstet Gynecol. 2014;124(1):16–22 [DOI] [PubMed] [Google Scholar]
- 10.Martin JA, Osterman MJ, Kirmeyer SE, Gregory EC. Measuring gestational age in vital statistics data: transitioning to the obstetric estimate. Natl Vital Stat Rep. 2015;64(5):1–20 [PubMed] [Google Scholar]
- 11.Committee on Obstetric Practice, the American Institute of Ultrasound in Medicine, and the Society for Maternal-Fetal Medicine Committee Opinion No 700: methods for estimating the due date. Obstet Gynecol. 2017;129(5):e150–e154 [DOI] [PubMed] [Google Scholar]
- 12.Martin JA, Hamilton BE, Osterman MJK. Births in the United States, 2017. NCHS Data Brief. 2018;(318):1–8 [PubMed] [Google Scholar]
- 13.Gilbert W, Jandial D, Field N, Bigelow P, Danielsen B. Birth outcomes in teenage pregnancies. J Matern Fetal Neonatal Med. 2004;16(5):265–270 [DOI] [PubMed] [Google Scholar]
- 14.Rigby RA, Stasinopoulos DM. Using the Box-Cox t distribution in GAMLSS to model skewness and kurtosis. Stat Model Int J. 2006;6(3):209–229 [Google Scholar]
- 15.Box GEP, Cox DR. An analysis of transformations. J R Stat Soc B. 1964;26(2):211–252 [Google Scholar]
- 16.Northam S, Knapp TR. The reliability and validity of birth certificates. J Obstet Gynecol Neonatal Nurs. 2006;35(1):3–12 [DOI] [PubMed] [Google Scholar]
- 17.Dietz PM, England LJ, Callaghan WM, Pearl M, Wier ML, Kharrazi M. A comparison of LMP-based and ultrasound-based estimates of gestational age using linked California livebirth and prenatal screening records. Paediatr Perinat Epidemiol. 2007;21(suppl 2):62–71 [DOI] [PubMed] [Google Scholar]
- 18.Joseph KS, Huang L, Liu S, et al. ; Fetal and Infant Health Study Group of the Canadian Perinatal Surveillance System . Reconciling the high rates of preterm and postterm birth in the United States. Obstet Gynecol. 2007;109(4):813–822 [DOI] [PubMed] [Google Scholar]
- 19.Callaghan WM, Dietz PM. Differences in birth weight for gestational age distributions according to the measures used to assign gestational age. Am J Epidemiol. 2010;171(7):826–836 [DOI] [PubMed] [Google Scholar]
- 20.Hales CM, Fryar CD, Carroll MD, Freedman DS, Ogden CL. Trends in obesity and severe obesity prevalence in US youth and adults by sex and age, 2007-2008 to 2015-2016. JAMA. 2018;319(16):1723–1725 [DOI] [PMC free article] [PubMed] [Google Scholar]
- 21.Johnson JL, Farr SL, Dietz PM, Sharma AJ, Barfield WD, Robbins CL. Trends in gestational weight gain: the Pregnancy Risk Assessment Monitoring System, 2000-2009. Am J Obstet Gynecol. 2015;212(6):806.e1–806.e8 [DOI] [PMC free article] [PubMed] [Google Scholar]
- 22.Deputy NP, Kim SY, Conrey EJ, Bullard KM. Prevalence and changes in preexisting diabetes and gestational diabetes among women who had a live birth - United States, 2012-2016. MMWR Morb Mortal Wkly Rep. 2018;67(43):1201–1207 [DOI] [PMC free article] [PubMed] [Google Scholar]
- 23.Donahue SM, Kleinman KP, Gillman MW, Oken E. Trends in birth weight and gestational length among singleton term births in the United States: 1990-2005. Obstet Gynecol. 2010;115(2, pt 1):357–364 [DOI] [PMC free article] [PubMed] [Google Scholar]
- 24.Aris IM, Gandhi M, Cheung YB, et al. A new population-based reference for gestational age-specific size-at-birth of Singapore infants. Ann Acad Med Singapore. 2014;43(9):439–447 [PubMed] [Google Scholar]
- 25.Norris T, Seaton SE, Manktelow BN, et al. Updated birth weight centiles for England and Wales. Arch Dis Child Fetal Neonatal Ed. 2018;103(6):F577–F582 [DOI] [PMC free article] [PubMed] [Google Scholar]
- 26.Pearl M, Wier ML, Kharrazi M. Assessing the quality of last menstrual period date on California birth records. Paediatr Perinat Epidemiol. 2007;21(suppl 2):50–61 [DOI] [PubMed] [Google Scholar]
- 27.Oken E. Secular trends in birthweight. Nestle Nutr Inst Workshop Ser. 2013;71:103–114 [DOI] [PubMed] [Google Scholar]
- 28.Zhang J, Merialdi M, Platt LD, Kramer MS. Defining normal and abnormal fetal growth: promises and challenges. Am J Obstet Gynecol. 2010;202(6):522–528 [DOI] [PMC free article] [PubMed] [Google Scholar]
- 29.Grantz KL, Hediger ML, Liu D, Buck Louis GM. Fetal growth standards: the NICHD fetal growth study approach in context with INTERGROWTH-21st and the World Health Organization Multicentre Growth Reference Study. Am J Obstet Gynecol. 2018;218(2S):S641–S655, 655.e28 [DOI] [PMC free article] [PubMed] [Google Scholar]
- 30.Papageorghiou AT, Kennedy SH, Salomon LJ, et al. ; International Fetal and Newborn Growth Consortium for the 21st Century . The INTERGROWTH-21st fetal growth standards: toward the global integration of pregnancy and pediatric care. Am J Obstet Gynecol. 2018;218(2S):S630–S640 [DOI] [PubMed] [Google Scholar]
- 31.Ananth CV, Goldenberg RL, Friedman AM, Vintzileos AM. Association of temporal changes in gestational age with perinatal mortality in the United States, 2007-2015. JAMA Pediatr. 2018;172(7):627–634 [DOI] [PMC free article] [PubMed] [Google Scholar]
- 32.Fenton TR, Kim JH. A systematic review and meta-analysis to revise the Fenton growth chart for preterm infants. BMC Pediatr. 2013;13:59. [DOI] [PMC free article] [PubMed] [Google Scholar]
- 33.Olsen IE, Groveman SA, Lawson ML, Clark RH, Zemel BS. New intrauterine growth curves based on United States data. Pediatrics. 2010;125(2). Available at: www.pediatrics.org/cgi/content/full/125/2/e214 [DOI] [PubMed] [Google Scholar]
- 34.Bryant AS, Worjoloh A, Caughey AB, Washington AE. Racial/ethnic disparities in obstetric outcomes and care: prevalence and determinants. Am J Obstet Gynecol. 2010;202(4):335–343 [DOI] [PMC free article] [PubMed] [Google Scholar]