

Abstract
Objective:
Geographic access to primary care can be a barrier to receiving appropriate preventative services. Oklahoma has been identified as having relatively few primary care providers per capita to care for its population compared to the US. The goal of this analysis was to identify the areas in Oklahoma with significant concentrations of children under five, no pediatrician within reasonable driving distance, and whether other primary care providers are present.
Methods:
The 2016 American Community Survey was used to estimate the total population of children under five years of age for each Census Block Group in Oklahoma. Access was defined as a thirty-minute drive time radius computed around each child’s imputed location. The National Provider Identifier database was used to identify and locate pediatricians, family medicine physicians, and mid-level providers in Oklahoma. Areas of high concentrations of children with no pediatrician access were identified and non-pediatrician provider locations were superimposed.
Results:
Of the estimated 265,818 children under five in Oklahoma, approximately 7% were outside of a thirty-minute drive from a pediatrician. These children are concentrated in northwestern and southeastern Oklahoma, with several smaller additional groupings. There are multiple non-pediatrician primary care providers operating in many of these areas.
Conclusion:
There are areas in the state where a paucity of pediatricians and high concentrations of young children lend themselves to collaborations using technology and education to improve the care of children.
Introduction
Access to healthcare has been shown to be related to health outcomes in adults and children.1,2 Geographic access has been shown to be an important barrier for both preventative and urgent care, especially when combined with other factors such as low socioeconomic status.3–5 In a study published in 2010, the authors showed that a lack of primary care providers in the geographic area was associated with lower preventative care services and higher usage of emergency department services.6 Pediatric access to care has been widely addressed in the literature. Multiple reports detail disparities in care access across racial, ethnic, and socioeconomic subgroups.7,8 Specifically examining geography, Shipman and colleagues examined trends in distribution of access to primary care for all pediatric patients (ages 0–17), finding that there was significant mismatch between geographic distribution of providers and patients across the United States, with rural areas and areas with lower income families suffering a disproportionate lack of available primary care providers for children compared to other areas.9
In Oklahoma, a high concentration of physicians exist in the larger cities, but there is a relative paucity of physicians in the areas outside of the major metropolitan areas, and this is especially true for pediatricians.10 Overall, Oklahoma has been noted to have the worst primary care capacity in the nation, and the state is 47th in the US for number of general pediatricians at 49.6 per 100,000 children while in the US the ratio is 87.1 per 100,000 children.11,12 Part or all of every country in Oklahoma is designated as medically underserved by the Health Resources and Services Administration.13
Children under five are a special population because of their need for frequent visits dictated by their rapid growth and development. Additionally, their recommended health maintenance and vaccine schedule requires frequent visits to a healthcare provider. In the first five years of life, the American Academy of Pediatrics recommends at least eleven checkups for a well child, six of these in the first year of life.14 The child receives vaccines at seven of these eleven visits.15 Any barriers to care access can result in delayed vaccination as well as delay in diagnosis of conditions that negatively impact growth and development.
Previous strategies to examine geographic access to care have included using proportions of patients and providers in specific geographic subdivisions such as PCSA’s (primary care service areas).9 Geographic subdivisions can present misclassification problems if the chosen areas are heterogeneous. Using geographic division centroids to calculate travel times or distances to care is another method used in geographic analysis.3,4,16 This, however, can also introduce complications, as individuals at the edges of the geographic divisions that have significantly different drive times are all grouped as having the same drive times. Both of these are variants of the Modifiable Area Unit Problem (MAUP), well known in geospatial mapping in which results can vary based on size and boundaries of arbitrary geographic divisions.17
Improving the spatial resolution of data can be achieved using geoimputation methods.18–21 Such methods either incorporate random processes, deterministic computations, or some sort of hybrid of the two to compute higher spatial resolution information. Geoimputation techniques often make use of secondary data such as population or subsets of population (such as a combination of age, gender and race) to improve the computation. To avoid misclassification error, we employed such an imputation strategy for the location of each individual child under five years of age in Oklahoma to determine care coverage.
Analysis of access to care for children under five in Oklahoma is essential to identify workforce gaps and highlight areas where collaboration between pediatricians, family physicians, and mid-level primary care providers can serve a vulnerable population that requires serial healthcare system encounters. Our aim for this study was to examine children’s geographic access to pediatrician and other primary care providers for Oklahoma’s children under age five.
Methods
Pediatric Population Identification
For this study, we used the 2012–2016 American Community Survey (ACS) 5-year estimates and 2016 TIGER/Line Shapefiles for population estimates and geographic distribution.22 These files contain population estimates by age group and gender at the census block group level and census block group geographic boundary information. Block groups are the smallest geographic unit that the US Census Bureau provides estimates based by age, and are subdivisions of census tracts.23 For Oklahoma there was an estimated 265,818 children under that age of five during that period.
Geoimputation of Pediatric Population
The geoimputation method for children used an informed stochastic process to assign Oklahoma children under the age of five to individual points within census block groups. For geoimputation, the 1km x 1km 2016 total population estimates from LandScan™24 were intersected with the census block groups containing the child population estimates. The proportion of the total population estimate of the 1km x 1km polygon to the total population of the census block group was calculated. For each census block group, the geoimputation algorithm assigned each child to a polygon within the census block group, based on the ratio of estimated total population of each intersected polygon to the total census block group population. A random point was then generated within the intersected polygon and the child was assigned to that point. This process was repeated for the estimated number of children under five in the state (265,818). Thus, the estimated number of children in each block group was probabilistically assigned to smaller areas (1km x 1km polygons) in a manner proportional to the overall total population distribution of those areas with the goal of providing higher resolution for analysis.
Location/Drive Time Identification
For this study reasonable driving distance was defined as a thirty minute drive time based on previous literature.5 For our drive time estimates we used the Geocoding and Logistics Service Areas tools in ArcGIS® Ready-to-Use services to estimate drive times based on allowable roads and traffic conditions. To begin with, the major pediatric centers (The Children’s Hospital at The University of Oklahoma (OU) Medical Center and The Children’s Hospital at Saint Francis) were geocoded and a thirty minute drive time was calculated around each facility.25 For computational efficiency, children in these areas were excluded from further analysis because, while likely having other barriers to pediatrician access, inhabitants of these areas do not have a geographic barrier to access because of high concentration of pediatricians at these facilities. For children falling outside of these areas, a thirty-minute drive time around the child’s location was calculated.25,26 As a next step, a thirty minute drive time was calculated around each pediatrician’s office to visualize the pediatric coverage in the state. Analyses, however, comparing child and physician locations were performed using the calculated drive times around the children to mirror the child to physician direction of travel in a conventional medical encounter.
Provider Identification
For provider identification we used the National Provider Identifier (NPI) database downloaded in May 2018.10 Pediatricians (208000000X), Family Practice physicians (207Q00000X), and nurse practitioners and physicians assistants (363LF0000X, 363LP0200X, 363LP2300X, 364SF0001X, 364SP0200X) indicating either pediatrics or family practice working in Oklahoma were identified.27 For each provider the primary business address was geocoded and mapped.25 To account for potential misclassification in the NPI, in the areas of the highest concentration of children with no pediatrician we manually searched using Google for pediatric offices and then confirmed their presence by phone. Pediatricians who were listed as board certified on the web portals of the American Board of Pediatrics or the American Osteopathic Board of Pediatrics were geocoded and the model was re-run. Finally, to identify pediatricians who might be primarily based outside of the state but who attend children in Oklahoma, the Oklahoma SoonerCare (Medicaid) provider directory was searched.28 Thus, pediatricians in neighboring states registered with SoonerCare and who were listed as board certified by the American Board of Pediatrics or the American Osteopathic Board of Pediatrics were added to the model prior to the final run.
Analysis of Pediatrician and Primary Care Access
For each child, the number of pediatricians within their calculated thirty-minute drive time distance was determined. We then used kernel density estimation to visualize the highest concentrations of children with no pediatrician present in their drive time radius. The geocoded locations of other potential primary care providers for children under five were then placed on the density map.
All data manipulation and mapping, and geocoding was performed using ESRI ArcMap® 10.5.1 software.25 The OUHSC Institutional Review Board determined that this research did not qualify as human subjects research.
Results
The estimate for the total population under five years of age for the state of Oklahoma from the ACS 2012–2016 data was 265,818 children distributed among 2,965 census block groups.29 Children were distributed throughout Oklahoma with concentrations, as expected, in the urban areas of Oklahoma City, Tulsa, Lawton and Enid (Figure 1). There were 662 pediatricians identified from the NPI database with a business address in Oklahoma. Three additional pediatricians were identified with manual search, and eleven pediatricians (in six sites) were identified as SoonerCare providers with addresses in Kansas, Missouri, Arkansas, or Texas. Several additional providers who self-identified as pediatricians were located using the manual search, but had either moved or were not identified as board certified pediatricians, so were not included in the analysis. There were an additional 4,251 primary care providers for a total of 4,927 providers (Pediatricians, Family Practice physicians, as well as Nurse Practitioners and Physician’s Assistants with similar designations) who could see children in Oklahoma.10
Figure 1:
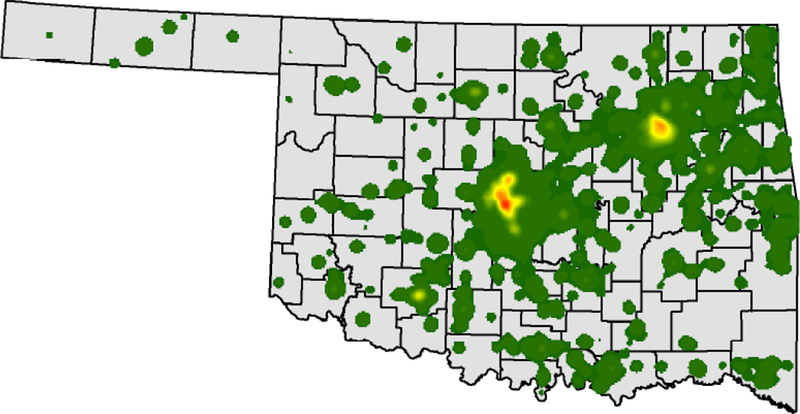
Population density of children under five in Oklahoma 2012–2016
The colors gray to dark green to red reflect increasing concentrations of children under five.
Of the estimated 265,818 children, approximately half had imputed locations more than a thirty-minute drive time from either major pediatric hospital in Oklahoma (Figure 1). These children were located throughout Oklahoma but there were concentrations of children in central Oklahoma and concentrations west of Stillwater, up into Pawhuska, down near Okmulgee, with a corridor west of the Oklahoma City metropolitan area from western Canadian county north to Major county through Blaine and Caddo counties. Also, there was a concentration in northwestern Oklahoma near Woodward, and concentrations in the eastern part of Oklahoma in Delaware County, Le Flore County near Fort Smith, and in Haskell, northern Latimer and eastern Pittsburg Counties. Finally, there were concentrations in southern Oklahoma in Choctaw and Marshall Counties, with a few other scattered hot spots.
Of the 676 pediatricians, 170 (25%) reported a primary practice location more than thirty minutes from the major pediatric centers (Figure 2). Of the 4,251 additional primary care providers, 2,053 (48%) reported a primary practice location more than thirty minutes from these centers (data not shown). While there were gaps in access to pediatricians, there were minimal gaps in Oklahoma without geographic access to primary care (data not shown).
Figure 2:
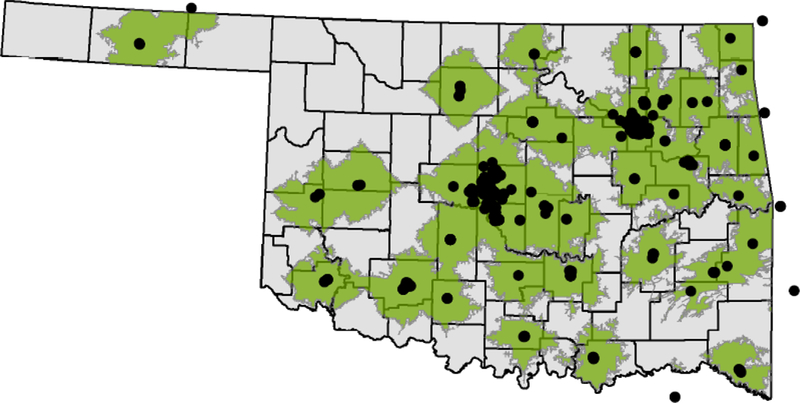
Pediatricians in Oklahoma as well and pediatricians near Oklahoma accepting SoonerCare 2018 with thirty-minute drive times.
1. Each black dot represents a pediatrician.
2. The green represents a 30 minite drive time around the black dot.
Overall in Oklahoma an estimated 18,669 (7%) of children had no pediatrician within thirty minutes driving distance (Figure 3) of their homes. The areas with highest concentration of these children were centered in northwestern and southeastern Oklahoma, but there were also several other areas with less intense concentrations of children lacking pediatric access. Examining all primary care providers, less than 0.1% of children younger than five had no primary care provider within thirty minutes driving distance (Figure 4) of their homes.
Figure 3:
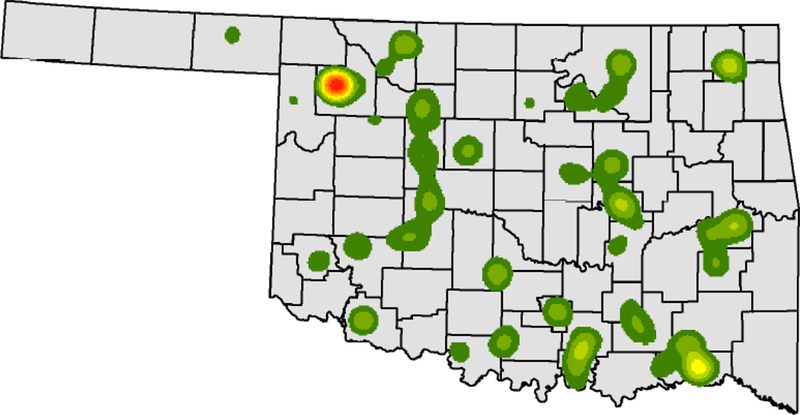
Density of children under five in Oklahoma outside of a thirty-minute drive time from a pediatrician.
The colors gray to dark green to red reflect increasing concentrations of children under five outside of a thirty-minute drive time from a pediatrician.
Figure 4:
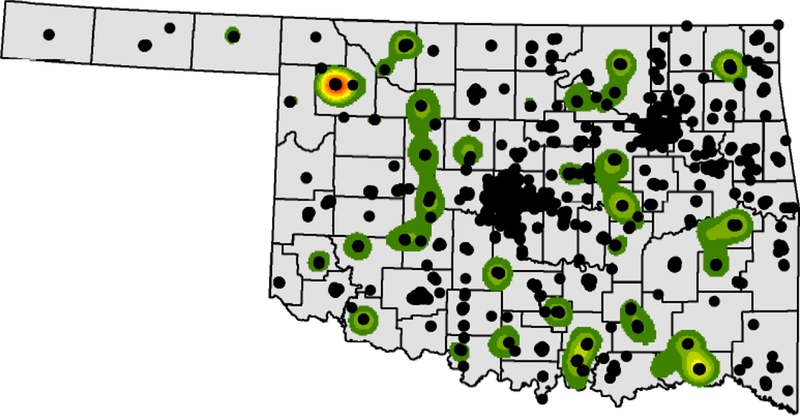
Density of children under five in Oklahoma outside of a thirty-minute drive time from a pediatrician with locations of other potential primary care sites.
1. The colors gray to dark green to red reflect increasing concentrations of children under five who are more than a 30 minute drive time from a pediatrician.
2. The black dots represent primary care providers other than pediatricians.
Discussion
As a state, Oklahoma has an overall shortage of primary care providers, as noted in two recent articles examining primary care workforce, including an analysis of state readiness for Medicaid expansion, which noted that Oklahoma had the poorest primary care capacity in the US.12,30 Geographic access matters to people’s health care seeking behaviors, and physician distribution, independent of other factors that impact access (such as insurance status, costs, and personal factors), is correlated with children’s health. In a 2010 analysis, Guttmann and colleagues specifically examined pediatric hospitalizations for acute and chronic conditions and found an inverse relationship with physician density.6
Nationwide, pediatricians see the large majority of health supervision and sick visits for young children.31,32 However, from the geographic distribution it appears likely that non-pediatricians are shouldering a substantial proportion of the burden for care of those under five in Oklahoma. Family practice providers, especially, can expand into regions where pediatricians cannot because their payer base spans the whole age range, so they require a smaller total population to maintain a viable practice. Current estimates are that ideal physician to patient ratio is 1:2000, true also for the pediatric population.33 In a community such as Woodward, the area identified with the greatest concentration of children outside of the driving range of a pediatrician, total population of the city itself (not including outlying areas) was approximately 12,500 people, and 2016 census ACS estimates are that approximately 3,500 individuals were under the age of 17.29 A community of this size may be able to support a pediatrician, but many smaller communities could not.
As measured by area, 46% percent of Oklahoma is outside of thirty minute drive from a pediatrician, but much of this area has a low population concentration relative to the rest of the state. Identifying the population clusters of children under five in the state who are outside of the reasonable drive time of a pediatrician but who are within reach of other primary care providers highlights areas for collaboration across specialties and provider types. Collaborative efforts between the pediatric tertiary care centers in the state, community pediatricians, family practice physicians, and mid-level providers would benefit all parties. This could be particularly helpful for at risk populations of young children, as it has been shown that barriers to care can differentially affect those children with special healthcare needs.34 Telemedicine is being explored as an option for these children in some settings to alleviate access burdens, and could be explored in Oklahoma’s rural areas.35,36 Novel uses of telemedicine that could be used as a model are already being developed in the state, such as the partnership focusing on neonates in Comanche County.37 Another technology based option would be an enhanced triage system that could be accessed by practitioners in these areas, with on-call pediatricians available for consultation. Additionally, many practitioners residing in these most underserved areas received part of their training at the tertiary care facilities. Residency programs could work collaboratively to offer enhanced pediatric training options to providers who are planning to establish practice in the most at risk areas, and continuing medical education offerings could be made more accessible to providers already practicing in these regions. Already a combination of telemedicine and education is being used in some states to expand capacity.38
There are several limitations to this analysis. First, children’s locations are imputed based on overall population data combined with ACS census block groups estimates. While this is likely a superior approximation to using a centroid of a ZIP code or census block group as the location for all children in the geographic area, the exact location of each child is still unknown. Second, for providers, NPI designations can be out of date or inaccurate. We endeavored to mitigate this limitation with our manual search; however, it is possible that inaccuracies remain. Pediatricians located in our manual search were either Med/Peds trained or at tribal facilities, so it is possible that there are additional similar providers that are difficult to locate using our search methods. Third, this is not an analysis of primary care capacity, only of geographic distribution. The NPI designations used for the search identified all providers that could be reasonably expected to have received training to administer primary care to children, but some of these providers may not see children under five, may work only in urgent care or other settings, or may work only part time in clinical medicine. The next step in this analysis is combine our analysis with billing data to identify definitively provider capacity for primary care services to children under age five. Finally, all population calculations are based in census estimates. More in depth statistical analysis will be required to fully quantify the uncertainty of the models used in this analysis.
Conclusions
Large portions of the state are not within reasonable travel time of pediatricians. Regions in northwestern and southeastern Oklahoma have the highest concentrations of children under five that are out of range of pediatricians. These should be areas of focus for collaboration between local providers and the other pediatric resources in the state.
Acknowledgements
Research reported in this publication was supported by the National Institutes of Health under Award Numbers UG1OD024950 and U54GM104938. The content is solely the responsibility of the authors and does not necessarily represent the official views of the National Institute of Health.
Footnotes
Conflicts of Interest and Disclosures
None.
References
- 1.Gibson OR, Segal L, McDermott RA. A systematic review of evidence on the association between hospitalisation for chronic disease related ambulatory care sensitive conditions and primary health care resourcing. BMC health services research. 2013;13:336. [DOI] [PMC free article] [PubMed] [Google Scholar]
- 2.Caminal J, Starfield B, Sanchez E, Casanova C, Morales M. The role of primary care in preventing ambulatory care sensitive conditions. Eur J Public Health. 2004;14(3):246–251. [DOI] [PubMed] [Google Scholar]
- 3.Ray KN, Olson LM, Edgerton EA, et al. Access to High Pediatric-Readiness Emergency Care in the United States. J Pediatr. 2018;194:225–232 e221. [DOI] [PMC free article] [PubMed] [Google Scholar]
- 4.Wallace DJ, Ray KN, Degan A, Kurland K, Angus DC, Malinow A. Transportation characteristics associated with non-arrivals to paediatric clinic appointments: a retrospective analysis of 51 580 scheduled visits. BMJ Qual Saf. 2018;27(6):437–444. [DOI] [PMC free article] [PubMed] [Google Scholar]
- 5.Yen W How Long and Far Will Adults Travel for Primary Care? Research Brief No. 70. Washington State: Health Services Research Project;2013. [Google Scholar]
- 6.Guttmann A, Shipman SA, Lam K, Goodman DC, Stukel TA. Primary care physician supply and children’s health care use, access, and outcomes: findings from Canada. Pediatrics. 2010;125(6):1119–1126. [DOI] [PubMed] [Google Scholar]
- 7.Berdahl T, Owens PL, Dougherty D, McCormick MC, Pylypchuk Y, Simpson LA. Annual report on health care for children and youth in the United States: racial/ethnic and socioeconomic disparities in children’s health care quality. Acad Pediatr. 2010;10(2):95–118. [DOI] [PubMed] [Google Scholar]
- 8.Berdahl TA, Friedman BS, McCormick MC, Simpson L. Annual Report on Health Care for Children and Youth in the United States: Trends in Racial/Ethnic, Income, and Insurance Disparities Over Time, 2002–2009. Academic Pediatrics. 2013;13(3):191–203. [DOI] [PubMed] [Google Scholar]
- 9.Shipman SA, Lan J, Chang C-h, Goodman DC. Geographic Maldistribution of Primary Care for Children. Pediatrics. 2010. [DOI] [PMC free article] [PubMed] [Google Scholar]
- 10.Centers for Medicare and Medicaid Services. National Provider Identifier Standard (NPI) - Data Dissemination. 2018; https://www.cms.gov/Regulations-and-Guidance/Administrative-Simplification/NationalProvIdentStand/DataDissemination.html. Accessed June 4, 2018.
- 11.American Board of Pediatrics. Pediatric Physicians Workforce Data Book, 2017–2018. Chapel Hill, NC: American Board of Pediatrics; 2018. [Google Scholar]
- 12.Ku L, Jones K, Shin P, Bruen B, Hayes K. The states’ next challenge--securing primary care for expanded Medicaid populations. N Engl J Med. 2011;364(6):493–495. [DOI] [PubMed] [Google Scholar]
- 13.Health Resources and Services Administration. HRSA Data Warehouse: Shortage Areas. 2018; https://datawarehouse.hrsa.gov/topics/shortageareas.aspx. Accessed August 9, 2018.
- 14.Hagan JR SJ, Duncan PM, eds.,. Bright Futures: Guidelines for Health Supervision of Infants, Children, and Adolescents. 4th ed. Elk Grove Village, IL: American Academy of Pediatrics; 2017. [Google Scholar]
- 15.American Academy of Pediatrics. Immunization Schedules. 2018; https://www.aap.org/en-us/advocacy-and-policy/aap-health-initiatives/immunizations/Pages/Immunization-Schedule.aspx. Accessed June 4, 2018.
- 16.Ehara A Children’s access to major hospitals estimated to provide pediatric inpatient services 24 h a day in Japan. Eur J Pediatr. 2018;177(4):559–565. [DOI] [PubMed] [Google Scholar]
- 17.ESRI Techinal Support. GIS Dictionary - MAUP. 2018; https://support.esri.com/en/other-resources/gis-dictionary/term/MAUP. Accessed June 4, 2018.
- 18.Henry KA, Boscoe FP. Estimating the accuracy of geographical imputation. International journal of health geographics. 2008;7:3. [DOI] [PMC free article] [PubMed] [Google Scholar]
- 19.Hibbert JD, Liese AD, Lawson A, et al. Evaluating geographic imputation approaches for zip code level data: an application to a study of pediatric diabetes. International journal of health geographics. 2009;8:54. [DOI] [PMC free article] [PubMed] [Google Scholar]
- 20.Walter SR, Rose N. Random property allocation: A novel geographic imputation procedure based on a complete geocoded address file. Spatial and spatio-temporal epidemiology. 2013;6:7–16. [DOI] [PubMed] [Google Scholar]
- 21.Dilekli N, Janitz AE, Campbell JE, de Beurs KM. Evaluation of geoimputation strategies in a large case study. Int J Health Geogr. 2018;17(1):30. [DOI] [PMC free article] [PubMed] [Google Scholar]
- 22.TIGER/Line® with Selected Demographic and Economic Data. United States Department of Commerce, Economic and Statistics Administration; 2017. https://www.census.gov/geo/maps-data/data/tiger-data.html. Accessed June 13, 2018. [Google Scholar]
- 23.United States Census Bureau. 2010 Geographic Terms and Concepts. 2018; https://www.census.gov/geo/reference/terms.html. Accessed June 22, 2018.
- 24.Oak Ridge National Laboratory. LandScan (Geographic Information Science and Technology). 2018. Accessed July 6, 2018. [Google Scholar]
- 25.ArcGIS Desktop: Release 10.5.1 [computer program]. Redlands CA: Environmental Systems Research Insitute; 2011. [Google Scholar]
- 26.Python Software Foundation. Python Language Reference, version 2.7. http://www.python.org. Accessed June 19, 2018.
- 27.CMS/ Center for Program Integrity/Provider Enrollment Oversight Group/Division Enrollment Operations. Crosswalk Medicare Provider/Supplier to Healthcare Provider Taxonomy. 2017. [Google Scholar]
- 28.Oklahoma Healthcare Authority. SoonerCare Provider Directory (as of 7/23/18). Oklahoma Healthcare Authority; 2018. [Google Scholar]
- 29.United States Census Bureau. Geography - TIGER/Line with Selected Demographic and Economic Data. 2018; https://www.census.gov/geo/maps-data/data/tiger-data.html. Accessed June 13, 2018.
- 30.Huang ES, Finegold K. Seven Million Americans Live In Areas Where Demand For Primary Care May Exceed Supply By More Than 10 Percent. Health Affairs. 2013;32(3):614–621. [DOI] [PubMed] [Google Scholar]
- 31.American Academy of Pediatrics. Profile of Pediatric Visits. American Academy of Pediatrics; Elk Grove Village, IL: 2010. [Google Scholar]
- 32.Basco WT, Rimsza ME, Committee on Pediatric W, American Academy of P. Pediatrician workforce policy statement. Pediatrics. 2013;132(2):390–397. [DOI] [PubMed] [Google Scholar]
- 33.DeAngelis C, Feigin R, DeWitt T, et al. Final report of the FOPE II Pediatric Workforce Workgroup. Pediatrics. 2000;106(5):1245–1255. [PubMed] [Google Scholar]
- 34.Cheak-Zamora NC, Thullen M. Disparities in Quality and Access to Care for Children with Developmental Disabilities and Multiple Health Conditions. Matern Child Health J. 2017;21(1):36–44. [DOI] [PubMed] [Google Scholar]
- 35.Hooshmand M, Foronda C. Comparison of Telemedicine to Traditional Face-to-Face Care for Children with Special Needs: A Quasiexperimental Study. Telemed J E Health. 2017. [DOI] [PubMed] [Google Scholar]
- 36.Hooshmand M, Yao K. Challenges Facing Children with Special Healthcare Needs and Their Families: Telemedicine as a Bridge to Care. Telemed J E Health. 2017;23(1):18–24. [DOI] [PubMed] [Google Scholar]
- 37.Makkar A, McCoy M, Hallford G, Escobedo M, Szyld E. A Hybrid Form of Telemedicine: A Unique Way to Extend Intensive Care Service to Neonates in Medically Underserved Areas. Telemed J E Health. 2018. [DOI] [PubMed] [Google Scholar]
- 38.University of New Mexico School of Medicine. Project ECHO. 2018; https://echo.unm.edu/. Accessed August 12, 2018.