Abstract
Valence-to-Core (VtC) X-ray emission spectroscopy (XES) was used to directly detect the presence of an O-O bond in a complex comprising the [Cu2(II)(µ-η2:η2-O2)]2+ core relative to its isomer with a cleaved O-O bond having a [Cu(III)2(µ-O)2]2+ unit. The experimental studies are complemented by DFT calculations, which show that the unique VtC XES feature of the [Cu2(II)(µ-η2:η2-O2)]2+core corresponds to the copper stabilized in-plane 2p π peroxo molecular orbital. These calculations illustrate the sensitivity of VtC XES for probing the extent of O-O bond activation in µ-η2:η2-O2 species and highlight the potential of this method for time-resolved studies of reaction mechanisms.
Keywords: copper, DFT, oxygen, peroxide, x-ray emission spectroscopy
Graphical Abstract
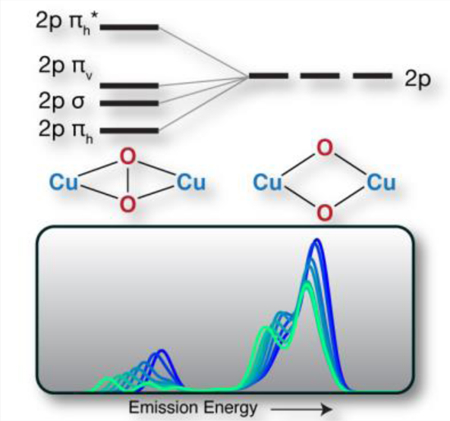
Valence-to-Core (VtC) X-ray emission spectroscopy (XES) is shown to be a sensitive probe of the presence or absence of an O-O bond in Cu2O2 dimers possessing [Cu2(II)(µ-η2:η2-O2)]2+ and [Cu(III)2(µ-O)2]2+ cores, respectively.
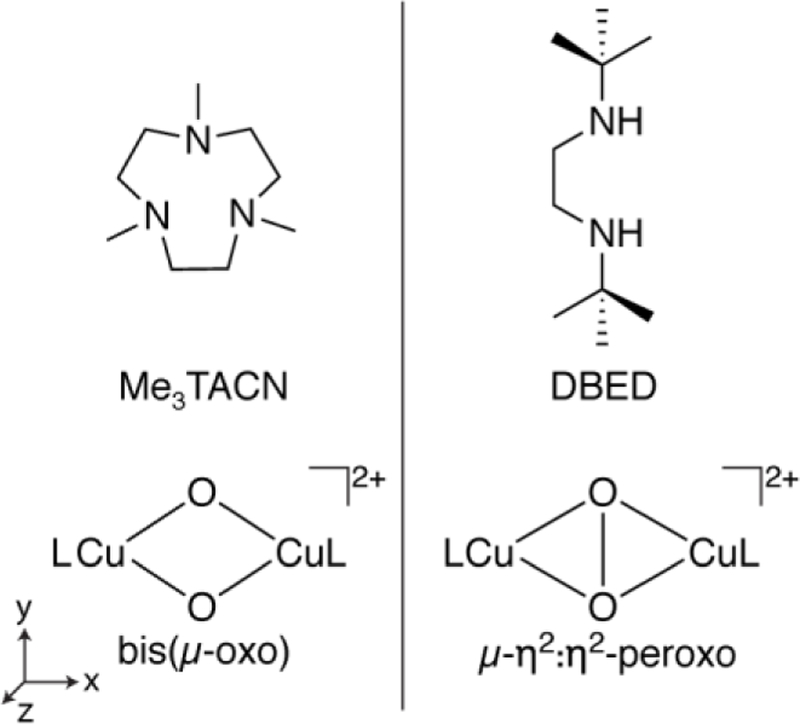
The fundamental chemistry of O-O bond cleavage and formation is important in a broad range of essential processes in nature, including respiration and photosynthesis. Proteins employ various metal ions to facilitate O2 activation chemistry, including Cu.[1] Dicopper enzymes such as hemocyanin, tyrosinase and catechol oxidase have been shown to bind O2 and form a side-on bound [Cu2(II)(µ-η2:η2-O2)]2+ (µ-η2:η2-peroxo) core, Scheme 1.[2] The O-O bonds in these intermediates are significantly activated, as indicated by reduced O-O vibrational energies of ~750 cm−1 compared to the typical 850–900 cm-1 value for metal peroxos.[1] Numerous complexes with [Cu2(II)(µ-η2:η2-O2)]2+ cores have been synthesized.[3] Some of these cores interconvert to an isomeric [Cu(III)2(µ-O)2]2+ (bis(µ-oxo)) structure, where the O-O bond is cleaved (Scheme 1).[3–4] The interconversion between these core motifs can have a low activation barrier, raising interesting questions as to the mechanistic relevance of each.[3a, 4d, 5]
Scheme 1.
To this end, it is of interest to develop spectroscopic probes of O-O bond activation that selectively interrogate the copper site and are amenable to potential time-resolved studies. Herein, we explore the ability of Valence-to-Core (VtC) X-ray emission spectroscopy (XES) to directly characterize the presence of an O-O bond in dicopper complexes and to measure the degree of O-O bond activation in [Cu2(II)(µ-η2:η2-O2)]2+ cores. As VtC XES features arise from electrons in ligand-based valence orbitals refilling the 1s core-hole of a photoabsorber (in this case a Cu 1s), the resultant spectrum yields significant chemical information, including: ligand identity, covalency, and bond strength.[6] In addition, the previous demonstration of VtC XES to characterize the degree of bond activation for N2 is strong motivation to use this method to probe O-O bond activation.[6b] The present studies form a foundation for future time-resolved studies of model complexes and enzymes.
For the present work, two dicopper-oxygen complexes comprising the two isomeric cores (Scheme 1) were synthesized and isolated as frozen solutions (~20 mM) in THF for X-ray spectroscopic studies. The µ-η2:η2-peroxo core[7] with an O-O bond was supported with N,N’-di-tert-butyl-ethylenediamine (DBED). The isomeric bis(µ-oxo) core[8] was supported with 1,4,7-trimethyl-1,4,7-triazacyclononane (Me3TACN). The ligands were chosen because of their similar alkyl amino donor characteristics and their known propensity to fully form a single copper oxygen core structure (rather than a mixture of both) without apparent isomerization.[3a, 4b] The Cu K-edge X-ray absorption spectra (Figure S1) of [(DBED)2Cu2(µ-η2:η2-O2)](SbF6)2 and [(Me3TACN)2Cu2(µ-O)2](CF3SO3)2 have pre-edge and edge energies consistent with formal Cu(II) and Cu(III) oxidation-state assignments, respectively, as previously established, confirming the identity of the studied complexes.[9]
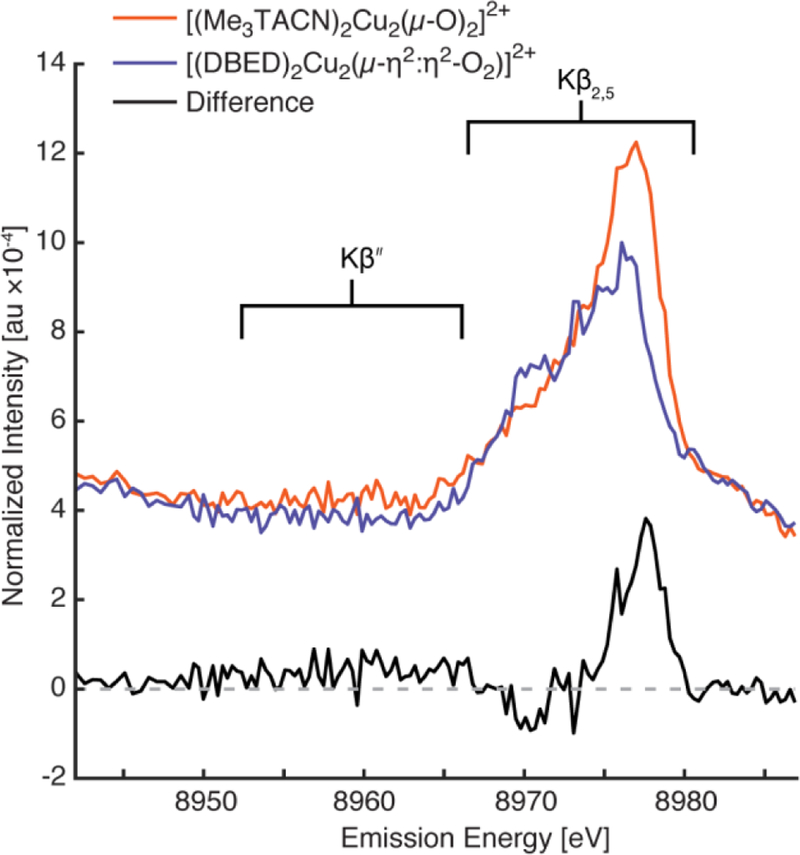
The non-resonant VtC XES spectra[10] of [(Me3TACN)2Cu2(µ-O)2]2+ and [(DBED)2Cu2(µ-η2:η2-O2)]2+ exhibit subtle differences in both the Kβ2,5 and Kβʺ regions (Figure 1). The VtC XES of [(Me3TACN)2Cu2(µ-O)2]2+ exhibits a single, broad, Kβ2,5 feature at ~8976 eV, with slight asymmetry to lower energy. A weak broad Kβʺ feature for [(Me3TACN)2Cu2(µ-O)2]2+ centered at ~8961 eV is observed, which appears to be absent in the spectrum of [DBED2Cu2(µ-η2:η2-O2)]2+, and is discerned more clearly in the difference spectrum. Additionally, [(DBED)2Cu2(µ-η2:η2-O2)]2+ exhibits a less intense Kβ2,5 region compared to [(Me3TACN)2Cu2(µ-O)2]2+, but possesses a distinct shoulder feature at ~8970 eV. This unique shoulder is more easily observed in the difference spectrum, Figure 1, black. Lastly, [(Me3TACN)2Cu2(µ-O)2]2+ clearly has more Kβ2,5 intensity at 8976 eV, as apparent in the difference spectrum.
Figure 1.
VtC XES of [(Me3TACN)2Cu2(µ-O)2]2+ (red) and [(DBED)2Cu2(µ-η2:η2-O2)]2+ (blue). Both VtC XES intensities are normalized to the Kβ mainline energy (not shown) integrated area of 1. The difference of the two spectra ([(Me3TACN)2Cu2(µ-O)2]2+ – [(DBED)2Cu2(µ-η2:η2-O2)]2+) is exhibited below (black) with a dashed horizontal guideline at zero intensity. [(DBED)2Cu2(µ-η2:η2-O2)]2+ exhibits a unique shoulder at the low energy side of its Kβ2,5 peak (~8970 eV) that appears as a negative peak in the difference spectrum. A broad Kβ’’ feature for [(Me3TACN)2Cu2(µ-O)2]2+ is observed centered at ~8961 eV that also appears as a broad positive peak in the difference spectrum.
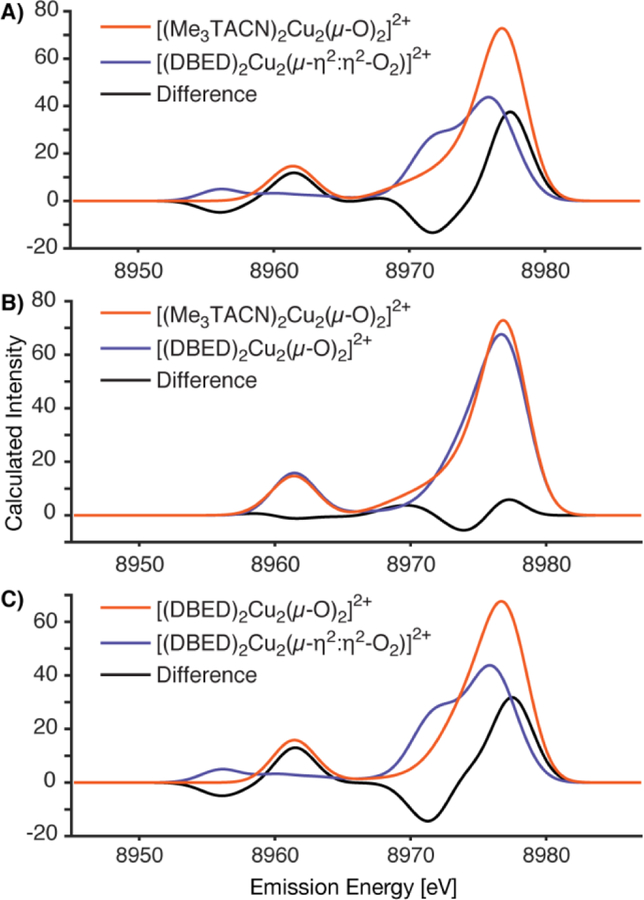
In order to understand the origins of the spectral differences, we calculated the VtC XES using ground state DFT protocols. Calculation of the VtC XES from ground-state DFT within a simple one-electron picture allows for the individual valence transition energies and their intensities to be estimated.[11] Figure 2A shows the calculated VtC XES spectra of [(Me3TACN)2Cu2(µ-O)2]2+ and [(DBED)2Cu2(µ-η2:η2-O2)]2+ based on geometry optimized structures. The optimized geometries are in good agreement with previously reported related dicopper complexes.[3a-c, 4a, 4b] Thus, [(DBED)2Cu2(µ-η2:η2-O2)]2+ has an O-O bond distance of 1.485 Å and the calculated dicopper distance is 3.586 Å, in reasonable agreement with the EXAFS determined distance of 3.45 Å.[7] The O-O distance in [(Me3TACN)2Cu2(µ-O)2]2+ is 2.340 Å, reflecting the absence of an O-O bond. The calculated dicopper distance of [(Me3TACN)2Cu2(µ-O)2]2+ is 2.833 Å, in agreement with the 2.77 Å distance also measured by EXAFS.[8]
Figure 2.
The calculated Cu VtC XES spectra of complexes [(Me3TACN)2Cu2(µ-O)2]2+ and [(DBED)2Cu2(µ-η2:η2-O2)]2+ are exhibited in panel A. Minimal differences between calculated spectra are observed for the [(DBED)2Cu2(µ-O)2]2+ and [(Me3TACN)2Cu2(µ-O)2]2+ complexes, panel B. Significant differences between the [(DBED)2Cu2(µ-O)2]2+ and [(DBED)2Cu2(µ-η2:η2-O2)]2+ are observed with the same supporting ligand, panel C.
The calculated VtC XES spectra qualitatively match that of the observed experiment quite well (Figures 1 and 2A), in particular as seen in the calculated difference spectra in the Kβ2,5 regions. The unique VtC features for each complex may arise from the different oxygen moieties and/or the different supporting ligands used. The effect of the ligand on the VtC XES may be tested in silico by calculating the same bis(µ-oxo) core structure with both the Me3TACN and DBED supporting ligands, Figure 2B. Despite the ligand differences, the calculated spectra are remarkably similar. Therefore, it appears that the ligands utilized in this study have approximately equivalent contributions to the VtC XES spectra and are not readily distinguishable.
To probe the effects of the oxygen core motif on the VtC spectra, the same DBED supporting ligand was used for the calculation of both µ-η2:η2-peroxo and bis(µ-oxo) core structures (Figure 2C). Here, significant differences between the VtC XES spectra are observed, where [(DBED)2Cu2(µ-η2:η2-O2)]2+ exhibits a unique shoulder in the Kβ2,5 region at 8971 eV and a weak Kβʺ feature shifted to lower energy. These results closely resemble those calculated for the complexes shown in Figure 2A. We conclude from the calculated spectra shown in Figure 2 that the use of the two differing supporting ligands in this study does not significantly impact the VtC spectra. Hence, the differences observed in the VtC spectra for [(Me3TACN)2Cu2(µ-O)2]2+ and [(DBED)2Cu2(µ-η2:η2-O2)]2+ in Figure 1 are predominately signatures of the oxygen core and establish that VtC XES spectra are sensitive to the presence of an O-O bond.
Further insight into the observed differences of the spectra were gained through DFT analysis. VtC XES spectra primarily gain intensity by metal p character mixing into the ligand orbitals. Intense VtC XES features are commonly the result of significant σ-type metal-ligand interactions. Therefore, ligand p orbitals that can directly overlap with the metal orbitals are the dominant contributor to the Kβ2,5 region.[11b] Ligand s orbitals are at deeper binding energy than the ligand p and are also less available for overlap as they are more localized on the ligand, yielding weaker features (generally in the lower Kβ” energy region).[11b] Since in a ground-state DFT approach the VtC XES transition energies are obtained by calculating a simple energy difference between Kohn-Sham orbitals, one can readily relate the calculated transitions back to the molecular orbitals involved. Here, we explore the character of each VtC feature and its origin by viewing the MOs of the corresponding transitions.
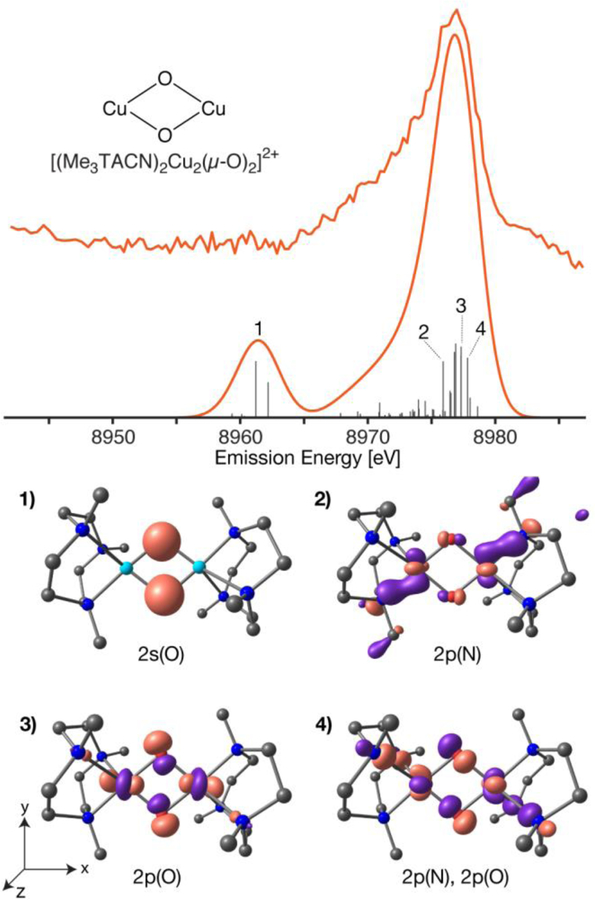
The calculated VtC XES spectrum of [(Me3TACN)2Cu2(µ-O)2]2+, Figure 3, exhibits only two broad features, the Kβ” at ~8961 eV and the Kβ2,5 centered at ~8976 eV. Inspection of the MO contributions to the Kβ’’ reveals isolated 2s oxygen MOs of the µ-oxo ligands, labeled as 1 in Figure 3. This feature is actually split (but unresolved experimentally), as it is a combination of the oxygen 2s(α),2s(α) and 2s(α),2s(β) orbitals (Figure S2) in the open-shell calculation. The Kβ2,5 transitions are comprised of highly covalent molecular orbitals that are dominated by oxygen 2p (Figure 3, transitions 2,3 and 4) and (to a lesser extent) nitrogen 2p from the supporting ligand at approximately the same energy. The highly covalent nature of the Cu-O bonds means that the Cu2O2 moiety provides the dominate intensity mechanism for the VtC region. Hence, in a simplified picture, one can think of the features arising from the O 2s contributions at lower energy and the O 2p (mixed with N 2p) at higher energy (Figure 3 and S2).
Figure 3.
Experiment and DFT calculated VtC XES of [(Me3TACN)2Cu2(µ-O)2]2+ (top) with individual transitions (grey sticks, multiplied by a factor of 5). The corresponding molecular orbitals of numbered transitions are depicted (bottom) with an isosurface value σ = 0.07, except transition 1 at σ = 0.10. The calculated spectrum has a uniform 3.5 eV Gaussian broadening and a 230.2 eV shift. Alpha MO, pink; beta MO, purple; copper, cyan; nitrogen, blue; oxygen, red; carbons, black; hydrogens omitted.
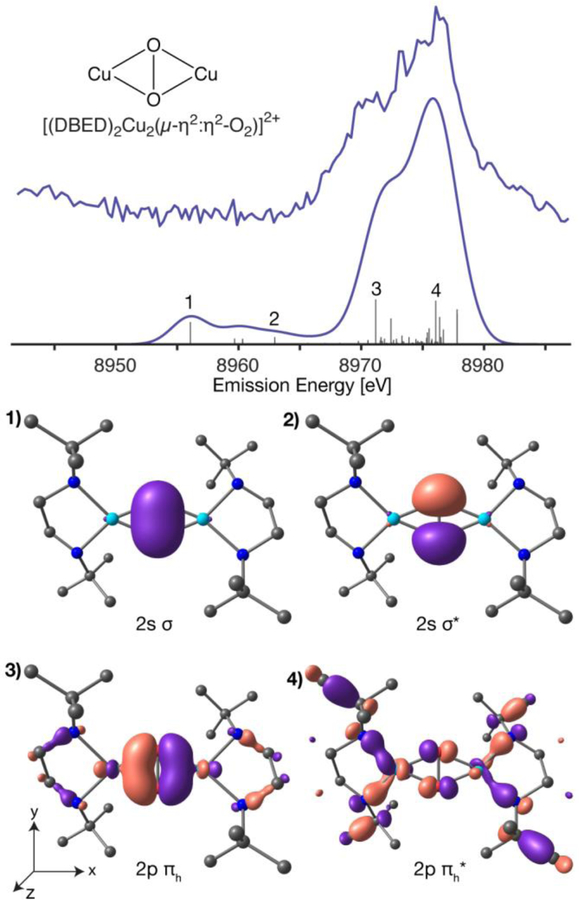
The calculated VtC XES spectrum of [DBED2Cu2(µ-η2:η2-O2)]2+, Figure 4, qualitatively reproduces the experimental VtC spectrum, particularly the splitting of the Kβ2,5 region.
Figure 4.
Experiment and DFT calculated VtC XES of [DBED2Cu2(µ-η2:η2-O2)]2+ (top) with individual transitions (grey sticks, multiplied by a factor of 5). The corresponding molecular orbitals of numbered transitions are depicted (bottom) with an isosurface value σ = 0.1. The calculated spectrum has a uniform 3.5 eV Gaussian broadening and a 230.2 eV applied shift. Alpha MO, pink; beta MO, purple; copper, cyan; nitrogen, blue; oxygen, red; carbons, black; hydrogens omitted.
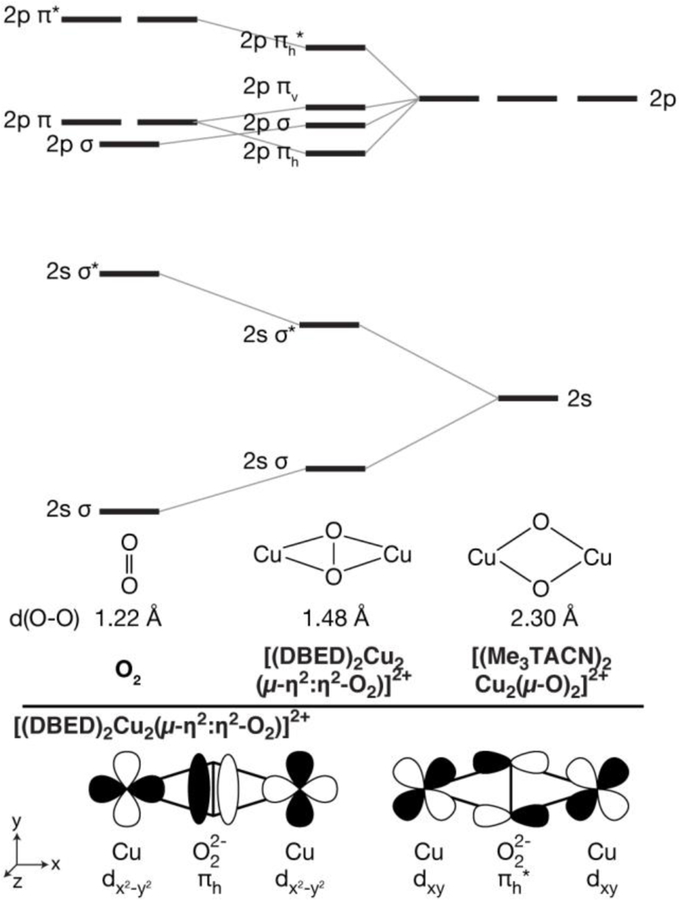
As [(DBED)2Cu2(µ-η2:η2-O2)]2+ retains the O-O bond, the localized ligand 2s and 2p orbital description used to discuss [(Me3TACN)2Cu2(µ-O)2]2+ is no longer sufficient. Instead, one must consider the molecular orbital diagram of a free peroxo ligand and how this is modulated by interactions with Cu. Figure 5 depicts the classic MO diagram of O2, in which the 2s2s σ/σ* energy is split due to the presence of an O-O double bond, and the 2p-2p interactions result in 2p σ/σ* and 2p π/π* MOs (the coordinate axis is depicted at the bottom of Figure 5). Upon interaction with the Cu, the degenerate 2p π orbitals of the peroxo split into a single π orbital in the horizontal plane, πh, Figure 5 bottom, and a single π perpendicular to the plane, or vertical out of the plane, πv. The πh orbital is highly stabilized by favorable overlap with the Cu dx2-y2 orbitals of [(DBED)2Cu2(µ-η2:η2-O2)]2+ and the backdonation of the Cu singly occupied molecular orbital (SOMO) dxy into the O22– πh* leads to O2 bond activation.[12]
Figure 5.
(Top) Qualitative oxygen focused orbital energy diagram of dioxygen, [DBED2Cu2(µ-η2:η2-O2)]2+, and [(Me3TACN)2Cu2(µ-O)2]2+. (Bottom) Walsh orbital diagram of the in-plane O22– binding, πh, and antibonding, πh*, orbitals.
Here again, inspection of the dominant transitions and the corresponding MOs reveals that the prominent Kβ”feature is comprised of the oxygen 2s orbitals, particularly the 2s2s σ-bonding orbital at 8958.9 eV (Figure 4, transition 1) and the σ* antibonding counterpart at 8965.8 eV (Figure 4, transition 2), a ~6.9 eV separation. The 1.48 Å O-O bond distance in O-O distance in [DBED2Cu2(µ-η2:η2-O2)]2+ is longer than a geometry optimized O2– molecular distance of 1.37 Å and, as expected, molecular O2– therefore has a larger 2s2s σ/σ* separation of 8 eV. The additional donation of the Cu SOMO into the peroxo πh* further activates the peroxo moiety, increasing its O-O bond distance and decreasing the calculated 2s2s σ/σ* separation.
The calculated 2s2s σ/σ* separation for [(DBED)2Cu2(µ-η2:η2-O2)]2+ is slightly larger, but comparable to the ~6.5 eV separation previously observed for a Mn(III)-trans-µ−1–2-peroxo which possesses a similar O-O bond distance of 1.452 Å.[13] These 2s2s σ/σ* separations for bound peroxo ligands are significantly smaller than those observed in VtC spectra of an end-on iron bound N2 molecule (~12 eV).[6b] The larger 2s2s σ/σ* energy difference for N2 clearly reflects the triple bond order compared to the single bond of O22–. While the large splitting observed for N2 results in a unique 2s σ* feature in the Kβ2,5 region of the iron VtC XES, here, the smaller σ-σ* splitting only broadens the Kβ’’ region of [(DBED)2Cu2(µ-η2:η2-O2)]2+. Thus, the entire Kβ’’ region appears less intense than the Kβ’’ region of [(Me3TACN)2Cu2(µ-O)2]2+ and no well-resolved features are present. While the energy of the 2s2s σ* in the VtC XES may be used as measure of O2 activation, as suggested by previous studies, such experiments are limited by the low intrinsic intensity and increased broadening observed in this spectral region. [6b, 13–14]
However, as already shown experimentally and supported by calculations, VtC XES in the Kβ2,5 region is sensitive to the presence or absence of the O-O bond. As depicted in Figure 4, additional peroxo-derived VtC XES features would arise from one or a combination of the πh, πv, and 2pz σ orbitals. As VtC XES is comprised of dipole-allowed transitions, the donor MO must have a significant amount of Cu 4p character. For [(DBED)2Cu2(µ-η2:η2-O2)]2+, the Cu px orbitals have optimal overlap with the peroxo πh, Figure 6, yielding a potential VtC XES transition. The out-of-plane πv orbital has less overlap with the metal pz orbitals, resulting in lower VtC intensity. The peroxo 2p σ orbital has very poor overlap with any Cu p orbitals and will therefore have minimal VtC intensity. From the Walsh orbital model of possible VtC XES donor MOs, the in-plane πh peroxo MO is anticipated to have the largest contribution to the observed spectrum. Inspection of the corresponding MO of the shoulder feature at 8971.2 eV reveals that the transition is primarily comprised of the peroxo πh MO, Figure 4, transition 3. The corresponding πh* antibonding orbital is found ~4.8 eV higher, under the main Kβ2,5 peak (Figure 4, transition 4). The remaining intensity of the Kβ2,5 at the high-energy end is comprised of diffuse N p and Cu d contributions, Figure S3, similar to that observed in [(Me3TACN)2Cu2(µ-O)2]2+.
Figure 6.
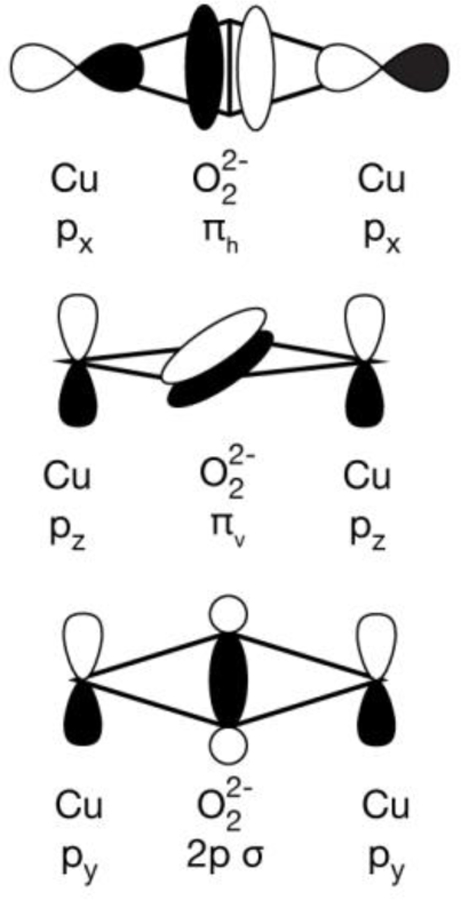
Walsh orbital diagrams of peroxo centered Cu VtC donor MOs
To further test the sensitivity of VtC XES for the measurement of O2 bond activation, a relaxed surface scan of the O-O bond distance from 1.48 Å to 2.3 Å with cores supported by DBED were performed. The resulting VtC XES spectra, Figure 7, reveal a clear systematic trend. The pronounced low energy shoulder of the Kβ2,5 is present at short O-O distances typical of peroxos, and moves to higher energy as the distance is increased. The 2s σ-σ* splitting of the Kβ’’ also decreases with increasing O-O distances until it collapses into a single intense Kβ’’ feature.
Figure 7.
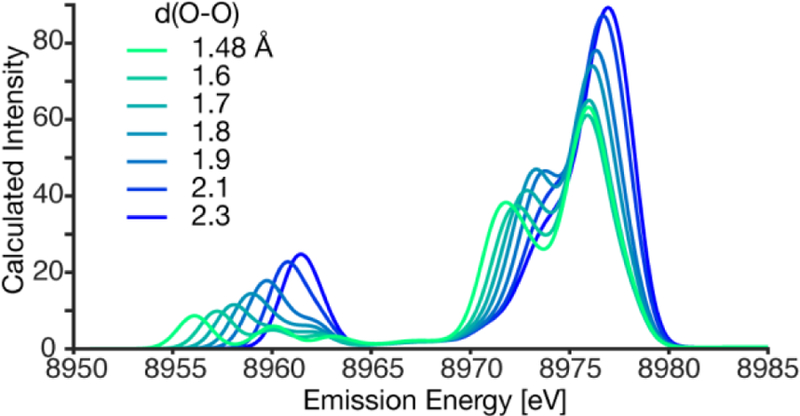
Calculated VtC XES spectra of theoretical copper dimer complex with a dioxygen core, varying the O-O distance between the limits of an µ-η2:η2-O2, (1.48 Å, green) and bis(µ-oxo) (2.3 Å, blue) supported with the DBED ligand. The calculated spectrum has a uniform 2.0 eV Gaussian broadening and a 230.2 eV shift.
Similar to the observed 2s σ-σ* splitting of the peroxo, the πh-πh* splitting also decreases with increasing O-O bond distance. The πh orbital is most stabilized at shorter O-O bond distances, lowering the πh energy and yielding the diagnostic Kβ2,5 shoulder. At longer O-O bond distances, the πh-πh* splitting becomes too small to be experimentally observable, Figure 7. Once the O-O bond is cleaved, the O 2p orbitals behave as monoatomic ligands, yielding the bis(µ-oxo) core, Figure 5. This in silico experiment clearly demonstrates that O-O bond interactions should be observable by VtC XES up to a distance of 1.9 Å.
The capability of VtC XES to probe small molecule’s structure and bond activation has only recently been reported,[6b, 13, 15] and is further expanded by the present work. The present proof-of-concept study illustrates the ability of VtC XES to measure the extent of O-O bond activation in molecular copper complexes. Further, these studies form the foundation for future time-resolved studies of molecular copper oxygen chemistry in both model complexes and enzymes. By employing energy dispersive x-ray emission spectrometers,[16] as opposed to the scanning emission spectrometer employed here, the entire VtC region may be collected in a ‘single shot’, thus allowing the time-dependent evolution of the Cu2O2 core to be monitored.
Supplementary Material
Acknowledgements
Financial support was provided by the Max Planck Society (S.D.) and the National Institutes of Health (GMR37–147365 to W.B.T.). G.E.C. was supported by a fellowship from the Alexander von Humboldt Foundation. X-ray experiments were performed on beamline ID-26 at the European Synchrotron Radiation Facility (ESRF), Grenoble, France. We are grateful to Dr. Lucia Amidani at the ESRF for providing assistance in using beamline ID-26.
References
- [1].Que L, Tolman WB, Nature 2008, 455, 333–340. [DOI] [PubMed] [Google Scholar]
- [2].Solomon EI, Heppner DE, Johnston EM, Ginsbach JW, Cirera J, Qayyum M, Kieber-Emmons MT, Kjaergaard CH, Hadt RG, Tian L, Chem. Rev 2014, 114, 3659–3853. [DOI] [PMC free article] [PubMed] [Google Scholar]
- [3].a) Lewis EA, Tolman WB, Chem. Rev 2004, 104, 1047–1076; [DOI] [PubMed] [Google Scholar]; b) Hatcher LQ, Karlin KD, Adv. Inorg. Chem 2006, 58, 131–184; [Google Scholar]; c) Mirica LM, Ottenwaelder X, Stack TD, Chem. Rev 2004, 104, 1013–1045; [DOI] [PubMed] [Google Scholar]; d) Elwell CE, Gagnon NL, Neisen BD, Dhar D, Spaeth AD, Yee GM, Tolman WB, Chem. Rev 2017, 117, 2059–2107. [DOI] [PMC free article] [PubMed] [Google Scholar]
- [4].a) Tolman WB, Acc. Chem. Res 1997, 30, 227–237; [Google Scholar]; b) Halfen JA, Mahapatra S, Wilkinson EC, Kaderli S, Young VG, Que L, Zuberbuhler AD, Tolman WB, Science 1996, 271, 1397–1400; [DOI] [PubMed] [Google Scholar]; c) Cramer CJ, Wloch M, Piecuch P, Puzzarini C, Gagliardi L, J Phys Chem A 2006, 110, 1991–2004; [DOI] [PubMed] [Google Scholar]; d) Liakos DG, Neese F, J Chem Theory Comput 2011, 7, 1511–1523. [DOI] [PubMed] [Google Scholar]
- [5].a) Kieber-Emmons MT, Ginsbach JW, Wick PK, Lucas HR, Helton ME, Lucchese B, Suzuki M, Zuberbuhler AD, Karlin KD, Solomon EI, Angew Chem Int Ed Engl 2014, 53, 4935–4939; [DOI] [PMC free article] [PubMed] [Google Scholar]; b) Mirica LM, Vance M, Rudd DJ, Hedman B, Hodgson KO, Solomon EI, Stack TD, Science 2005, 308, 1890–1892. [DOI] [PubMed] [Google Scholar]
- [6].a) Pollock CJ, DeBeer S, Acc Chem Res 2015, 48, 2967–2975; [DOI] [PubMed] [Google Scholar]; b) Pollock CJ, Grubel K, Holland PL, DeBeer S, J Am Chem Soc 2013, 135, 11803–11808. [DOI] [PMC free article] [PubMed] [Google Scholar]
- [7].Mirica LM, Rudd DJ, Vance MA, Solomon EI, Hodgson KO, Hedman B, Stack TD, J Am Chem Soc 2006, 128, 2654–2665. [DOI] [PubMed] [Google Scholar]
- [8].Cole AP, Mahadevan V, Mirica LM, Ottenwaelder X, Stack TDP, Inorg. Chem 2005, 44, 7345–7364. [DOI] [PubMed] [Google Scholar]
- [9].a) DuBois JL, Mukherjee P, Collier AM, Mayer JM, Solomon EI, Hedman B, Stack TDP, Hodgson KO, J. Am. Chem. Soc 1997, 119, 8578–8579; [Google Scholar]; b) DuBois JL, Mukherjee P, Stack TDP, Hedman B, Solomon EI, Hodgson KO, J. Am. Chem. Soc 2000, 122, 5775–5787. [Google Scholar]
- [10].Glatzel P, Sikora M, Smolentsev G, Fernandez-Garcia M, Catalysis Today 2009, 145, 294–299. [Google Scholar]
- [11].a) Lassalle-Kaiser B, Boron TT 3rd, Krewald V, Kern J, Beckwith MA, Delgado-Jaime MU, Schroeder H, Alonso-Mori R, Nordlund D, Weng TC, Sokaras D, Neese F, Bergmann U, Yachandra VK, DeBeer S, Pecoraro VL, Yano J, Inorg Chem 2013, 52, 12915–12922; [DOI] [PMC free article] [PubMed] [Google Scholar]; b) Beckwith MA, Roemelt M, Collomb MN, DuBoc C, Weng TC, Bergmann U, Glatzel P, Neese F, DeBeer S, Inorg Chem 2011, 50, 8397–8409; [DOI] [PubMed] [Google Scholar]; c) Lee N, Petrenko T, Bergmann U, Neese F, DeBeer S, J Am Chem Soc 2010, 132, 9715–9727. [DOI] [PubMed] [Google Scholar]
- [12].Park GY, Qayyum MF, Woertink J, Hodgson KO, Hedman B, Narducci Sarjeant AA, Solomon EI, Karlin KD, J Am Chem Soc 2012, 134, 8513–8524. [DOI] [PMC free article] [PubMed] [Google Scholar]
- [13].Rees JA, Martin-Diaconescu V, Kovacs JA, DeBeer S, Inorg Chem 2015, 54, 6410–6422. [DOI] [PMC free article] [PubMed] [Google Scholar]
- [14].Pollock CJ, Lancaster KM, Finkelstein KD, DeBeer S, Inorg. Chem 2014, 53, 10378–10385. [DOI] [PMC free article] [PubMed] [Google Scholar]
- [15].a) Pushkar Y, Long X, Glatzel P, Brudvig GW, Dismukes GC, Collins TJ, Yachandra VK, Yano J, Bergmann U, Angew. Chem., Int. Ed 2009, 49, 800–803; [DOI] [PMC free article] [PubMed] [Google Scholar]; b) Borfecchia E, Beato P, Svelle S, Olsbye U, Lamberti C, Bordiga S, Chemical Society Reviews 2018, 47, 8097–8133. [DOI] [PubMed] [Google Scholar]
- [16].a) Szlachetko J, Nachtegaal M, de Boni E, Willimann M, Safonova O, Sa J, Smolentsev G, Szlachetko M, van Bokhoven JA, Dousse JC, Hoszowska J, Kayser Y, Jagodzinski P, Bergamaschi A, Schmitt B, David C, Lucke A, Rev Sci Instrum 2012, 83, 103105; [DOI] [PubMed] [Google Scholar]; b) Alonso-Mori R, Kern J, Gildea RJ, Sokaras D, Weng TC, Lassalle-Kaiser B, Tran R, Hattne J, Laksmono H, Hellmich J, Glockner C, Echols N, Sierra RG, Schafer DW, Sellberg J, Kenney C, Herbst R, Pines J, Hart P, Herrmann S, Grosse-Kunstleve RW, Latimer MJ, Fry AR, Messerschmidt MM, Miahnahri A, Seibert MM, Zwart PH, White WE, Adams PD, Bogan MJ, Boutet S, Williams GJ, Zouni A, Messinger J, Glatzel P, Sauter NK, Yachandra VK, Yano J, Bergmann U, Proc. Natl. Acad. Sci. U. S. A 2012, 109, 19103–19107. [DOI] [PMC free article] [PubMed] [Google Scholar]
Associated Data
This section collects any data citations, data availability statements, or supplementary materials included in this article.


