Abstract
The backscatter coefficient (BSC) is a fundamental property of tissues and can be used to classify tissues. Two BSC calibration methods are the planar reflector method and the reference phantom method. In both methods, linear acoustic propagation is assumed. In this study, the calibration methods were evaluated when acoustic nonlinear distortion was present. Radio frequency data were acquired from two physical phantoms using a 5 MHz single-element transducer and low power (one excitation level) and high power (six increasing excitation levels) excitation signals. BSCs estimated from the high power settings were compared to the BSCs estimated using the low power by calculating the root mean square error (RMSE). The BSCs were parameterized by fitting the BSC curve to a power law and estimating the power law exponent and by estimating the effective scatterer diameter (ESD). When using the planar reflector method, estimates of the exponent were observed to monotonically increase in value versus increasing excitation level and the ESD decreased with increasing excitation level. The RMSE increased monotonically versus excitation level using the planar reflector method but did not increase using the reference phantom method. The results suggest that the effects of nonlinear distortion are minimized using the reference phantom method.
I. INTRODUCTION
The backscatter coefficient (BSC) is a quantitative ultrasound parameter that describes internal scattering structures in a medium. For example, recently the BSC was used to characterize bone (Jiang et al., 2014), liver (Lin et al., 2015), breast (Sannachi et al., 2015), and pancreas (Miller et al., 2017), among other in vivo studies. The BSC is calculated from estimates of the power spectra of the backscattered signals from a medium. However, the BSC must be calibrated to account for diffraction and system effects and compensated for frequency-dependent attenuation. Whereas the attenuation coefficient can be experimentally estimated and the diffraction can be analytically approximated for simple transducer geometries, the effects of system settings cannot be exactly modeled. In order to compensate for the system effects, a couple of methods have been proposed, i.e., the planar reflector method (Chen et al., 1997; Lavarello et al., 2011) and the reference phantom method (Yao et al., 1990). For example, in the planar reflector method, additional signals are acquired from the reflection off of a smooth plate with known reflectivity around the transducer focal region. In the reference phantom method, calibration signals are acquired from a well-characterized reference phantom, i.e., a phantom with known BSC and attenuation coefficient.
When estimating the BSC, it is common to assume linear acoustic propagation. However, all media are nonlinear in terms of acoustic propagation. Therefore, if the excitation signal produces acoustic waves with finite amplitude, i.e., not small acoustic pressures, the waveform might undergo harmonic generation, which is not predicted by linear acoustic theory. This nonlinear distortion is a function of the nonlinearity parameter B/A of the medium, derived from the pressure-density equation of state for fluids (Pierce, 1989). Furthermore, another parameter that contributes indirectly to nonlinear distortion of ultrasonic waves is the attenuation coefficient of the medium. For example, in a high attenuating medium, the acoustic pressures will decrease over a shorter distance than for a low attenuating medium with higher frequencies attenuating at a higher rate than lower frequencies. Hence, for a medium with the same B/A but a higher attenuation, less nonlinear distortion will be observed. On the other hand, in a low attenuating medium, excitation signals with larger amplitudes are more likely to undergo nonlinear distortion. In the particular case of plane waves, the ratio of the nonlinearity coefficient β = 1 + 0.5B/A and the attenuation coefficient, are used for the calculation of the Gol'dberg number, Γ, which predicts the occurrence of significant nonlinear distortion (Γ ≫ 1) or its absence (Γ ≪ 1) (Kinsler et al., 2000).
Distilled water has a nonlinearity parameter B/A = 5 (at 20 °C) (Beyer, 1997), which is lower than most tissues (Mast, 2000). On the other hand, water has a low attenuation coefficient for frequencies used in clinical sonography scanners (1–10 MHz) compared to soft tissues. For example, at 5 MHz, the attenuation coefficient of water is 0.055 dB/cm (Cobbold, 2007), whereas in soft tissue, the attenuation at 5 MHz can be higher than 5 dB/cm. Therefore, we hypothesize that when using the planar reflector method in water, water might be an undesired source of nonlinear distortions of the reflected signals. The nonlinear distortion in the calibration signal can distort the BSC estimate. On the other hand, when using the reference phantom method, the phantom can be constructed such that its attenuation is larger than the attenuation of water and much closer to the attenuation in tissue. Hence, the potential is for the nonlinear distortion in the calibration signal from the reference phantom to be less than that from a planar reflector in water.
In previous works on BSC estimation, it has been assumed that nonlinear distortion is negligible. Although assuming linear behavior in acoustic wave propagation simplifies the analysis, there are instances where high pressure amplitudes are needed, for example, when internal tissue structures are insonified with high pressures to increase the signal-to-noise ratio (SNR). The goal of this study is to assess the BSC estimation from two calibration methods, i.e., the planar reflector method and reference phantom method, when higher ultrasonic pressures are used in the acquisition of RF data and how nonlinear distortion can affect the estimates of BSC.
II. METHODS
A. BSC estimation methods
Two widely used BSC estimation strategies were assessed: the planar reflector method and the reference phantom method. The first method exploits the simple geometry of the transducer to analytically compute the diffractive effects. The second method can be used with more complex transducer geometries but can increase the variance of estimates without sufficient ensemble averaging of the reference spectrum.
1. Planar reflector method
The planar reflector method has been used with transducers having simple geometry, e.g., spherically focused transducers, because the effects of diffraction can be computed analytically and incorporated into the BSC calculation (Chen et al., 1997). In this work, a spherically focused single-element transducer was used for BSC estimation. Gated scan lines of radio frequency (RF) data from an interrogated medium corresponding to an axial length Δz and centered at the focal distance F, i.e., between , were recorded. The BSC, denoted by σ(f), was computed from this data using Eq. (6) in Lavarello et al. (2011)
| (1) |
where S(f, F) is the power spectrum averaged over several gated scan lines estimated from a data block, Sw(f, F) is the average power spectrum of reflected echoes from a planar reflector located at depths between , A(f, F) compensates for the attenuating effects of unknown medium and water, R is the transducer radius, γ is the reflectivity coefficient of the planar reflector, Gp = (kR2)/(2F) is the focal gain, and Jν is the Bessel function of the first kind and order ν. In Eq. (1), the system effects are assumed to be cancelled in the ratio of the spectra S(f, F)/Sw(f, F).
2. Reference phantom method
The system effects can also be compensated using a reference phantom method. Assuming equivalent sound speed in both sample and reference phantom, the diffractive effects are compensated through measurements as opposed to theory. The reference phantom needs to be previously well characterized, i.e., its acoustic parameters such as sound speed, BSC, and attenuation coefficient are known. The BSC from the sample is estimated as (Yao et al., 1990)
| (2) |
where S(f, F) and Sref(f, F) are the averaged power spectra from data blocks located at the same depth in the sample and the reference phantom, respectively, A(f) and Aref(f, F) are the attenuation compensation functions for the sample and reference phantom, respectively, and σref(f) is the known BSC of the reference phantom. An advantage of the reference phantom method is that the processed echoes need not arrive from the focal region, although, in this work data were acquired in the focal region of the transducer. In Eq. (2), the system effects are assumed to be canceled in the ratio of the power spectra S(f, F)/Sref(f, F).
B. Physical phantoms
Two physical phantoms were used in this study. Both cylindrically shaped phantoms had a 90 mm diameter and 39 mm height. The phantoms were constructed from agarose, n-propanol, condensed milk, and water with glass bead scatterers uniformly placed in the phantom spatially at random. The size ranges and concentrations of the glass beads in the two phantoms are described in Table I.
TABLE I.
Size ranges and concentrations of glass beads in physical phantoms A and B.
| Phantom A | Phantom B | |
|---|---|---|
| Glass bead diameters (μm) | 75 ∼ 90 | 9 ∼ 43 |
| Concentration | 5/mm3 | 800/mm3 |
For each phantom, the attenuation coefficient was estimated using an insertion loss approach. The attenuation from phantoms A and B were found to be αA(f) = 0.41f1.15 dB/cm and αB(f) = 0.79f1.05 dB/cm, respectively, over the frequency range from 4.8 to 8 MHz. Furthermore, both phantoms had layers of saran wrap at the top and bottom to protect the agar matrix and act as acoustic windows. The effects of the saran layer were compensated using the physical parameters and the Eq. (3) described in Wear et al. (2005). The phantoms were constructed according to the recipe in Madsen et al. (1998). According to the literature, phantoms of this type have a B/A of 6.6 ± 0.3 (Dong et al., 1999).
C. RF data acquisition
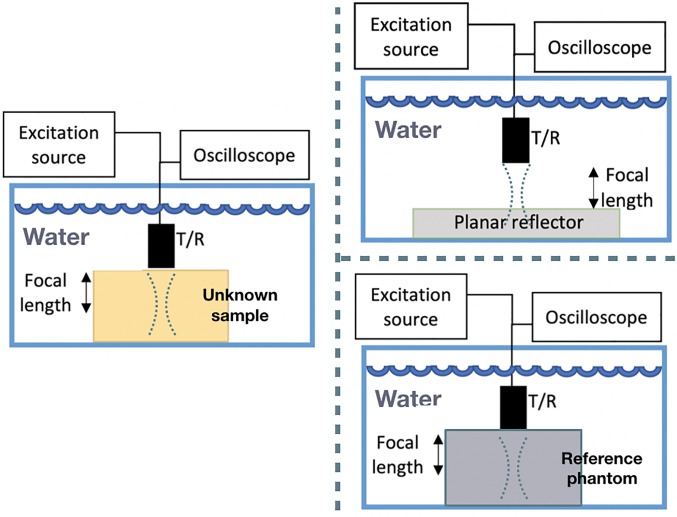
RF data acquisition was performed in a water filled tank using two scenarios. First, a low power pulser/receiver was used in order to minimize the presence of nonlinear distortions. Second, a high power unit was used in order to produce higher ultrasonic pressures and nonlinear distortion of the ultrasound signal. For both scenarios, a spherically focused single-element transducer with a 5 MHz nominal frequency (ISR054, NdtXducer LLC, USA), 12.5 mm diameter and 25.4 mm focal length was used. The planar reflector was Plexiglas with reflectivity γ = 0.37. Figure 1 depicts the acquisition setup.
FIG. 1.
(Color online) RF acquistion setup. Backscattered signals around the focal region were used for BSC estimation.
1. Low power and high power acquisition
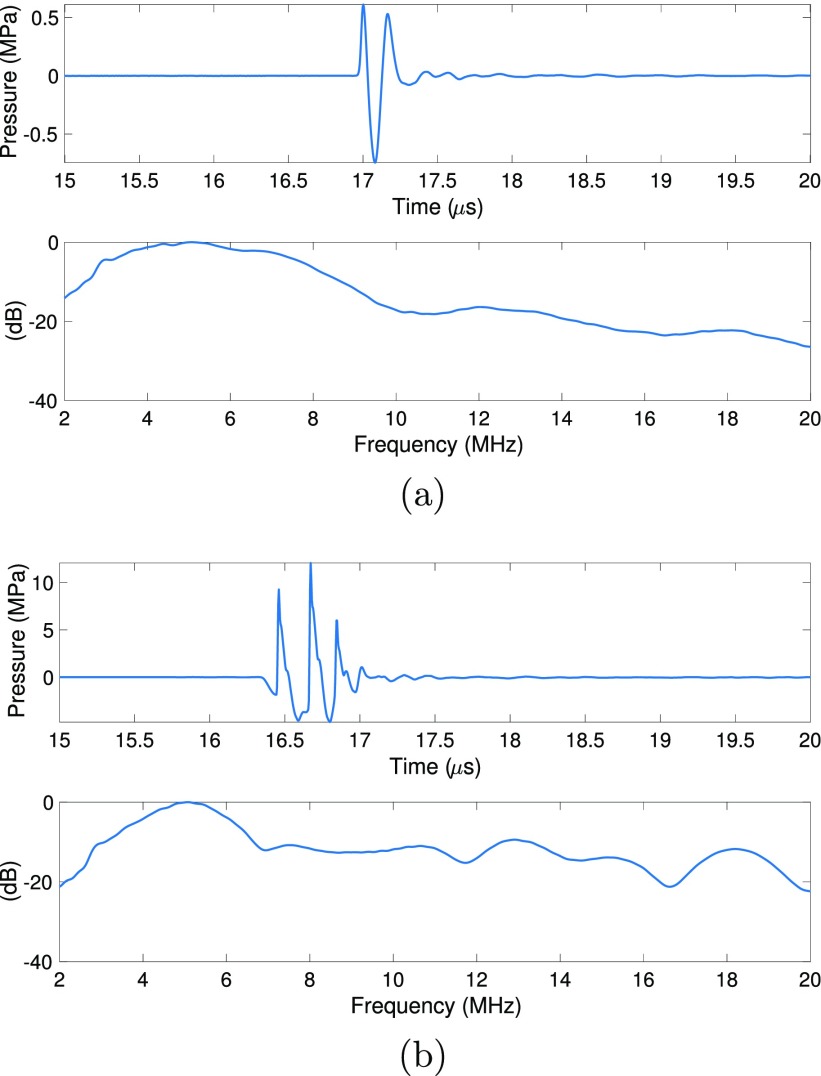
In the low power acquisition, the excitation signal for the transducer was generated with a pulser/receiver (5800PR, Panametrics Olympus, USA). Figure 2(a) shows a pulse generated by the pulser/receiver when using the low power setting and its corresponding power spectrum. The RF data from a sample phantom were recorded to a PC using a 14-bit UF3–4121 A/D card with 250 MHz sampling frequency (Strategic Test Corporation, Woburn, MA). Successive RF signals from a sample were captured by moving the transducer in the horizontal plane above the sample in a grid of 20 × 20 mm with steps of 2 mm in both directions. In addition, RF signals from a planar reflector were acquired using the same settings. However, the transducer was moved along the transducer axis in a step size of 0.5 mm such that the signals from the reflector were recorded throughout the depth of field of the transducer.
FIG. 2.
(Color online) Representative signals and their respective power spectra measured with a needle hydrophone for the low power setting (a) and high power setting with the largest excitation level (b).
Large ultrasonic pressures were utilized to visualize the nonlinear distortion; therefore, a high power pulser/receiver (RAM-5000, Ritec Inc., USA) was used to generate high ultrasonic pressures. Specifically, six different excitation levels (EL) were used in the experiments corresponding to peak-to-peak voltages between 381 and 1168 V. The excitation signal for the transducer was a 1-cycle tone burst with a center frequency of 5 MHz. RF signals were recorded by an oscilloscope (LeCroy Wavesurfer 44Xs). Figure 2(b) shows the excitation signal when using the high power settings and recorded with a broadband needle hydrophone. It should be noted that subsequent band pass filtering by the 5 MHz transducer will occur on both transmit and receive.
The peak positive pressure and peak negative pressure with the low power and high power settings were measured using a needle hydrophone (Precision Acoustics Ltd., UK). The needle hydrophone was located along the transducer axis to obtain the maximum peak positive pressure at the largest high power excitation level. Table II lists the peak positive pressure and peak negative pressure associated with the settings used in this study.
TABLE II.
Summary of peak positive pressure and peak negative pressure values associated with the settings used in this study, measured using a needle hydrophone at the focus of the transducer.
| Peak positive pressure (MPa) | Peak negative pressure (MPa) | |
|---|---|---|
| Low Power | ||
| Excitation level 1 | 0.66 | 0.75 |
| ine | High Power | |
| Excitation level 1 | 7.58 | 2.78 |
| Excitation level 2 | 9.10 | 3.38 |
| Excitation level 3 | 10.22 | 3.83 |
| Excitation level 4 | 11.02 | 4.21 |
| Excitation level 5 | 11.54 | 4.52 |
| Excitation level 6 | 12.10 | 4.74 |
Using the peak positive pressure in Table II, the Gol'dberg number for the low power settings were Γwater = 34.9, ΓA = 0.9, and ΓB = 0.5. On the other hand, for high power settings, Γwater ∈ (403.1, 643.4), ΓA ∈ (10.4, 16.6), and ΓB ∈ (6.3, 10.1). Hence, based on the estimated Gol'dberg numbers, strong nonlinear distortion in the signals are expected using the planar reflector method.
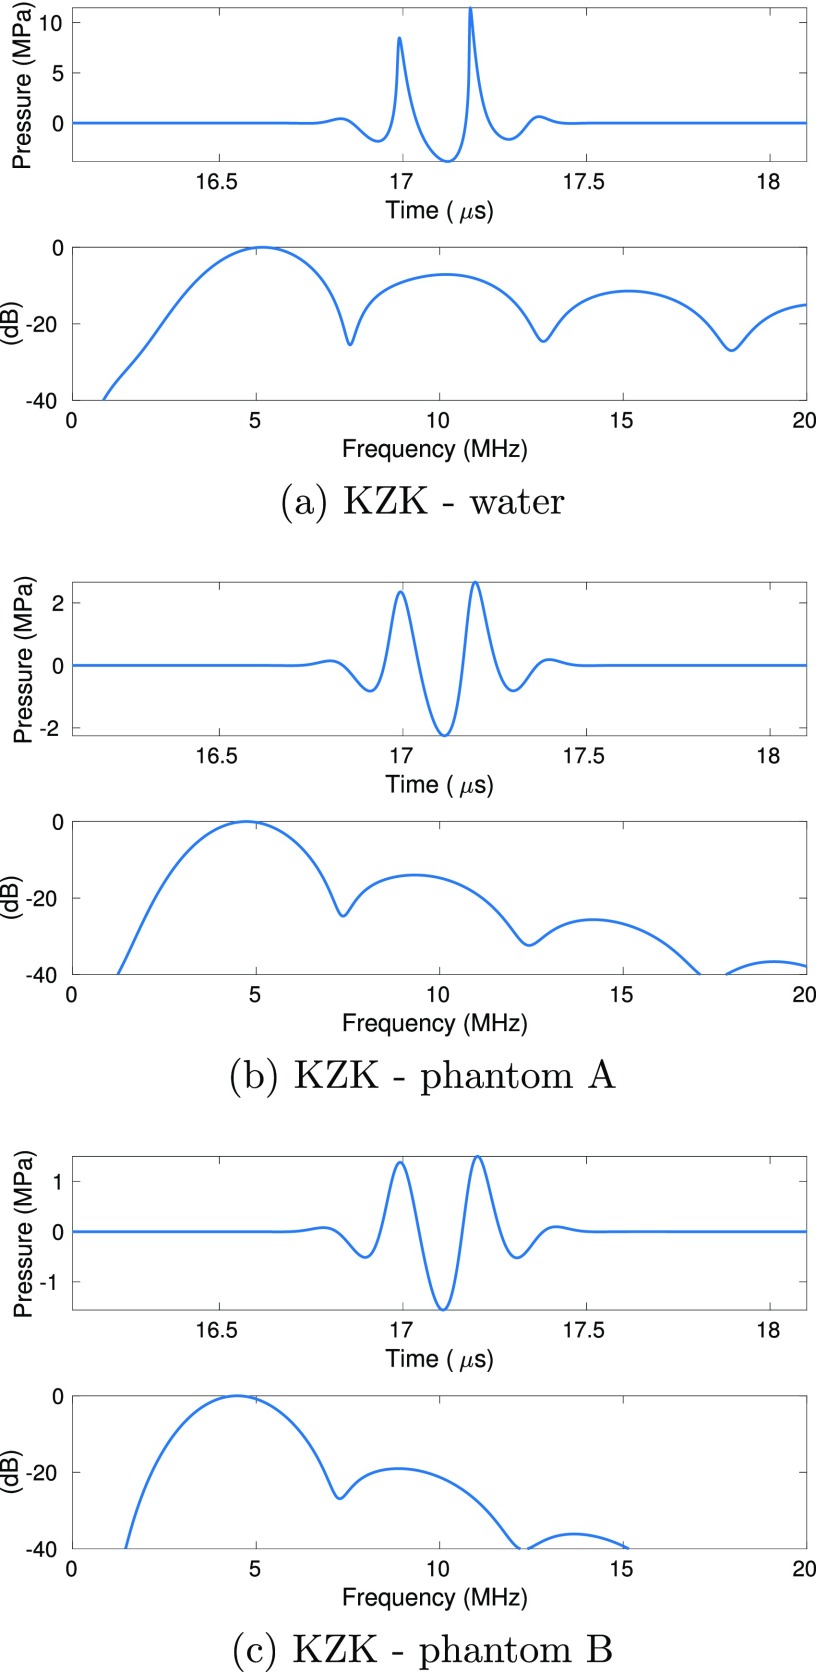
In order to explore the importance of nonlinear distortion and harmonic generation on the accuracy of BSC estimation, we used the Khokhlov-Zabolotskaya-Kuznetzov (KZK) equation and simulator to attempt to match the experimental conditions and examine the harmonic generation of references and samples (Cleveland et al., 1996; Lee and Hamilton, 1995). The KZK equation was used to obtain pulse shapes when propagating through media equivalent to phantoms A and B using a 5 MHz transducer and through water. We used the experimentally determined positive peak pressures from Table II to find parameters that matched the KZK peak positives pressures in water. Once we found the six source pressures for the KZK simulator, we repeated the simulations modifying the B/A and attenuation parameters that fit the values for phantoms A and B. Figure 3 shows the simulated waveforms and their power spectra at the focus of the 5 MHz transducer. The simulation results predict that the nonlinear distortion will be less for phantom B than for phantom A due to the larger attenuation of phantom B (second harmonic is at 20.4 dB below fundamental for phantom B, 12.5 dB for phantom A and 7 dB for water). Therefore, the KZK simulations suggest increased effects on the BSC estimation due to nonlinear distortion when using a water path for the reference technique.
FIG. 3.
(Color online) Representative signals and their respective power spectra at the focal length simulated with KZK. The signals were simulated to match the peak positive pressure at the focal length in water (a) for the high power setting with the largest excitation level. Waveforms corresponding to propagation through phantoms A (b) and B (c) showed that the second and third harmonics are 14.5 dB and 26.5 dB below the fundamental band for phantom A; and 20.4 dB and 38.4 dB below the fundamental band for phantom B and 26.5, whereas for water path propagation, the harmonics were only 7 dB and 11.3 dB below the fundamental band in water, respectively.
2. Linearity of transducer
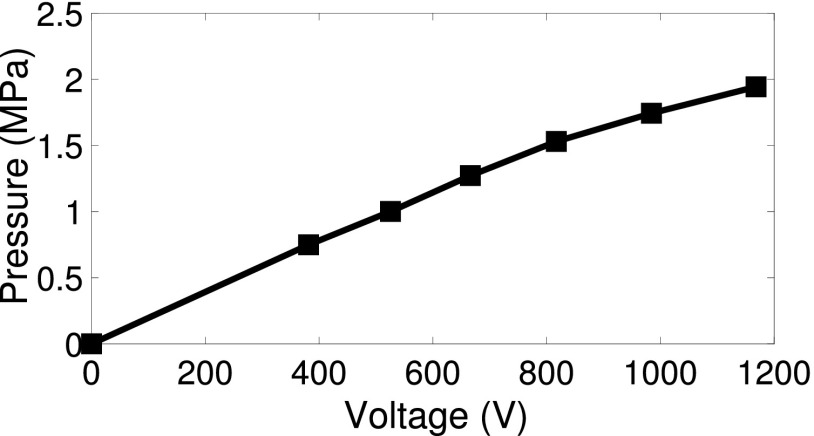
For the high power excitation signals, we verified that the transducer was operating in the linear regime. Figure 4 shows the peak-to-peak acoustic pressures measured with a needle hydrophone (Precision Acoustics Ltd., UK) when located a few millimeters from the transducer surface, i.e., where acoustic nonlinearity is expected to be negligible. The acoustic pressures at the output of the transducer were observed to increase linearly with the peak-to-peak voltage of the corresponding excitation level up to 800 V. At excitation voltages higher than 800 V, the pressure increase was no longer linear and presumably at high enough voltages the transducer output would saturate. However, any nonlinearity introduced into BSC estimation by the transducer could be taken into account through the calibration process.
FIG. 4.
Acoustic pressures (close to the transducer surface) vs high power peak-to-peak voltages used. The pressure was observed to increase linearly with excitation voltage up to 800 V with nonlinear behavior beginning to appear for the last two excitation levels.
3. BSC estimation procedures
In order to compute the BSCs, 121 independent scan lines were gated around F = 25.4 mm and a power spectrum was calculated from each scan line. The analysis bandwidth in both low and high pressure scenarios was chosen to correspond to −10 dB bandwidth. Pre-processing was performed on the echo signals by applying a pass band filter between 1 and 50 MHz to improve SNR of the backscattered signals. For BSC estimation, an averaged power spectrum was calculated from the power spectra of 121 scan lines to reduce the noise in the BSC estimates.
The first BSC values were estimated using the low power acquisition setting and the planar reflector method for phantoms A and B, respectively. The BSCs obtained using the low power setting and the planar reflector method were subsequently utilized as the ground truth BSCs and also as the σref(f) when computing the BSC with the reference phantom method.
When using high power settings and the planar reflector method, six BSCs were computed for each phantom A and B, corresponding to the six excitation levels used, i.e., from σHP-1(f) to σHP-6(f). When using high power settings and the reference phantom method, six BSCs were computed for the phantoms A and B, respectively, corresponding to the six excitation levels. For estimating BSCs of A, the reference phantom was phantom B, and vice-versa.
D. Metrics
1. Power fit exponent
The BSC was fit to a power law function such as σ(f) = bfn in order to obtain the frequency dependence exponent n. The exponent n provides a simple parameter describing the frequency dependence of the BSC. For example, n = 4 corresponds to Rayleigh scattering. Moreover, the exponent n is related to other quantitative ultrasound parameters such as the effective scatterer diameter (ESD). Rearranging by taking the logarithm of the Taylor's series expansion of the σ(f) = bfn and approximating to the line around the center frequency f0 gives
| (3) |
Thus, n can be computed as the slope of the natural logarithm of the BSC vs frequency, scaled by f0.
2. Root mean square error
The normalized root mean square error (RMSE) between BSC estimates from different power settings was computed as
| (4) |
where the subscripts HP-x and LP correspond to the BSCs using high power setting x (with ) and low power setting, respectively. The low power estimate of the BSC was used as a baseline reference.
3. Effective scatterer diameter
The ESD was estimated from the BSC by searching values of an effective scatterer radius, aeff, that minimized the average squared deviation (Insana et al., 1990) between the estimated BSC and the BSC derived from Faran theory (Faran, 1951). The search of aeff ranged from 0.5 to 100 μm. The theoretical BSC was estimated through the Faran's scattering theory given the properties of the glass bead scatterers (density: 2380 kg/m3, speed of sound: 5572 m/s, Poisson's ratio: 0.21) and the surrounding medium (density: 1540 m/s, speed of sound: 1020 kg/m3).
E. B/A offset of the reference phantom
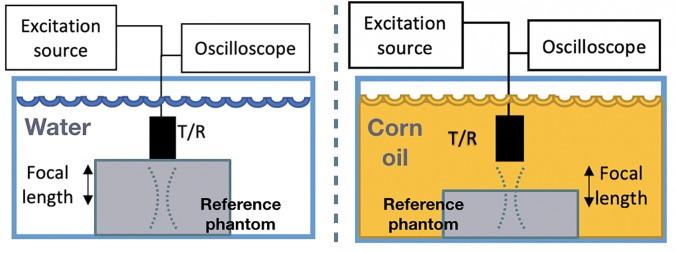
We did not have access to phantom materials with B/A values outside of the range from 5.8 to 6.6. Therefore, to assess the effects of nonlinear distortion when the reference B/A material had a larger mismatch to the sample, we acquired additional data by adding a layer of corn oil on top of the reference material and having a standoff to the phantom. Corn oil has acoustic properties close to that of soft tissue, i.e., density: 920 kg/m3, speed of sound: 1466 m/s, and attenuation 1.24 dB/cm at 4.5 MHz (Dong et al., 1999). However, corn oil has a B/A of 10.6, which is at the high end of what is expected to be encountered in tissue. Therefore, the corn oil standoff simulated having a reference phantom with a higher degree of nonlinear distortion than using the reference phantom alone with no standoff. Figure 5 depicts the acquisition setup using a reference phantom with a corn oil standoff of approximately 17 mm. This standoff was selected in order to place the focus just below the reference phantom surface for selection of reference backscattered signals within the depth of focus of the source.
FIG. 5.
(Color online) RF acquisition in the reference phantom method (left) and when using a corn oil stand off to increase nonlinear distortion (i.e., standoff of 17 mm thickness, whereas the focal length was 25.4 mm). Backscattered signals were acquired in the focal region for BSC estimation.
III. RIESULTS
A. Power spectra
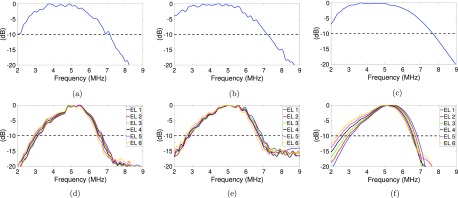
Figure 6 shows the power spectra when using the low power setting (one excitation level) and high power settings (six excitation levels). Power spectra were estimated from phantoms A and B and the Plexiglas planar reflector. The power spectra in high power settings had a narrower bandwidth than the power spectra in low power settings, which is a result of the different systems used to generate the low and high power settings.
FIG. 6.
(Color online) Normalized power spectra (to their corresponding maxima) used for BSC estimation using the low power setting (top) and high power settings (bottom, six excitation levels) for phantom A [(a) and (d)], phantom B [(b) and (e)], and the Plexiglas planar reflector [(c) and (f)]. The -10 dB below the maximum is depicted in dashed lines.
B. BSC results
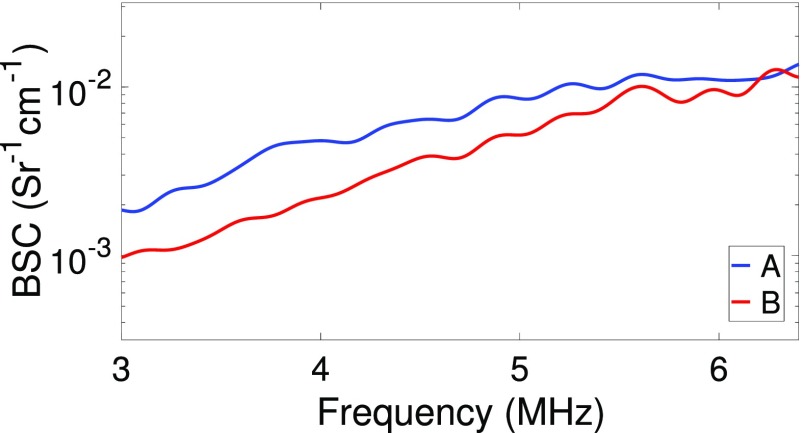
The first BSC estimation approach that was evaluated was the planar reflector method using the low power setting. Figure 7 shows the BSCs from the phantoms A and B, respectively. The analysis bandwidth was from 3 to 6.4 MHz, which corresponded to a fractional bandwidth of approximately 70%.
FIG. 7.
(Color online) BSCs from phantom A (blue) and B (red) when using the planar reflector method and low power settings.
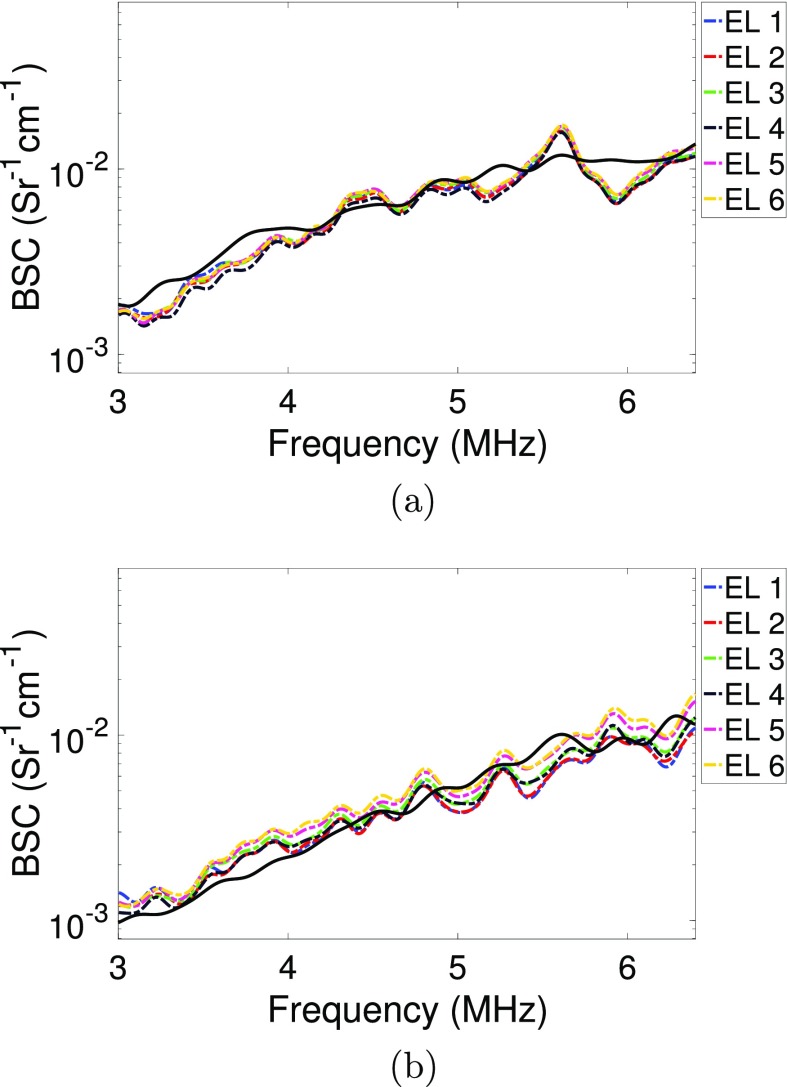
Figures 8(a) and 8(c) show the BSC estimated using the planar reflector method and high power settings, i.e., excitation levels from 1 to 6, for phantoms A and B, respectively. In both phantoms, BSCs estimated using the planar reflector method and increasing excitation levels followed the ground truth BSC for low frequencies but increasingly deviated at high frequencies.
FIG. 8.
(Color online) BSC estimates from phantom A (top) and phantom B (bottom) when using the planar reflector method (left) and the reference phantom method (right) with high power settings (six excitation levels). Solid lines are the baseline BSCs estimated using the low power settings (from Fig. 7).
Figures 8(b) and 8(d) show the BSC estimated using the reference phantom method and high power acquisition settings. For estimating the BSCs of the phantom A, the σref(f) used was σLP(f) of B, whereas for estimating the BSCs of the phantom B, the σref(f) used was σLP(f) of A. In both phantoms, BSCs estimated using the reference phantom technique were closer to the ground truth BSC throughout the analysis bandwidth compared to the Plexiglas reference data.
C. Exponent n results
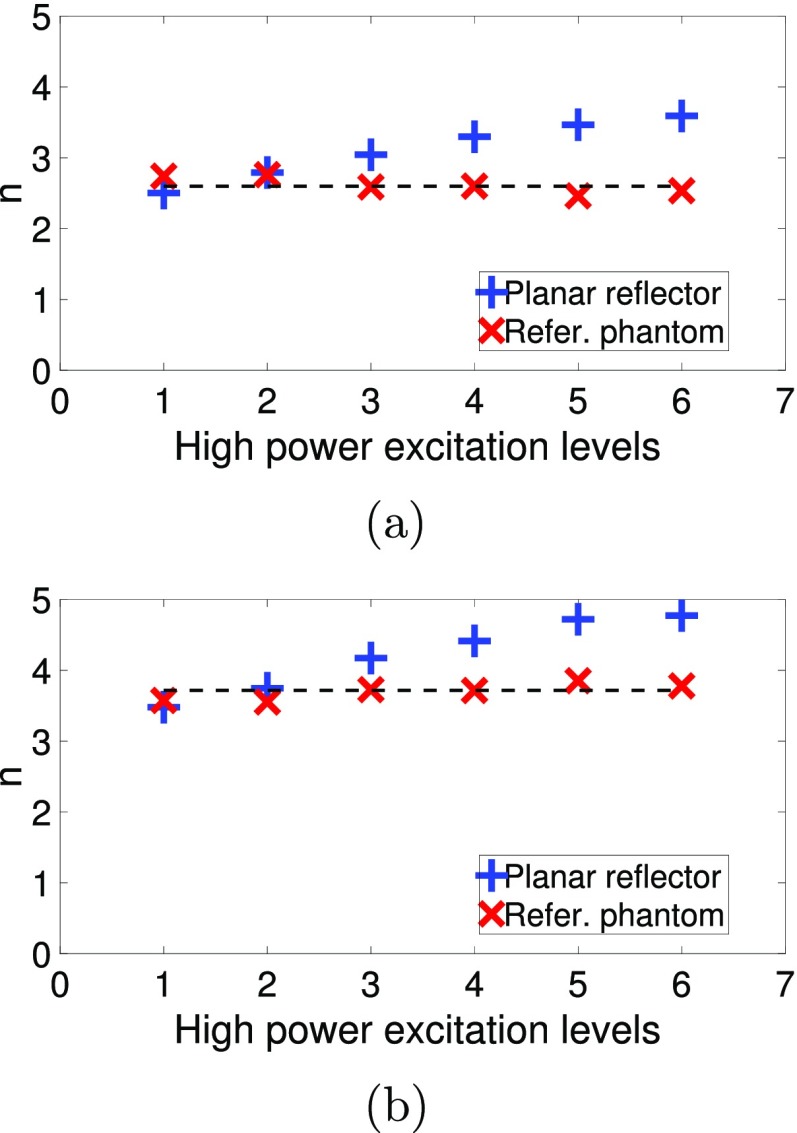
Estimated values of n, when fitting the BSC to a power function σ(f) = bf n, for the low power setting were 2.6 and 3.7 for phantoms A and B, respectively. For phantom A, when using the planar reflector method, the values of n were 2.5 at the lowest high power setting of 1 and increased monotonically to 3.6 for the largest high power setting of 6. Using the reference phantom technique, no monotonic increase was observed as the settings increased. The estimated value of n averaged across the settings was 2.61 ± 0.12. Similarly, for phantom B, when using the planar reflector technique, a monotonic increase in the estimate of n was observed starting with a value of 3.48 at the lowest high power setting of 1 and increasing to 4.77 at the largest high power setting of 6. Using the reference phantom technique resulted in minor changes in estimated values of n versus settings, i.e., the mean value of n estimated across the settings was 3.7 ± 0.12. From Fig. 9, the estimated n values were more stable when using the reference phantom method and did not result in increased error in the estimate versus higher power settings. These patterns were observed in both phantoms.
FIG. 9.
(Color online) Estimates of exponent n versus different excitation levels when fitting σ(f) = bfn, using the planar reflector method and the reference phantom method for phantoms A (top) and B (bottom). The dashed lines correspond to the n values obtained using low power settings.
D. RMSE results
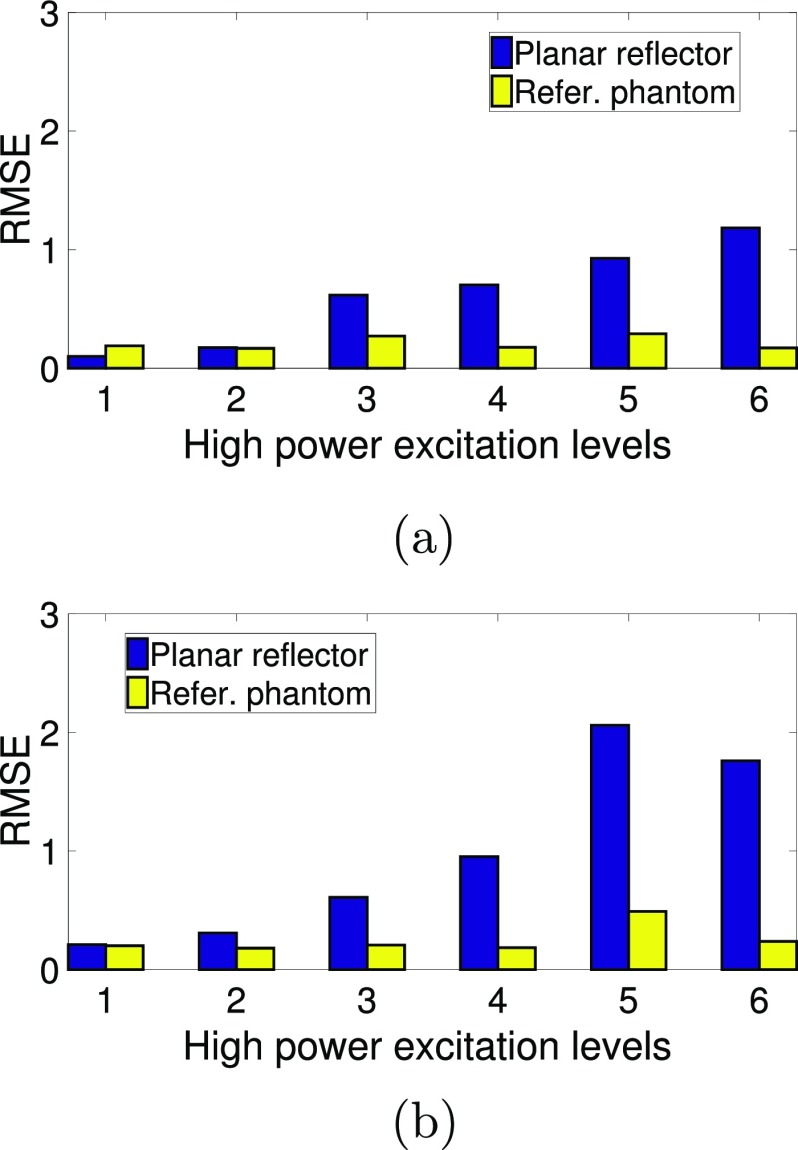
The RMSEs of the high power BSCs were computed with the low power BSC as ground truth to quantify the differences when high power excitation levels were used. The mean and standard deviation of the RMSE for phantom A were 0.62 ± 0.42 and 0.21 ± 0.06 using the planar reflector method and the reference phantom method, respectively. Similarly, for phantom B, the RMSE values were 0.98 ± 0.77 and 0.25 ± 0.12 using the planar reflector method and the reference phantom method, respectively. Figure 10 shows the RMSEs for phantoms A and B at each excitation level. The values of the RMSEs had lower variation for different excitation levels when using the reference phantom method. In contrast, the planar reflector method produced a wide range of RMSE values depending on the excitation level used.
FIG. 10.
(Color online) Normalized RMSE values of the high power BSCs with respect to the low power BSC for phantoms A (top) and B (bottom) when using the planar reflector method (blue bars) and the reference phantom method (yellow bars).
E. ESD results
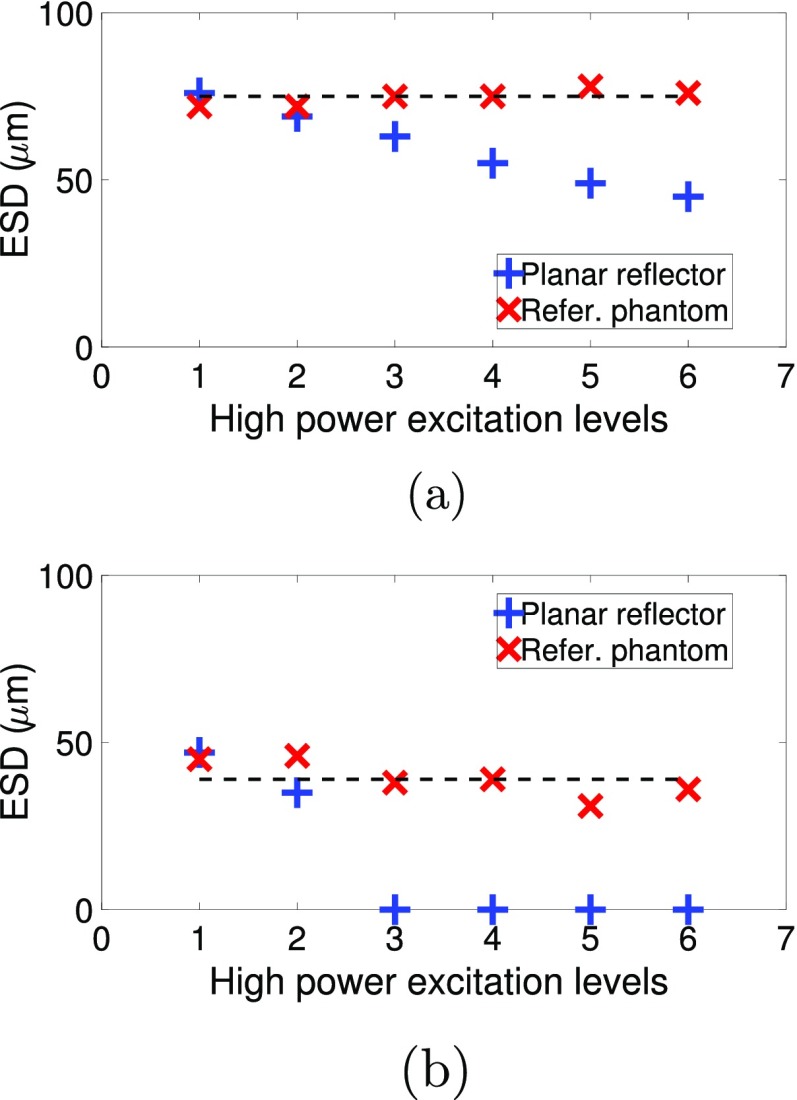
Estimated values of ESD when using the low power settings were 75 and 39 μm for phantoms A and B, respectively. When estimating the ESD using the high power settings, the variation of the ESD depended on the method of calibration. Figure 11 shows the mean estimates of the ESD at each power setting for both the planar reflector technique and the reference phantom technique. For phantom A, when using the planar reflector method, at the power setting 1, the ESD estimate was 76 μm and decreased monotonically to an ESD estimate of 45 μm with the highest power setting of 6. When using the reference phantom method, no monotonic decrease in ESD was observed and across the settings the mean value of the ESD estimate was 74.7 ± 2.3 μm. Similarly, for phantom B, when using the planar reflector method, the ESD estimates at a power setting of 1 was 47 μm, and by a power setting of 3, the ESD estimate collapsed to a value of 0.5 μm. When nonlinear distortion occurs, higher frequencies distort more rapidly than lower frequencies resulting in a downshift in the center frequency of the reference spectrum, as evidenced by Fig. 6(f). When dividing the sample spectrum by the distorted reference spectrum, the slope of the estimated BSC is increased. The slope of the BSC increases as the excitation level increases resulting in progressively smaller estimates of ESD. On the other hand, the reference phantom method provided consistent estimates of ESD at all power settings with a mean ESD estimate across all settings of 39.2 ± 5.6 μm.
FIG. 11.
(Color online) ESD estimates of phantoms A (top) and B (bottom) using six high power settings. The dashed lines correspond to the ESD estimate with low power settings.
F. B/A mismatch in the reference phantom
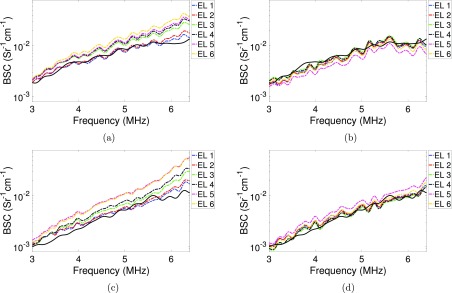
The results of BSC estimates when introducing a mismatch between the B/A values of the the sample and reference phantom through a corn oil standoff are shown in Fig. 12. The root mean squared error between BSC estimates acquired at the highest excitation level 6 and BSC estimates at the excitation level 1 was 8.6% and 10.2% for phantoms A and B, respectively, when no corn oil standoff was present. Using the corn oil standoff, the errors were 8.2% and 36% for phantoms A and B, respectively. Therefore, the mismatch of B/A can produce substantial error (more than 30%) in the case when phantom A was used as the reference. When the phantom B was used as reference, the error between the BSC estimates from phantom A at the different excitation levels was similar with and without the corn oil standoff on the reference. Therefore, when using the reference phantom technique, a mismatch in B/A values from the reference to the sample can result in BSC error. However, the attenuation of ultrasound reduces the nonlinear distortion effects on the BSC estimate, which is evidenced by the higher attenuation in phantom B.
FIG. 12.
(Color online) BSC estimates from phantom A (top) and phantom B (bottom) when using the reference phantom method (left) and the corn oil standoff with six excitation levels. Solid lines are the baseline BSCs estimated using the low power settings (from Fig. 7).
IV. DISCUSSION
In this experimental study, we demonstrated in physical phantoms that the BSC estimated using the reference phantom method had less sensitivity to nonlinear distortion than the planar reflector method. The phantoms used in this work were chosen to have attenuating properties that are similar to those found in soft tissues. For example, in Mast (2000), a large number of soft tissues could be characterized by an attenuation coefficient of 0.54 ± 0.37 dB/cm at 1 MHz and nonlinear parameter of B/A = 7.5 ± 1.1.
Power spectra were confirmed to be sensitive to amplitude variations of the excitation signals with distortions in the power spectra shape due to nonlinear wave propagation effects. In Figs. 6(d)–6(f), it can be observed that the normalized power spectra shifted to lower frequencies. The shift to lower frequencies results from the acoustic nonlinearity of the medium. Higher frequencies more rapidly distort due to acoustic nonlinearity, transferring energy to higher harmonics, as can be ascertained from the Gol'dberg number, which is inversely proportional to wavelength. In addition, the magnitude of the fundamental bandwidth is decreased as energy is transferred from the fundamental to the higher harmonics resulting in an apparent excess attenuation of the fundamental (Fatemi and Greenleaf, 1996). This phenomenon is highlighted in Fig. 6(f), where the propagation of the ultrasound through water at high pressures resulted in an increasingly larger shift to lower frequencies in the spectrum reflected off of the planar reflector. These results suggest that the nonlinear distortion from the water path propagation using the planar reflection method combined with the low attenuation of water was the source of the distortion to the BSC estimates observed in the data.
Using the planar reflector method with high power acquisition settings, the BSC estimates were increasingly divergent from the BSC obtained using the low power settings. The BSC curves in Fig. 8 had a larger variation when estimated using the planar reflector method in comparison to the BSC curves obtained using the reference phantom method. The B/A values for the phantoms (B/A assumed 6.6) were larger than that of water (B/A = 5). However, the attenuation was larger in the phantoms resulting in a smaller Gol'dberg number for the phantoms. Therefore, the nonlinear distortion of the reference spectra from the phantoms was smaller than observed for the planar reflector. The results from these subtle differences in calibration techniques suggest that the reference phantom technique would provide more consistent estimates of the BSC. Thus, when using high ultrasonic pressures to increase the SNR for BSC estimation, these results indicate that the reference phantom technique should be used and the planar reflector technique avoided.
In the next set of experiments, we examined the parameterization of the BSC by considering nonlinear distortion introduced through the calibration method. Similar behaviors were observed when fitting the BSC to a power law and when extracting the ESD for the glass beads in the phantoms. Estimates that were obtained using the planar reflector technique demonstrated trends where the estimates at higher excitation energies became increasingly divergent from the low power estimates of the parameters. The exponent n is another parameter that was found less consistent with BSC curves obtained using the planar reflector method. These findings might be crucial for an application such as tissue characterization, where either the exponent n or the ESD are derived directly from the shape of the BSC. In that scenario, malignant cells (typically larger structures with small n) might be misinterpreted as healthy cells (smaller structures with larger n) only based on the exponent n and its similarities with Rayleigh scattering.
The ESD values were in better agreement (scatterer diameters from Table I) when using the reference phantom method. For example, in phantom B, the ESD values obtained for excitation settings larger than 2 using the planar reference were 0.5 μm, which was the minimum value possible. In other words, the ESD estimation lost accuracy as the signal power increased. This again supports the importance of using a reference method that minimizes the effects of nonlinear distortion. Hence, the planar reflector method, under certain high power settings, provided ESD estimates that did not correspond to anything meaningful.
In the reference phantom method, the mismatch of the B/A parameter between the sample and reference phantom, through the use of a corn oil standoff, suggests that mismatches in nonlinear distortion between the reference and the sample can still result in BSC estimation error. However, due to the low attenuation of water, the reference phantom technique still provides better BSC estimates because the nonlinear distortion from the reference can be controlled through choice of B/A properties and attenuation of the fabricated phantom. The reference phantom can have a larger B/A value than water, but results in less nonlinear distortion because the attenuation of the phantom is much larger than that of water, which is the typical propagation medium used in the planer reflector method.
The main reason for using higher excitation settings for estimating the BSC and associated parameters is to increase the SNR. Low SNR results in higher bias and variance of estimates. However, as was observed in this study, higher pressure values can also lead to higher nonlinear distortion effects, which in turn can lead to increases in estimate bias and variance. Therefore, the results of the study suggest that to improve BSC estimate bias and variance, high ultrasonic powers can be used, but should be used with a reference medium that allows a low Gol'dberg number. This is difficult to achieve with water as the propagation pathway, which is why the reference phantom method provided better estimate performance. However, a planar reflector method could potentially provide good estimates without nonlinear distortion if another propagation medium were used instead of water that resulted in a low Gol'dberg number, i.e., a medium that balanced the B/A value with a higher attenuation. Another alternative to overcome the strong harmonic generation due to a water propagation with the planar reflector method would consist of using a low power setting for the reference acquisition and scaling the setting to higher power for the sample acquisition. Less nonlinear distortion will occur due to the low signal level of the reference. The BSC can then be estimated with the low power reference by correcting with the scaling factor, assuming the scaling factor can be accurately known.
V. CONCLUSION
In this study, the bias and variance of two BSC estimation methods were compared when nonlinear distortion was present. The findings suggest that accuracy of the planar reflector method when using a water propagation path is more sensitive to nonlinear distortion effects than the reference phantom method. In general, the reference phantom method provided more consistent BSC estimates when finite amplitude waves (i.e., not small acoustic pressures) were used during the RF data acquisition, thus improving the consistency of the BSC for tissue characterization.
ACKNOWLEDGMENTS
A.C. acknowledges the financial support from the National Council of Science, Technology and Technological Innovation (CONCYTEC, Perú) through the National Fund for Scientific, Technological Development and Technological Innovation (FONDECYT, Perú) under Grant No. 132-2016. The authors also acknowledge grants from the NIH (Nos. R21EB024133 and R21EB023403).
References
- 1. Beyer, R. T. (1997). Nonlinear Acoustics ( Acoustical Society of America, Woodbury, NY: ), p. 101. [Google Scholar]
- 2. Chen, X. , Phillips, D. , Schwarz, K. Q. , Mottley, J. G. , and Parker, K. J. (1997). “ The measurement of backscatter coefficient from a broadband pulse-echo system: A new formulation,” IEEE Trans. Ultrason. Ferroelectr. Freq. Control 44(2), 515–525. 10.1109/58.585136 [DOI] [PubMed] [Google Scholar]
- 3. Cleveland, R. O. , Hamilton, M. F. , and Blackstock, D. T. (1996). “ Time-domain modeling of finite-amplitude sound in relaxing fluids,” J. Acoust. Soc. Am. 99(6), 3312–3318. 10.1121/1.414983 [DOI] [Google Scholar]
- 4. Cobbold, R. S. C. (2007). Foundations of Biomedical Ultrasound ( Oxford University Press, New York: ), p. 74. [Google Scholar]
- 5. Dong, F. , Madsen, E. L. , MacDonald, M. C. , and Zagzebski, J. A. (1999). “ Nonlinearity parameter for tissue-mimicking materials,” Ultrasound Med. Biol. 25(5), 831–838. 10.1016/S0301-5629(99)00016-2 [DOI] [PubMed] [Google Scholar]
- 6. Faran, J. J. (1951). “ Sound scattering by solid cylinders and spheres,” J. Acoust. Soc. Am. 23(4), 405–418. 10.1121/1.1906780 [DOI] [Google Scholar]
- 7. Fatemi, M. , and Greenleaf, J. F. (1996). “ Real-time assessment of the parameter of nonlinearity in tissue using ‘nonlinear shadowing’,” Ultrasound Med. Biol. 22(9), 1215–1228. 10.1016/S0301-5629(96)00140-8 [DOI] [PubMed] [Google Scholar]
- 8. Insana, M. F. , Wagner, R. F. , Brown, D. G. , and Hall, T. J. (1990). “ Describing small-scale structure in random media using pulse-echo ultrasound,” J. Acoust. Soc. Am. 87(1), 179–192. 10.1121/1.399283 [DOI] [PMC free article] [PubMed] [Google Scholar]
- 9. Jiang, Y. Q. , Liu, C. C. , Li, R. Y. , Wang, W. , Ding, H. , Qi, Q. , Ta, D. , and Wang, J. D. W. Q. (2014). “ Analysis of apparent integrated backscatter coefficient and backscattered spectral centroid shift in calcaneus in vivo for the ultrasonic evaluation of osteoporosis,” Ultrasound Med. Biol. 40(6), 1307–1317. 10.1016/j.ultrasmedbio.2013.12.024 [DOI] [PubMed] [Google Scholar]
- 10. Kinsler, L. E. , Frey, A. R. , Coppens, A. B. , and Sanders, J. V. (2000). Fundamentals of Acoustics, 4th ed. ( John Wiley & Sons, Hoboken, NJ: ), p. 483. [Google Scholar]
- 11. Lavarello, R. J. , Ghoshal, G. , and Oelze, M. L. (2011). “ On the estimation of backscatter coefficients using single-element focused transducers,” J. Acoust. Soc. Am. 129(5), 2903–2911. 10.1121/1.3557036 [DOI] [PMC free article] [PubMed] [Google Scholar]
- 12. Lee, Y.-S. , and Hamilton, M. F. (1995). “ Time-domain modeling of pulsed finite-amplitude sound beams,” J. Acoust. Soc. Am. 97(2), 906–917. 10.1121/1.412135 [DOI] [Google Scholar]
- 13. Lin, S. C. , Heba, E. , Wolfson, T. , Ang, B. , Gamst, A. , Han, A. , Erdman, J. W. , O'Brien, W. D. , Andre, M. P. , Sirlin, C. B. , and Loomba, R. (2015). “ Noninvasive diagnosis of nonalcoholic fatty liver disease and quantification of liver fat using a new quantitative ultrasound technique,” Clin. Gastroenterol. Hepatol. 13(7), 1337–1345. 10.1016/j.cgh.2014.11.027 [DOI] [PMC free article] [PubMed] [Google Scholar]
- 14. Madsen, E. L. , Frank, G. R. , and Dong, F. (1998). “ Liquid or solid ultrasonically tissue-mimicking materials with very low scatter,” Ultrasound Med. Biol. 24(4), 535–542. 10.1016/S0301-5629(98)00013-1 [DOI] [PubMed] [Google Scholar]
- 15. Mast, T. D. (2000). “ Empirical relationships between acoustic parameters in human soft tissues,” Acoust. Res. Lett. Online 1(2), 37–42. 10.1121/1.1336896 [DOI] [Google Scholar]
- 16. Miller, R. J. , Han, A. , Gates-Tanzer, L. T. , Erdman, J. W. , Shisler, J. L. , Wallig, M. A. , and O'Brien, W. D. (2017). “ Quantitative ultrasound and the pancreas: Demonstration of early detection capability,” in Proceedings of the 2017 IEEE International Ultrasonics Symposium (IUS), Washington, DC, September 6–9, pp. 1–4. [Google Scholar]
- 17. Pierce, A. D. (1989). Acoustics: An Introduction to Its Physical Principles and Applications ( Acoustical Society of America, Melville, NY: ), Chap. 11. [Google Scholar]
- 18. Sannachi, L. , Tadayyon, H. , Sadeghi-Naini, A. , Tran, W. , Gandhi, S. , Wright, F. , Oelze, M. , and Czarnota, G. (2015). “ Non-invasive evaluation of breast cancer response to chemotherapy using quantitative ultrasonic backscatter parameters,” Med. Image Anal. 20(1), 224–236. 10.1016/j.media.2014.11.009 [DOI] [PubMed] [Google Scholar]
- 19. Wear, K. A. , Stiles, T. A. , Frank, G. R. , Madsen, E. L. , Cheng, F. , Feleppa, E. J. , Hall, C. S. , Kim, B. , Lee, P., Jr. , O'Brien, W. D. , Oelze, M. L. , Raju, B. I. , Shung, K. K. , Wilson, T. A. , and Yuan, J. R. (2005). “ Interlaboratory comparison of ultrasonic backscatter coefficient measurements from 2 to 9 MHz,” J. Ultrasound Med. 24(9), 1235–1250. 10.7863/jum.2005.24.9.1235 [DOI] [PubMed] [Google Scholar]
- 20. Yao, L. X. , Zagzebski, J. A. , and Madsen, E. L. (1990). “ Backscatter coefficient measurements using a reference phantom to extract depth-dependent instrumentation factors,” Ultrason. Imaging 12(1), 58–70. 10.1177/016173469001200105 [DOI] [PubMed] [Google Scholar]


