Abstract
Objective:
Powered assistive devices need improved control intuitiveness to enhance their clinical adoption. Therefore, the intent of individuals should be identified and the device movement should adhere to it. Skeletal muscles contract synergistically to produce defined lower-limb movements so unique contraction patterns in lower-extremity musculature may provide a means of device joint control. Ultrasound (US) imaging enables direct measurement of the local deformation of muscle segments. Hence, the objective of this study was to assess the feasibility of using US to estimate human lower-limb movements.
Methods:
A novel algorithm was developed to calculate US features of the rectus femoris muscle during a non-weight-bearing knee flexion/extension experiment by 9 able-bodied subjects. Five US features of the skeletal muscle tissue were studied, namely, thickness, angle between aponeuroses, pennation angle, fascicle length, and echogenicity. A multiscale ridge filter was utilized to extract the structures in the image and a random sample consensus (RANSAC) model was used to segment muscle aponeuroses and fascicles. A localization scheme further guided RANSAC to enable tracking in an US image sequence. Gaussian process regression (GPR) models were trained using segmented features to estimate both knee joint angle and angular velocity.
Results:
The proposed segmentation-estimation approach could estimate knee joint angle and angular velocity with an average root mean square error value of 7.45 degrees and 0.262 rad/s, respectively. The average processing rate was 3–6 frames per second that is promising towards real-time implementation.
Conclusion:
Experimental results demonstrate the feasibility of using US to estimate human lower-extremity motion. The ability of algorithm to work in real-time may enable the use of US as a neural interface for lower-limb applications.
Significance:
Intuitive intent recognition of human lower-extremity movements using wearable US imaging, may enable volitional assistive device control, and enhance locomotor outcomes for those with mobility impairments.
Keywords: Lower-limb assistive robots, machine learning, motion estimation, rehabilitation robotics, ultrasound imaging
I. Introduction
More than 30 million people, in the United States alone, either face difficulty with mobility or use a wheelchair, cane, crutches, or walker [1]. While robotic lower-extremity assistive devices (i.e., prostheses and exoskeletons) hold the promise to improve the quality of life for this population, coordinating the movement of the device with the user’s intent remains a challenge [2]. Many of the current control strategies rely on kinematic and kinetic features of gait (e.g., hip joint movement) [3–5]. Additionally, most of these control approaches work for cyclic movements and lack intuitiveness like response to neural input by the user [6].
Surface electromyography (sEMG) has been used for over a decade now as a noninvasive human-machine interface to convey the intent of the user and enable intuitive device control [6]. Researchers have successfully fused sEMG data with other data sources, such as mechanical sensors on the device, to improve intuitiveness during ambulation [7], [8]. sEMG has been used further for direct control of volitional movements [9], [10]. However, sEMG is sensitive to a number of factors, such as change in electrode impedance, fatigue, sweat, and misalignment of electrodes [6]. sEMG interface is reliant on the quality of signal that is hard to maintain over time [11], [9]. While implanted EMG sensors may overcome some of these limitations, still some limitations remain about EMG that are intrinsic to physiological factors. For instance, muscle crosstalk causes the lack of specificity in EMG recordings [12]. Also, inability of EMG in accessing deep muscles hinders the potential use of data from synergistic muscles [10]. Furthermore, invasive implantation may cause infections, especially in the case of vascular diseases/amputation. These limitations of kinematic, kinetic, and EMG-based control strategies have motivated researchers to search for new user interface technologies for both upper- and lower-limb devices [6], [13].
Noninvasive ultrasound (US) imaging can access deep muscle tissue and has been used as a peripheral interface for upper-limb applications. Contraction sensing of specific muscle groups through US imaging improves the specificity of intent recognition. Using US images of the upper arm, researchers were able to predict finger movements [14–16]. US has further shown promise in offline classification of 15 different hand motions and real-time graded control of a virtual hand for four different motions [17]. US has also been used to analyze the thickness of lower-extremity muscles during dynamic contraction induced by neuromuscular electrical stimulation (NMES). Rectus femoris (RF) muscle thickness exhibits a strong correlation to knee joint angle during single-joint knee extension and can therefore help optimize NMES systems [18].
Of clinical importance, US analysis of skeletal muscle architecture has been extensively researched. Muscle thickness, cross-sectional area, pennation angle, fascicle length and angle between aponeuroses are among the kinematic muscle features which have shown a strong correlation to the muscle function [18–23]. Image echogenicity has been suggested to be reflective of an intramuscular process during ongoing motor unit recruitment, hence it might have a kinetic nature rather than a kinematic nature [24]. During muscle excitation-contraction, muscle kinetic features undergo a change during formation of cross-bridges and before force production. Whereas, kinematic features exhibit a change during sarcomere shortening (after the produced force overcomes muscle segment inertial forces) and before the joint motion. Therefore, US is capable of capturing the neuromuscular features that precede the joint motion and might be used for movement prediction.
To reduce the excessive time associated with manual image processing, several algorithms have been developed focusing on segmentation and tracking of muscle aponeuroses and fascicles [21, 25–28]. Since most of the current approaches are mostly aimed for clinical assessment and diagnosis, they either require manual input [21, 25, 29, 30], are focused on measuring only one of the features [21, 25–27, 30, 31], or have high computational cost and not suitable for real-time applications [21, 26–30]. Some methods assume a uniform shape for aponeuroses and fascicles [25, 28–30], whereas in many cases they appear as nonuniform line-like objects. On the other hand, similar problems are well researched in computer vision literature. The concept of ridge and valley is used in fingerprint enhancement [32], which is similar to the enhancement of US images of skeletal muscle. Segmentation of muscle aponeuroses and fascicles resembles the lane-detection problem in autonomous driving research, which can be solved using the random sample consensus (RANSAC) model [33].
We propose a novel approach for lower-limb volitional motion estimation based on US imaging. This framework involves an algorithm based on both a ridge filter for image enhancement and RANSAC for model fitting to extract the US features. We take a regression-based machine learning approach to estimate knee joint angle and angular velocity during a non-weight-bearing knee flexion/extension experiment and using the extracted US features. The estimations are then validated against the recorded motion of able-bodied human subjects. Five US-image-derived features of the RF muscle are used: muscle thickness, angle between aponeuroses, pennation angle, fascicle length, and echogenicity. Overall, we hypothesize that lower-limb proximal muscle kinematics and kinetics, noninvasively tracked by US imaging, can be used to estimate human distal movements. A reliable motion estimation performance may demonstrate the feasibility of using US as a peripheral interface for lower-limb assistive device control.
II. Methods
A. Data Collection and Experiment
The non-weight-bearing knee flexion/extension experiment is used to demonstrate the predictability of intuitive movements and assess the performance of interfaces and algorithms for volitional control [9], [10]. Similarly, a non-weight-bearing knee flexion/extension experiment was performed with 3 repetitions by 9 healthy, able-bodied subjects (5 M, 4 F; age: 26.2±12.6 years old). Participants were seated and were instructed to fully extend their knee joint and flex it back to the rest position, at a comfortable pace and data was collected throughout the movement. The same scenario was repeated 3 times for each leg with 30 seconds of rest between the repetitions.
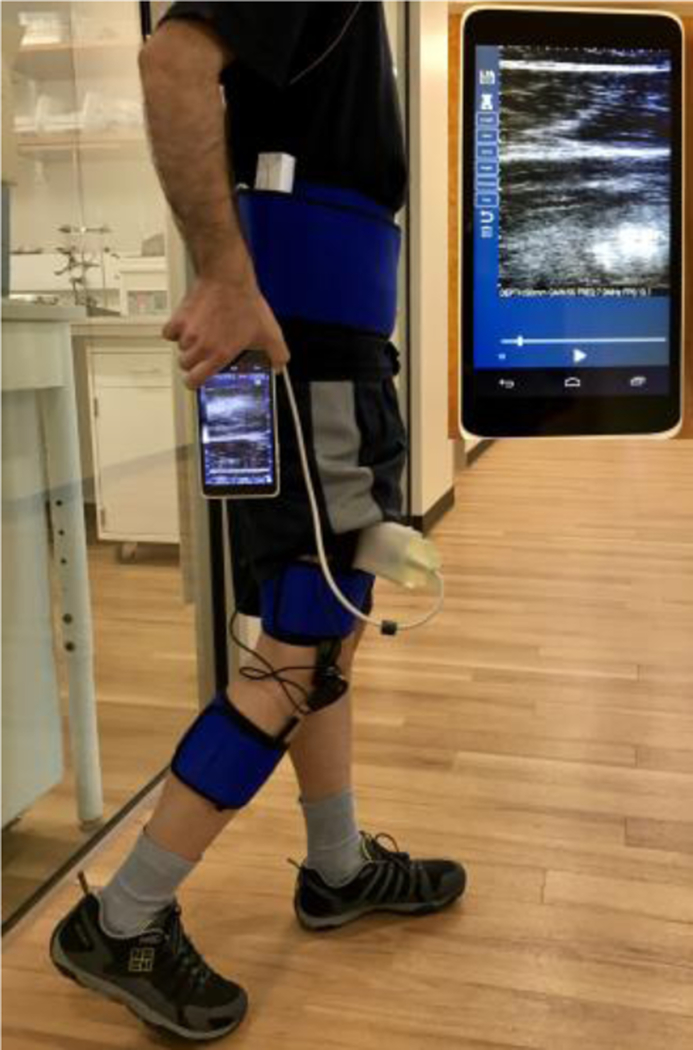
Participants were equipped with a custom-designed 3D printed US transducer holder placed 60% of the distance between the anterior superior iliac spine and proximal base of the patella. US probe was placed along the muscle and US images of the RF muscle were captured using a handheld and wearable US scanner (mSonic, Lonshine Technologies Inc, Beijing, China), shown in Fig. 1. This system was modified by the manufacturer to support an extended US image acquisition (1024 frames, 13–16 frames per second (fps)). Standard grayscale US images were collected in real-time using a transmit frequency of 7.5 MHz and dynamic range of 50 dB. A PS-2137 wireless goniometer (Pasco, CA, USA) was used to measure the knee angle and angular velocity during the movement with a 20 Hz sampling rate. Data from the goniometer was recorded on a smartphone wirelessly and in real-time. Since the experiment equipment was wireless and portable, the participants were free to move within no certain range. This feature enables the study of skeletal muscles during locomotion experiments. The experimental setup on an able-bodied human subject is shown in Fig. 1.
Fig. 1.
Experimental setup on a human subject. Handheld ultrasound (US) device is magnified on the upper-right side of image.
The experiment protocol, including the device, was approved by the institutional review board at the University of Texas at Dallas and all the participants provided informed written consent.
B. US Feature Segmentation
Based on muscle architecture, superficial and deep aponeuroses and fascicles are the objects of interest in US images during the motion. Thus, the algorithm involves segmentation of nonuniform line-like objects.
1). Structure Extraction
It is known that US image quality and the presence of other tissues, intramuscular vessels, noise, and artifacts can complicate automatic segmentation. To ensure the reliability of feature detection and best representation of the structures associated with objects of interest, preprocessing image enhancement was implemented.
In the context of scale-space theory, local ridge structures are defined as the main principal curvatures in an image [34]. They can be derived from the scale-space representation of an US image by convolution with Gaussian derivative operators using the following equations
| (1) |
| (2) |
where g(x, y; S) is a Gaussian kernel function, x and y denote spatial coordinates, S denotes the variance (scale) of the Gaussian kernel, and I(x, y) is the original image. The main principal curvature is then calculated as
| (3) |
where R(x, y; S) is the ridge response at a given scale and may be used to reconstruct the ridge filtered image. A strong ridge response is obtained when the width of the local ridge structure in the original image has a value close to the standard deviation of the Gaussian kernel (i.e.,)
2). Multiscale Ridge Filter
Muscle aponeuroses have distinctly different widths compared to fascicles. Different fascicles may also have different thicknesses in a particular US image under consideration. Furthermore, the size and geometry of the same muscle may vary considerably in different people. Hence, there is no unique scale that can be used to handle all possible variations. To tackle this problem, a multiscale filter was investigated. The original image I(x, y) is convolved with a series of ridge filters with different scales and the maximal ridge response is used to reconstruct the final scale-invariant ridge filtered image, RSI, as
| (4) |
3). Morphological Operations
Morphological operations including binarizing, skeleton extraction, and pruning were performed to better represent the extracted structures in RSI. The binarizing step was performed by intensity thresholding [35]. To extract the skeletons, a thinning algorithm detailed in [36] was used. As the skeletonization leaves unwanted parasitic components, a simple pruning operation is necessary. The pruning process formed a cleared binary ridge map, RMbinary. Finally, construction of the final ridge map, RM(x, y), superimposes the binary ridge map onto the original US image as
| (5) |
Consequently, RM has the same structures adopted from RMbinary and the intensities mapped from I.
4). Aponeurosis and Fascicle Detection
RANSAC is an iterative two-phase hypothesis generation-evaluation method for model parameter estimation in the presence of noise and outliers [37]. Given the ridge map described by (5) and the fact that aponeuroses and fascicles are assumed line-like objects, a modified version of RANSAC, termed MSAC [38] was used for detection in the presence of other objects in the map. For the ridge map of a given frame, RMf, MSAC forms a cost function to evaluate the estimated model, θf, (e.g., line parameters) and its associated consensus set, CSf, (e.g., the pixels spatially close enough to the estimated line). In addition, MSAC was modified to include grayscale intensities from RMf as weights to model the cost function, and result in converge towards the brightest object as follows
| (6) |
| (7) |
In an iterative manner, RANSAC updates CSf and θf based on the cardinality and cost of consensus sets as described below
| (8) |
where i denotes a specific iteration. RANSAC stops iterating when a sufficient number of iterations is met [37], [38].
The formation of minimal sample set (e.g., two points for line fitting) was further modified to use prior information. The minimal sample set formation was guided in a semi-random fashion where the model randomly picks data and fits the model θf (generates the hypothesis), but only moves forward if θf has the desired form (e.g., the line slope falls in a predefined range). The guided search scheme is useful to incorporate our knowledge of the aponeuroses and fascicles range of motion and could facilitate the detection process to be 5 times faster.
Since relative locations of the aponeuroses and fascicles are known, detection was performed on the upper-half and lower-half of the US images to detect superficial and deep aponeuroses, respectively. Subsequently, the area between two aponeuroses was used as the region of interest for fascicle detection.
5). Detection-Tracking Scheme
To decrease the computational cost and increase image processing accuracy, a detection-tracking scheme was manipulated to leverage the guided-search capability of RANSAC. For each object, using the final model from frame f, the search area and the range of model parameters for frame f+1 were localized to guide RANSAC. The possible translation (tr) and rotation (ro) of the aponeuroses and fascicle were used to specify the range for each aponeurosis and fascicle as
| (9) |
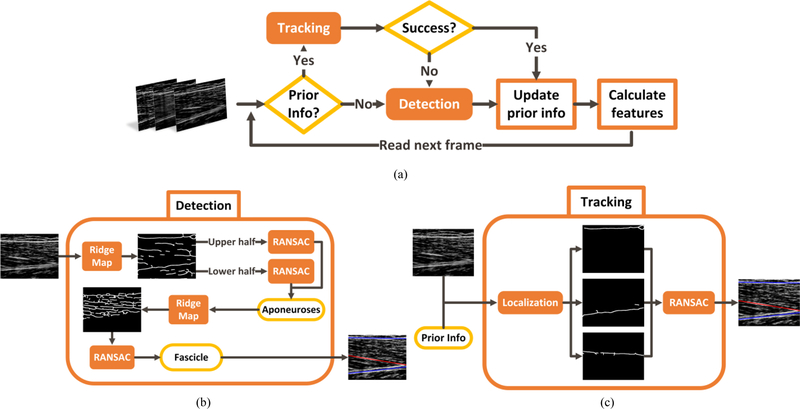
With both aponeuroses and the strongest fascicle detected in each frame, the echogenicity was measured by averaging the intensity of all pixels in the region of interest. The region of interest for calculation of echogenicity was the muscle segment in the field of view, including the aponeuroses. Muscle thickness and aponeuroses angle were calculated as the average distance, and the difference in orientations, between the two aponeuroses, respectively. Pennation angle was defined as the angle between the detected fascicle and deep aponeurosis. The fascicle was assumed not to be curved and its length was calculated by intersecting it by the two aponeuroses. Analysis of all the frames in an US sequence results in a set of time-series for the five US features. The US feature segmentation algorithm is summarized in Fig. 2.
Fig. 2.
US feature segmentation algorithm. (a) Overview of the detection-tracking scheme, (b) Detection of the aponeuroses and the strongest fascicle, and (c) Tracking in a subsequent frame based on the prior detection information.
C. Motion Analysis
1). Correlation
A correlation study was performed to assess the potential of each US feature to estimate the knee motion parameters. Correlation parameters of each feature time-series to angle and angular velocity was measured using linear univariate regression. This understanding could be beneficial to rank the features based on their correlation score, and potentially eliminate unnecessary features to reduce the computational cost of segmentation and allow real-time operation.
2). Motion Estimation
To estimate knee joint motion parameters, including angle and angular velocity, a regression-based machine learning approach was utilized to generate continuous motion estimation data. US features were used as predictors and two different Gaussian process regression (GPR) models with quadratic kernels were trained to estimate knee kinematic parameters as the responses [39]. For consistency of data across the experiment sessions and for individual subjects, each feature time-series was normalized to its mean value. Subsequently, normalized time-series were used to train the GPR models.
3). Feature Selection and Validation
In most machine learning approaches, overfitting to training data and generalizability of the prediction performance to the future data can be an issue. Cross-validation (CV) is a widely used method to address these problems [40]. Although it is a common practice in some studies to first find a “good” subset of predictors and then start training models and cross-validating them, this approach is prone to give an optimistically biased estimation of performance [41], [42]. Since the quality of each US feature as a predictor is not clear and they vary among different datasets, the feature selection process needs to be done for individual datasets. To avoid biased estimation of accuracy while performing feature selection, a technique called nested CV was used, which is regarded as an unbiased estimator of prediction performance [42], [43].
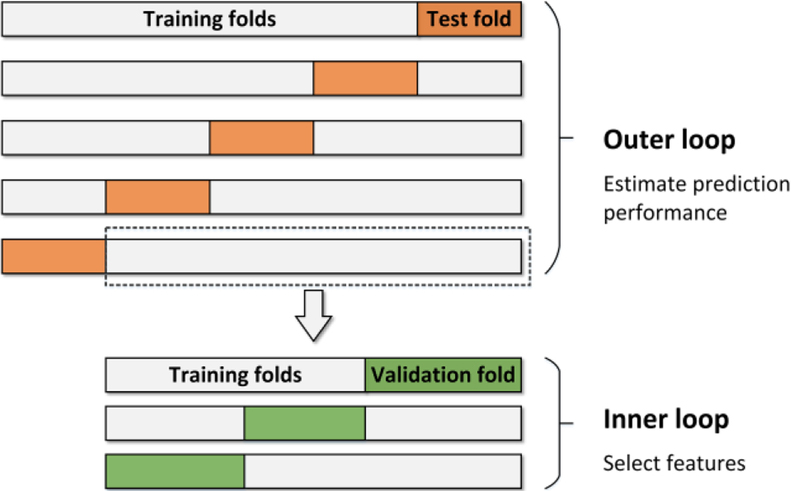
For an entire dataset of the features (F), two nested CV loops are performed as illustrated in Fig. 3. The repeating inner 3-fold CV loop involves the model parameter tuning and the feature selection, whereas the outer 5-fold CV loop estimates the generalization error of the whole “training process” occurred in the inner loop. A portion of data is randomly picked in every cycle of the outer loop to be used as the data for the inner loop. To select the best set of features, the inner loop is repeatedly performed for a given combination of features α =comb(Fi), and the average error ē (α) over the 3 folds is calculated. For each cycle of the outer loop, a model is trained as follows
| (10) |
| (11) |
Fig. 3.
Illustration of nested-cross-validation. Inner loop selects the best feature set and trains a models using that set through a 3-fold CV. Outer loop cross-validates the inner loop process through a 5-fold CV to estimate the accuracy.
Where α* is the best feature set and Mk is the resulting model from the training process in the inner loop. The outer loop takes α * as the input feature set, cross-validates the process Mk and estimates its accuracy.
| (12) |
| (13) |
Applying the process M to the entire dataset F, the final model P is obtained. ê in (12) denotes the final performance estimate of the training process for an individual subject. The motion estimation error was calculated during the training process explained above by the root mean square error (RMSE) between the estimated motion time-series ŷt and the measured time-series yt. Since feature selection is an integral part of the process M, GPR models were not necessarily trained using all the US features.
III. Results
A. US Feature Segmentation Result
1). Structure Extraction
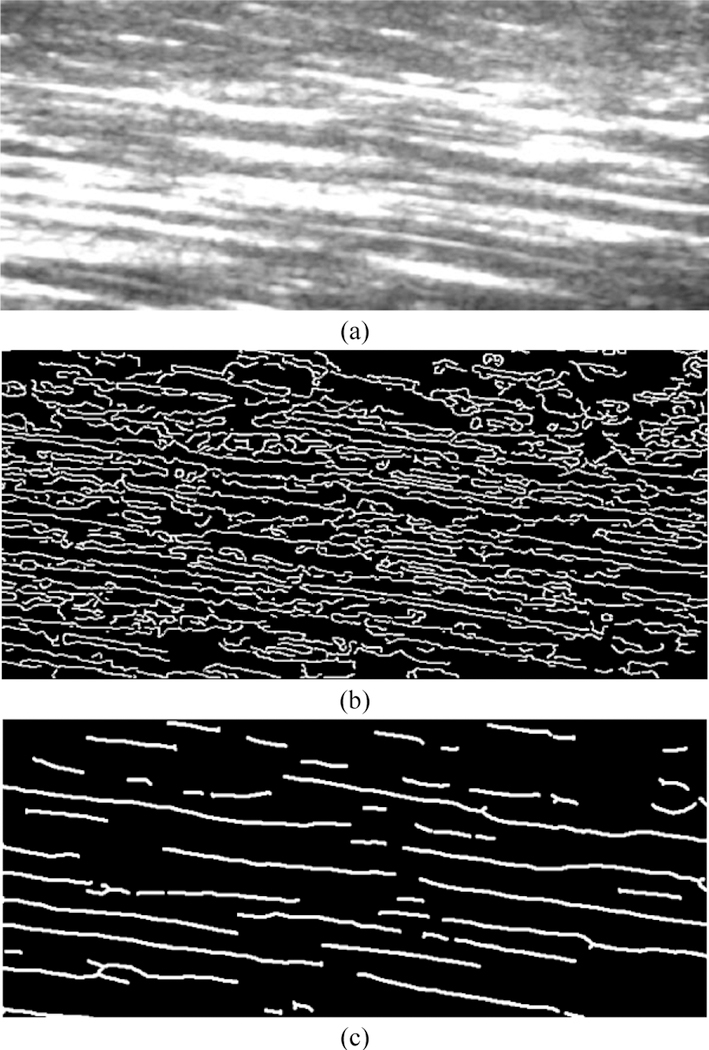
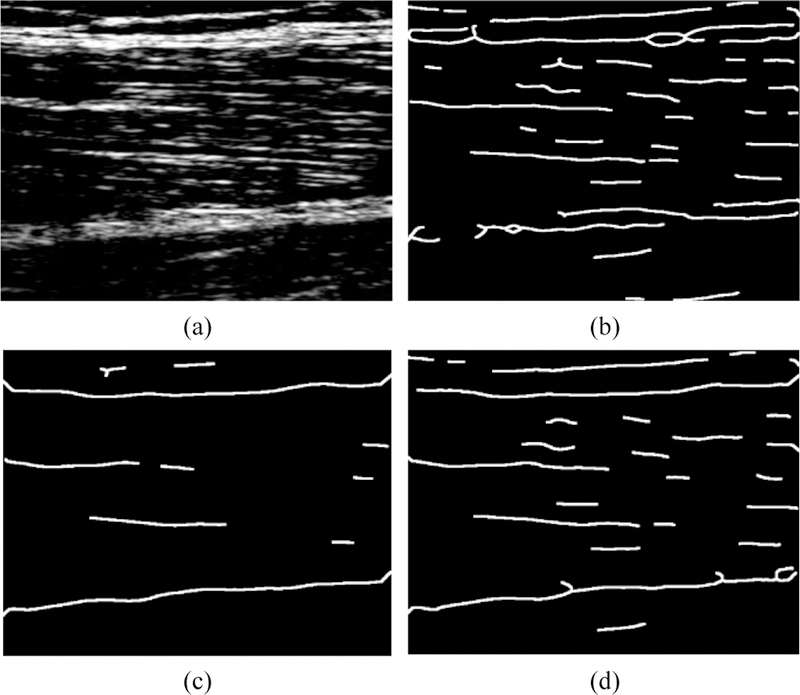
Even though the effectiveness of ridge filter enhancement and its contribution to reliability of the final detection result is not completely quantifiable, it was compared with the commonly used edge filter. Fig. 4 compares the fascicle structures extracted by an edge map, obtained by Canny edge detector, and the fascicle structures extracted by a ridge map. Whereas individual fascicles are very difficult to recognize in the edge map, the ridge map represents a very clear delineation of individual muscle fascicles.
Fig. 4.
(a) An unfiltered US image of RF muscle fascicles, (b) The structure extraction by the conventionally used edge map, (c) The structure extraction proposed by the ridge map that considerably enhances the quality.
Even a well-constructed ridge map may lead to failure in proper detection of underlying image structures if it works in favor of a group of structures with similar attributes. Low scale-sets could cause an adversely strong representation of fascicles whereas aponeuroses may be reflected as broken structures as shown in Fig. 5(a). Fig. 5 demonstrates the advantage of the multiscale ridge filtering strategy. The multiscale ridge map, Fig. 5(d), provides an equally good representation of both fascicles and aponeuroses, whereas a single-scale ridge map may fail to represent one group, depending on the filtering scale, as shown in Figs. 5(b), 5(c).
Fig. 5.
(a) An unfiltered US image of RF muscle, (b) Low-scale-filtered ridge map that failed to provide a good representation of aponeuroses, (c) High-scale-filtered ridge map that failed to provide a good representation of fascicles, (d) Multi-scale-filtered ridge map that could provide a good representation of both fascicles and aponeuroses.
2). Detection-Tracking
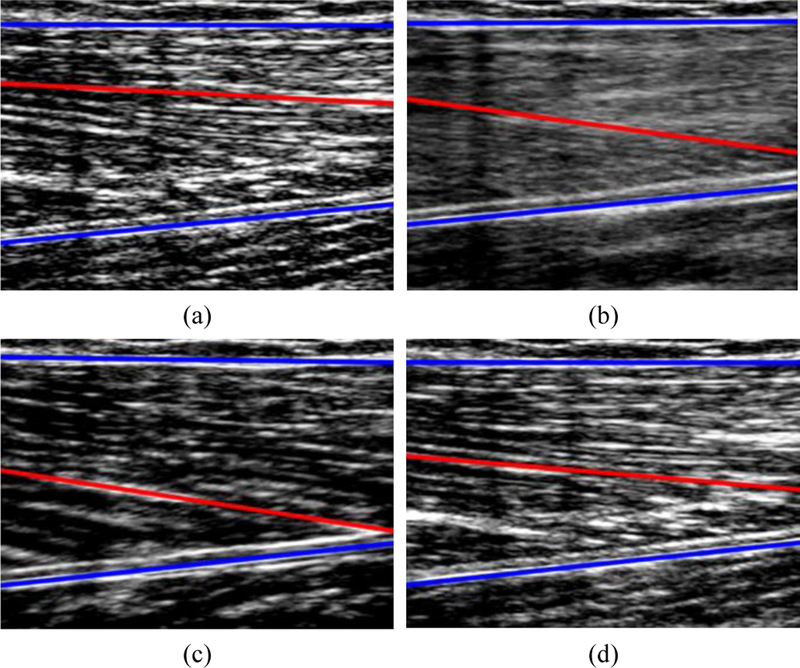
The detection algorithm enables segmentation of the two aponeuroses and the strongest fascicle in a single frame, as shown in Fig. 6(a). The inclusion of the detection-tracking scheme would further make the algorithm capable of tracking the detected objects; which is inherently faster. To leverage the localized search capability, the range of motion and thickness of aponeuroses and fascicles were used as prior knowledge for detection. The parameters were optimized based on the insights from other studies [19, 20, 23], and the collected data in this experiment. Hence, orientation range of superficial aponeurosis was specified between −3 to 3 degrees, as it is attached to the skin through the subcutaneous fat layer, and orientation of deep aponeurosis between 160 to 180 degrees. The orientation of the fascicle was also considered in the range between 0 to 20 degrees, which helps guide the search in RANSAC. The thickness of the fascicles is around 1 mm, and the width of aponeuroses varies between 1 to 3 mm [23], as used to determine the distance threshold in the formation of the consensus set. Additionally, a smaller range of motion was employed as prior information for tracking [28], where the fascicle was assumed to have a maximum translation of 1 mm and to rotate no more than 1.5 degrees between two successive frames. Aponeuroses do not move as much as fascicles, so their maximum translation was approximately 1 mm and maximum rotation was found to be 0.5 degrees. The conversion of actual sizes in mm to spatial sizes in pixels was reliant on the image scaling of each specific US sequence.
Fig. 6.
Segmentation and tracking of muscle aponeuroses (shown in blue) and the strongest fascicle (shown in red) during a recorded US sequence of knee extension-flexion. Total duration of sequence was 5.4 seconds. (a) Knee angle: 1.44 deg – Rest, (b) Knee angle: 30.68 deg, (c) Knee angle: 75.41 deg – Extended, (d) Knee angle: 0.05 deg – Rest.
Fig. 6 displays the outcome of segmentation during an US sequence of knee flexion/extension where the aponeuroses are shown in blue and the segmented fascicle in red.
3). US Features
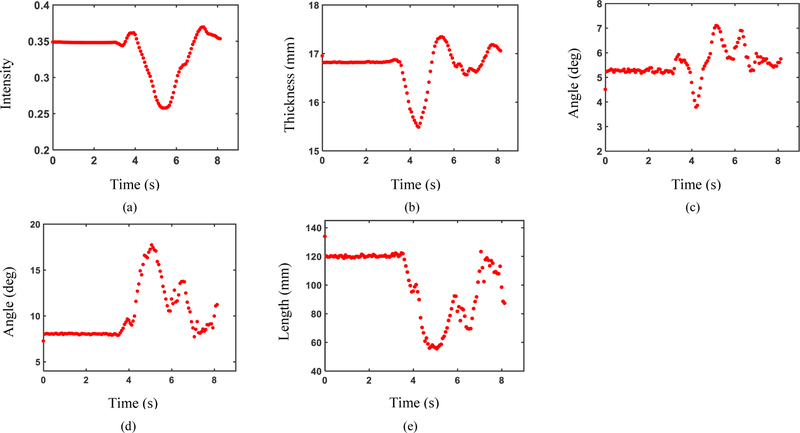
Analysis of US sequences using the proposed algorithm resulted in a time-series for each US feature. The US features from a sample subject captured from contraction of RF during knee flexion/extension are shown in Fig. 7.
Fig. 7.
Measured US features from an US sequence of RF contraction by a sample subject during knee extension/flexion. (a) Echogenicity, (b) Muscle thickness, (c) Angle between aponeuroses, (d) Pennation angle, and (e) Fascicle length.
B. Motion Analysis Results
The time-series of US features from each subject leg were utilized as a dataset to study the correlation of US features with kinematic motion parameters of distal limb and GPR model training.
1). Correlation Study
Among all the features, muscle echogenicity and thickness were consistently found to have the highest correlation with the angle and angular velocity, respectively. The other US features also exhibited a correlation to knee joint motion. Based on the feature selection outcomes, for joint angle estimation, echogenicity and thickness appeared in the best feature set for all the subjects, followed by the other US features that appeared in the best feature set for seven subjects. In the case of angular velocity, pennation angle and fascicle length appeared in the best feature set for 6 subjects and the other US features appeared in the best feature set for all the subjects. However, no consistent order was observed to help rank them based on their motion estimation power or to eliminate any of them due to poor correlation.
2). Motion Estimation
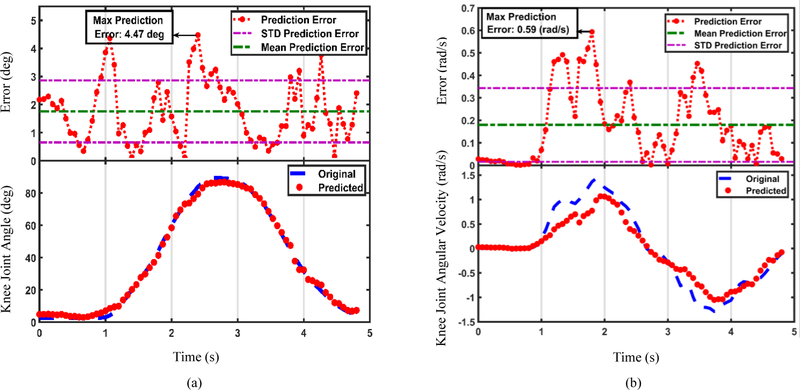
US features could estimate the knee motion using the models trained for each subject. It must be examined how well the estimation fits the original motion trajectory. The distribution of motion estimation errors during the movement is also useful for implementation purposes. Fig. 8 represents the quality of fit and error distribution of estimated knee joint angle (Fig. 8(a)), and angular velocity (Fig. 8(b)), using the GPR models trained by the US features shown in Fig. 7.
Fig. 8.
(a) Estimated knee joint angle and (b) estimated knee joint angular velocity using the US features shown in Fig. 7. The recorded motion profiles are shown in blue dashed lines and the estimated motion profiles are shown in red dots, at the bottom of the figures. Distributions of the absolute motion estimation error values are illustrated at the top.
In addition, performance of the models was estimated through the nested-CV. RMSE of the estimated trajectories for individual subjects are presented in Tables I and II. Table I contains the results of knee joint angle estimation performance and Table II for the angular velocity. Overall, motion estimation performance averaged to 7.45 degrees for knee joint angle (Table I), and to 0.262 rad/s for angular velocity (Table II), across all the subjects.
Table I.
RMS Error in Degrees for Knee Joint Angle Estimation
| Subject: | 1 | 2 | 3 | 4 | 5 | 6 | 7 | 8 | 9 | Average | STD. |
|---|---|---|---|---|---|---|---|---|---|---|---|
| Right Leg | 2.76 | 5.54 | 4.93 | 10.04 | 7.49 | 3.47 | 15.53 | 3.31 | 4.48 | 6.39 | 4.12 |
| Left Leg | 4.03 | 8.56 | 9.13 | 6.96 | 3.91 | 8.07 | 10.58 | 14.36 | 10.88 | 8.50 | 3.32 |
| Subject Avg. | 3.39 | 7.05 | 7.03 | 8.50 | 5.70 | 5.77 | 13.05 | 8.84 | 7.68 | 7.45 | 3.72 |
TABLE II.
RMS Error in Radians Per Second (Rad/S) for Knee Joint Angular Velocity Estimation
| Subject: | 1 | 2 | 3 | 4 | 5 | 6 | 7 | 8 | 9 | Average | STD. |
|---|---|---|---|---|---|---|---|---|---|---|---|
| Right Leg | 0.22 | 0.25 | 0.18 | 0.20 | 0.13 | 0.13 | 0.25 | 0.15 | 0.21 | 0.190 | 0.045 |
| Left Leg | 0.27 | 0.42 | 0.29 | 0.25 | 0.24 | 0.24 | 0.46 | 0.35 | 0.48 | 0.333 | 0.098 |
| Subject Avg. | 0.24 | 0.33 | 0.24 | 0.22 | 0.18 | 0.19 | 0.36 | 0.25 | 0.34 | 0.262 | 0.071 |
IV. Discussion
The segmentation-estimation framework evaluated the feasibility of using US as a peripheral interface for lower-extremity applications, through an US feature segmentation algorithm. The algorithm exhibits good precision for lower-limb human motion estimation and demonstrates the viability of US-based motion estimation. Hence, the study hypothesis was supported and it seems possible to estimate human lower-limb distal movements using proximal muscle kinematics and kinetics, measured by US imaging. Interpretation of our results and potential improvements and applications will be discussed in the following sections.
A. Advantages of the Proposed Approach
Feature segmentation algorithm is fully autonomous, which is a major advantage and enables practical implementation. The algorithm had a relatively low computational cost and the mean processing time for a 600×600 pixels frame was ~3 fps with fascicle detection and 5~6 fps without detection of the fascicle. This processing time, which is at least 15 times faster than the reported time for a similar method [27], is promising towards the goal of real-time implementation.
As can be seen in Fig. 7, a slight difference was observed between the initial and final values of the US features that is likely due to muscle tonicity, but it did not interfere with the motion estimation performance. The motion estimation by GPR models was precise and could detect small changes in the motion profile, as may be observed in Fig. 8(b). The models were relatively robust to segmentation error. However, segmentation outliers with large deviations may cause erroneous estimations. For instance, muscle morphology undergoes a rapid change at the onset of deformation which makes the images blurry and may lower segmentation accuracy. Hence, it may be the reason that causes the estimation errors in Table I and II, especially the higher RMS error values at transitions from rest to motion and motion to rest in Fig. 8.
Our approach improved the results of a similar study in the prediction of knee joint angle [18]. Possible reasons include the inclusion of more US features in the proposed approach and the effect of NMES-induced contraction. Motion estimation accuracy of the proposed approach (7.45±3.7 degrees), is also very close to a similar study that utilized sEMG for volitional prosthetic control during non-weight-bearing knee flexion/extension movement and achieved a trajectory tracking error of 6.75±1.06 degrees [9].
B. Potential Improvements and Limitations
There are a few considerations and potential improvements to the algorithm that need to be considered for implementation on an assistive device. Appropriate choice of scale sets is important to the success of the algorithm and should be optimized based on the data. For instance, utilizing very small scales may result in sensitivity of the ridge-filter to noise and artifacts, and representation of aponeurosis as a few disconnected objects. RANSAC can handle object non-uniformities using its threshold-based model fitting; however, the choice of threshold affects the accuracy of detection and extremely low and high thresholds may lead to wrong detection.
We were able to estimate knee joint motion using US images of RF as the only source of information; however, using US images of multiple layers of muscle (e.g. RF and vastus intermedius) could potentially further improve the accuracy of the method. To adapt the model for multiple layers of muscle, a multi-model fitting approach can be used such as multiRANSAC [44]. Additionally, accurate estimation of angular velocity, solely from either flexor or extensor muscles, is hard to achieve, so a future direction would be to use simultaneous measurements from both muscle groups for velocity estimation. Due to in-series compliance of muscle-tendon units, muscle fascicle behavior does not necessarily reflect joint motion [45]. Also, RF is a bi-articular muscle, crossing both knee and hip joints, and might show little to no length change during multi-joint movements. Hence, relevancy of the approach (especially, the fascicle features) needs to be further investigated for the activities involving the movement of multiple joints. The contribution of US features of the other muscles in the upper leg may need to be studied to find the possible sources of information for motion estimation. A correlation (R2 > 0.6) was also observed between pennation angle and fascicle length. Given that the features related to fascicles did not exhibit the highest motion estimation power, and the high computational cost of fascicle detection, alternative methods to measure the dominant orientation of fascicles may be helpful rather than direct segmentation. Moreover, the algorithm may further benefit from using parallel processing techniques and GPU-accelerated computing to decrease the computational cost.
This work was intended to serve as a proof of viability of using US as an interface for lower-limb motion estimation. Yet there are a few limitations that should be noted and investigated in the next study. GPR models were trained using individual subjects, thus, future work is needed toward motion estimation of novel subjects. Proximal neuromuscular disorders or dystrophy may accompany distal joint disabilities, and the estimation accuracy may reduce for amputee subjects due to their decreased ability to contract the muscles in residual limb, as reported for upper-limb amputees [46]. Therefore, for the proposed method to find its application in assistive device control, ultrasound images from impaired muscles and residual limb of amputee subjects should be included and appropriate refinements are necessary. In this study, we used a regular linear array US probe, placed on the thigh by a 3D-printed holder. While this type of probe is very easy to access, it has a non-conforming surface, touching the skin through a water-based transmission gel to match the acoustic impedance of the probe with the skin. We examined the setup over a three hours period of various activities and did not observe a decrease in image quality. Nevertheless, it is still prone to having contact issues over a longer period of time. Moreover, misalignment of the linear US transducer, errors in its orientation, and relative motion of transducer and skin might alleviate the estimation performance [47]. Hence, we are planning to evaluate the sensitivity and robustness of the proposed approach to these changes in future studies. The sampling rate of the US scanner was relatively low, and it might not be enough to capture muscle movements during the activities that have a higher pace. Therefore, higher sampling may be desired in the future. With recent efforts in miniaturization of US technology [48–50], a feasible ultimate state would be to incorporate this technology as a dedicated US transducer, embedded in the socket of the prosthetic, contacting the skin through non-liquid transmission materials and controlled by a small, low-power microprocessing unit.
US kinetic features are anticipated to precede muscle force production and US kinematic features are anticipated to precede joint motion. However, a reliable measurement of the amount of time that US features precede the joint motion is needed. An interesting direction for the future works is then to study whether US features are helpful to predict the motion in time. Additionally, the amount of time that the joint motion could be accurately predicted in time should be measured.
C. Potential Applications
As a preliminary study with US data, the results are promising and may help overcome the challenges in volitional control. Hence, the results of this study might be directly applied to the volitional control of assistive devices for non-weight-bearing volitional movements. Since different US features are indicative of different characteristics of muscle contraction, (e.g. muscle thickness is related to the level of contraction and fascicle length could be regarded as an indicator of muscle lengthening and shortening), our approach could be used to estimate other motion parameters and handle other sorts of tasks. For instance, muscle lengthening and shortening is the distinctive feature between dynamic and isometric contractions and we anticipate that the kinematic US features might help differentiate between the two types of tasks. Therefore, there are a number of other applications for this approach, including joint motion estimation during weight-bearing volitional movements such as sit-to-stand, and correlating the US measurements with the knee joint torque to gain insights into feasibility of using US for direct joint torque control. Moreover, US features may exhibit different patterns for different locomotion modes, hence, the proposed approach can be used for classification of locomotion modes and transition detection.
Appropriate control inputs provided by the US interface will enhance the control intuitiveness and can be utilized in various devices including powered prosthetics and exoskeletons. The proposed approach may also be employed to regulate joint stiffness parameters in a passively-controlled assistive device to improve its performance on various terrains.
V. Conclusion
Using US imaging as a neural interface for lower-limb motion estimation appears promising. An approach was demonstrated to use proximal musculature to estimate distal motion. Motion estimation results are promising and the ability of feature extraction algorithm to operate in real-time further motivates the future work toward volitional and direct assistive device control. The high level of motion estimation accuracy achieved by US can potentially lead to significant improvements in assistive device control, including subject invariance, improved intuitiveness and volitional control. Eventually, overcoming these challenges will propel the movement toward fully autonomous lower-limb assistive devices.
Acknowledgment
The authors would like to acknowledge Katherine Brown, MS, Debabrata Ghosh, PhD, and Nathaniel Pickle, PhD, for their insightful suggestions on this project and help with manuscript preparation. The authors would also like to thank Zhe Wu, PhD, from Lonshine Technologies for modifying the mSonic handheld US scanner to allow the extended image acquisitions needed for this project.
This work was supported in part by the National Institutes of Health under NIH/NCI grant R21CA212851 and NIH/NIBIB grant K25EB017222.
Contributor Information
Mohammad Hassan Jahanandish, Department of Bioengineering, University of Texas at Dallas, Richardson, TX 75080, USA..
Nicholas P. Fey, Department of Bioengineering, University of Texas at Dallas, and the Department of Physical Medicine & Rehabilitation, University of Texas Southwestern Medical Center, Dallas, TX 75390, USA..
Kenneth Hoyt, Department of Bioengineering, University of Texas at Dallas, Richardson, TX 75080, USA, and the Department of Radiology, University of Texas Southwestern Medical Center, Dallas, TX 75390, USA..
REFERENCES
- [1].Brault MW, Americans with disabilities: 2010. US Department of Commerce, Economics and Statistics Administration, US Census Bureau; Washington, DC, 2012. [Google Scholar]
- [2].Goldfarb M, Lawson BE, and Shultz AH, “Realizing the promise of robotic leg prostheses,” Science translational medicine, vol. 5, no. 210, pp. 210ps15–210ps15, 2013. [DOI] [PubMed] [Google Scholar]
- [3].Villarreal DJ, Poonawala HA, and Gregg RD, “A robust parameterization of human gait patterns across phase-shifting perturbations,” IEEE Transactions on Neural Systems and Rehabilitation Engineering, vol. 25, no. 3, pp. 265–278, 2017. [DOI] [PMC free article] [PubMed] [Google Scholar]
- [4].Gregg RD, Lenzi T, Hargrove LJ, and Sensinger JW, “Virtual constraint control of a powered prosthetic leg: From simulation to experiments with transfemoral amputees,” IEEE Transactions on Robotics, vol. 30, no. 6, pp. 1455–1471, 2014. [DOI] [PMC free article] [PubMed] [Google Scholar]
- [5].Williams RJ, Hansen AH, and Gard SA, “Prosthetic ankle-foot mechanism capable of automatic adaptation to the walking surface,” Journal of biomechanical engineering, vol. 131, no. 3, p. 035002, 2009. [DOI] [PubMed] [Google Scholar]
- [6].Tucker MR et al. , “Control strategies for active lower extremity prosthetics and orthotics: a review,” Journal of neuroengineering and rehabilitation, vol. 12, no. 1, p. 1, 2015. [DOI] [PMC free article] [PubMed] [Google Scholar]
- [7].Hoover CD, Fulk GD, and Fite KB, “Stair ascent with a powered transfemoral prosthesis under direct myoelectric control,” IEEE/ASME Transactions on Mechatronics, vol. 18, no. 3, pp. 1191–1200, 2013. [Google Scholar]
- [8].Hargrove LJ et al. , “Intuitive control of a powered prosthetic leg during ambulation: a randomized clinical trial,” Jama, vol. 313, no. 22, pp. 2244–2252, 2015. [DOI] [PubMed] [Google Scholar]
- [9].Ha KH, Varol HA, and Goldfarb M, “Volitional control of a prosthetic knee using surface electromyography,” IEEE Transactions on Biomedical Engineering, vol. 58, no. 1, pp. 144–151, 2011. [DOI] [PubMed] [Google Scholar]
- [10].Hargrove LJ, Simon AM, Lipschutz R, Finucane SB, and Kuiken TA, “Non-weight-bearing neural control of a powered transfemoral prosthesis,” Journal of neuroengineering and rehabilitation, vol. 10, no. 1, p. 62, 2013. [DOI] [PMC free article] [PubMed] [Google Scholar]
- [11].Hargrove LJ et al. , “Robotic leg control with EMG decoding in an amputee with nerve transfers,” New England Journal of Medicine, vol. 369, no. 13, pp. 1237–1242, 2013. [DOI] [PubMed] [Google Scholar]
- [12].Raiteri BJ, Cresswell AG, and Lichtwark GA, “Ultrasound reveals negligible cocontraction during isometric plantar flexion and dorsiflexion despite the presence of antagonist electromyographic activity,” Journal of Applied Physiology, vol. 118, no. 10, pp. 1193–1199, 2015. [DOI] [PubMed] [Google Scholar]
- [13].Castellini C et al. , “Proceedings of the first workshop on peripheral machine interfaces: Going beyond traditional surface electromyography,” Frontiers in neurorobotics, vol. 8, 2014. [DOI] [PMC free article] [PubMed] [Google Scholar]
- [14].Sikdar S et al. , “Novel method for predicting dexterous individual finger movements by imaging muscle activity using a wearable ultrasonic system,” IEEE Transactions on Neural Systems and Rehabilitation Engineering, vol. 22, no. 1, pp. 69–76, 2014. [DOI] [PubMed] [Google Scholar]
- [15].Castellini C, Passig G, and Zarka E, “Using ultrasound images of the forearm to predict finger positions,” IEEE Transactions on Neural Systems and Rehabilitation Engineering, vol. 20, no. 6, pp. 788–797, 2012. [DOI] [PubMed] [Google Scholar]
- [16].Huang Y, Yang X, Li Y, Zhou D, He K, and Liu H, “Ultrasound-based sensing models for finger motion classification,” IEEE journal of biomedical and health informatics, vol. 22, no. 5, pp. 1395–1405, 2018. [DOI] [PubMed] [Google Scholar]
- [17].Akhlaghi N et al. , “Real-time classification of hand motions using ultrasound imaging of forearm muscles,” IEEE Transactions on Biomedical Engineering, vol. 63, no. 8, pp. 1687–1698, 2016. [DOI] [PubMed] [Google Scholar]
- [18].Qiu S et al. , “Sonomyography Analysis on Thickness of Skeletal Muscle During Dynamic Contraction Induced by Neuromuscular Electrical Stimulation: A Pilot Study,” IEEE Transactions on Neural Systems and Rehabilitation Engineering, vol. 25, no. 1, pp. 62–70, 2017. [DOI] [PubMed] [Google Scholar]
- [19].Fukunaga T, Kawakami Y, Kuno S, Funato K, and Fukashiro S, “Muscle architecture and function in humans,” Journal of biomechanics, vol. 30, no. 5, pp. 457–463, 1997. [DOI] [PubMed] [Google Scholar]
- [20].Reeves ND and Narici MV, “Behavior of human muscle fascicles during shortening and lengthening contractions in vivo,” Journal of Applied Physiology, vol. 95, no. 3, pp. 1090–1096, 2003. [DOI] [PubMed] [Google Scholar]
- [21].Cronin NJ, Carty CP, Barrett RS, and Lichtwark G, “Automatic tracking of medial gastrocnemius fascicle length during human locomotion,” Journal of Applied Physiology, vol. 111, no. 5, pp. 1491–1496, 2011. [DOI] [PubMed] [Google Scholar]
- [22].Wakeling JM, Blake OM, Wong I, Rana M, and Lee SS, “Movement mechanics as a determinate of muscle structure, recruitment and coordination,” Philosophical Transactions of the Royal Society of London B: Biological Sciences, vol. 366, no. 1570, pp. 1554–1564, 2011. [DOI] [PMC free article] [PubMed] [Google Scholar]
- [23].Rehorn MR and Blemker SS, “The effects of aponeurosis geometry on strain injury susceptibility explored with a 3D muscle model,” Journal of biomechanics, vol. 43, no. 13, pp. 2574–2581, 2010. [DOI] [PMC free article] [PubMed] [Google Scholar]
- [24].Dieterich AV et al. , “Spatial variation and inconsistency between estimates of onset of muscle activation from EMG and ultrasound,” Scientific reports, vol. 7, p. 42011, 2017. [DOI] [PMC free article] [PubMed] [Google Scholar]
- [25].Zhou Y and Zheng Y-P, “Estimation of muscle fiber orientation in ultrasound images using revoting hough transform (RVHT),” Ultrasound in medicine & biology, vol. 34, no. 9, pp. 1474–1481, 2008. [DOI] [PubMed] [Google Scholar]
- [26].Rana M, Hamarneh G, and Wakeling JM, “Automated tracking of muscle fascicle orientation in B-mode ultrasound images,” Journal of biomechanics, vol. 42, no. 13, pp. 2068–2073, 2009. [DOI] [PubMed] [Google Scholar]
- [27].Zhou G-Q and Zheng Y-P, “Automatic fascicle length estimation on muscle ultrasound images with an orientation-sensitive segmentation,” IEEE Transactions on Biomedical Engineering, vol. 62, no. 12, pp. 2828–2836, 2015. [DOI] [PubMed] [Google Scholar]
- [28].Zhao H and Zhang L-Q, “Automatic tracking of muscle fascicles in ultrasound images using localized radon transform,” IEEE transactions on biomedical engineering, vol. 58, no. 7, pp. 2094–2101, 2011. [DOI] [PubMed] [Google Scholar]
- [29].Marzilger R, Legerlotz K, Panteli C, Bohm S, and Arampatzis A, “Reliability of a semi-automated algorithm for the vastus lateralis muscle architecture measurement based on ultrasound images,” European journal of applied physiology, vol. 118, no. 2, pp. 291–301, 2018. [DOI] [PubMed] [Google Scholar]
- [30].Zhou Y, Yang X, Yang W, Shi W, Cui Y, and Chen X, “Recent Progress in Automatic Processing of Skeletal Muscle Morphology Using Ultrasound: A Brief Review,” Current Medical Imaging Reviews, vol. 14, no. 2, pp. 179–185, 2018. [Google Scholar]
- [31].Caresio C, Salvi M, Molinari F, Meiburger KM, and Minetto MA, “Fully automated muscle ultrasound analysis (MUSA): Robust and accurate muscle thickness measurement,” Ultrasound in medicine & biology, vol. 43, no. 1, pp. 195–205, 2017. [DOI] [PubMed] [Google Scholar]
- [32].Almansa A and Lindeberg T, “Fingerprint enhancement by shape adaptation of scale-space operators with automatic scale selection,” IEEE Transactions on Image Processing, vol. 9, no. 12, pp. 2027–2042, 2000. [DOI] [PubMed] [Google Scholar]
- [33].Li Y and Gans NR, “Predictive RANSAC: Effective Model Fitting and Tracking Approach Under Heavy Noise and Outliers,” Computer Vision and Image Understanding, 2017.
- [34].Lindeberg T, “Edge detection and ridge detection with automatic scale selection,” International Journal of Computer Vision, vol. 30, no. 2, pp. 117–156, 1998. [Google Scholar]
- [35].Otsu N, “A threshold selection method from gray-level histograms,” IEEE transactions on systems, man, and cybernetics, vol. 9, no. 1, pp. 62–66, 1979. [Google Scholar]
- [36].Lam L, Lee S-W, and Suen CY, “Thinning methodologies-a comprehensive survey,” IEEE Transactions on pattern analysis and machine intelligence, vol. 14, no. 9, pp. 869–885, 1992. [Google Scholar]
- [37].Fischler MA and Bolles RC, “Random sample consensus: a paradigm for model fitting with applications to image analysis and automated cartography,” Communications of the ACM, vol. 24, no. 6, pp. 381–395, 1981. [Google Scholar]
- [38].Torr PH and Zisserman A, “MLESAC: A new robust estimator with application to estimating image geometry,” Computer Vision and Image Understanding, vol. 78, no. 1, pp. 138–156, 2000. [Google Scholar]
- [39].Rasmussen CE, “Gaussian processes in machine learning,” in Advanced lectures on machine learning: Springer, 2004, pp. 63–71. [Google Scholar]
- [40].Friedman J, Hastie T, and Tibshirani R, The elements of statistical learning. Springer series in statistics New York, 2001.
- [41].Bengio Y and Grandvalet Y, “No unbiased estimator of the variance of k-fold cross-validation,” Journal of machine learning research, vol. 5, no. Sep, pp. 1089–1105, 2004. [Google Scholar]
- [42].Cawley GC and Talbot NL, “On over-fitting in model selection and subsequent selection bias in performance evaluation,” Journal of Machine Learning Research, vol. 11, no. Jul, pp. 2079–2107, 2010. [Google Scholar]
- [43].Varma S and Simon R, “Bias in error estimation when using cross-validation for model selection,” BMC bioinformatics, vol. 7, no. 1, p. 91, 2006. [DOI] [PMC free article] [PubMed] [Google Scholar]
- [44].Zuliani M, Kenney CS, and Manjunath B, “The multiransac algorithm and its application to detect planar homographies,” in Image Processing, 2005. ICIP 2005. IEEE International Conference on, 2005, vol. 3, pp. III–153: IEEE. [Google Scholar]
- [45].Lichtwark G, Bougoulias K, and Wilson A, “Muscle fascicle and series elastic element length changes along the length of the human gastrocnemius during walking and running,” Journal of biomechanics, vol. 40, no. 1, pp. 157–164, 2007. [DOI] [PubMed] [Google Scholar]
- [46].Baker CA, Akhlaghi N, Rangwala H, Kosecka J, and Sikdar S, “Real-time, ultrasound-based control of a virtual hand by a trans-radial amputee,” in Engineering in Medicine and Biology Society (EMBC ), 2016. IEEE 38th Annual International Conference of the, 2016, pp. 3219–3222: IEEE. [DOI] [PubMed] [Google Scholar]
- [47].Khan AA, Dhawan A, Akhlaghi N, Majdi JA, and Sikdar S, “Application of wavelet scattering networks in classification of ultrasound image sequences,” in Ultrasonics Symposium (IUS), 2017 IEEE International, 2017, pp. 1–4: IEEE. [Google Scholar]
- [48].Cheng X, Chen J, Li C, Liu J-H, Shen I-M, and Li P-C, “A miniature capacitive ultrasonic imager array,” IEEE Sensors Journal, vol. 9, no. 5, pp. 569–577, 2009. [Google Scholar]
- [49].Gerardo CD, Cretu E, and Rohling R, “Fabrication and testing of polymer-based capacitive micromachined ultrasound transducers for medical imaging,” Microsystems & Nanoengineering, vol. 4, no. 1, p. 19, 2018. [DOI] [PMC free article] [PubMed] [Google Scholar]
- [50].Yang X, Sun X, Zhou D, Li Y, and Liu H, “Towards wearable A-mode ultrasound sensing for real-time finger motion recognition,” IEEE Transactions on Neural Systems and Rehabilitation Engineering, vol. 26, no. 6, pp. 1199–1208, 2018. [DOI] [PubMed] [Google Scholar]


