Abstract
Background
Nearly 40% of Global Fund money goes toward procurement. However, no analyses have been published to show how costs vary across regions and time, despite the availability of procurement data collected through the Global Fund’s price and quality reporting system.
Methodology
We analyzed data for the 3 most widely procured commodities for the prevention, diagnosis, and treatment of HIV. These were male condoms, HIV rapid tests, and the antiretroviral (ARV) combination of lamivudine/nevirapine/zidovudine. The compared costs, first across time (2005–2012), then across regions, and finally, between individual procurement reported through the price and quality reporting and pooled procurement reported through the Global Fund’s voluntary pooled procurement system. All costs were adjusted for inflation and reported in US dollars.
Key Findings
There were 2337 entries from 578 grants in 125 countries. The procurement cost for the ARV dropped substantially over the period, whereas those for condoms and HIV tests remained relatively stable. None of the commodity prices increased. Regional variations were pronounced for HIV tests, but minimal for condoms and the ARV. The unit cost for the 3-table ARV combination, for instance, varied between US$0.15 and US$0.23 in South Asia and the Eastern Europe/Central Asia regions, respectively, compared with a range of $0.23 (South Asia)—$1.50 (Eastern Europe/Central Asia) for a single diagnostic test. Pooled procurement lowered costs for condoms but not the other commodities.
Conclusions
We showed how global procurement costs vary by region and time. Such analyses should be done more often to identify and correct market insufficiencies.
Keywords: commodity market, procurement, global Fund
Introduction
Gains have been made in the fight against HIV/AIDS, with the number of people dying from HIV-related ailments falling from 2.9 million in 2005 to 1.9 million in 2011.1 The successes reflect combined efforts of governments, nongovernment organizations and the private sector, and increased financing from initiatives like the Global Fund to Fight AIDS, TB and Malaria (the Global Fund), the President’s Emergency Program for AIDS Relief, and the World Bank Multi-country HIV/AIDS Program. The efforts have led to the scale-up of prevention and diagnosis programs and expansion of antiretroviral (ARV) treatment.
The Global Fund has played a major role in financing HIV programs. Of $23 billion in grants given since 2002, more than half has gone toward HIV programs.2 The money has contributed to the treatment of more than 4.2 million HIV patients, accounting for more than 20% of international funding for HIV.2
Nearly 40% of Global Fund grants goes toward procurement of pharmaceuticals and other health products, making it a major player in the market for commodities.2,3 In 2010, for instance, Global Fund supported programs supplied ARVs to nearly half of all HIV patients in recipient countries.2 To make the most use of its position in the commodities market, the Global Fund introduced the price and quality reporting (PQR) system in 20054–6 and the Voluntary Pooled Procurement (VPP) system4 in 2009.
The PQR collects data for condoms, antiretroviral (ARV) medications, and HIV test kits and malaria and tuberculosis commodities. The Global Fund prepares periodic reports showing countries how their procurement costs compare with those of other countries in their regions. This is meant to encourage countries to seek cheaper suppliers and/or negotiate better terms with existing ones.
The VPP leverages the Global Fund’s bulk purchasing power to negotiate lower prices for willing countries, whereas the PQR is a web-based system into which grant recipients enter procurement data each time a consignment is delivered. Both the VPP and PQR are designed to, among other things, lower procurement costs and increase commodity security.6
Large amounts of data have been collected through the PQR. However, no analyses have been published that describe regional and temporal variations. Past analyses using other data have focused on comparing prices paid by consumers in different countries (eg, World Health Organization and Health Action International reports7,8) as opposed to global level temporal comparisons.
This article describes, for the first time, the trends in procurement cost for selected HIV commodities using information collected through the PQR from 2005 to 2012.
Methodology
Two data sets were obtained from the Global Fund; 1 containing PQR procurement information reported by grant recipients and the other having procurement data reported by VPP agents. The 2 were merged with data on geographical location of grant recipients.
The Global Fund provides grants across 8 regions: East Asia and the Pacific, Eastern Europe and Central Asia (EECA), Latin America and the Caribbean, Middle East and North Africa (MENA), South Asia, sub-Saharan Africa-East Africa, sub-Saharan Africa, and sub-Saharan Africa-West and central Africa.
We selected 3 commodities representing HIV prevention, diagnosis, and treatment. These were male condoms, HIV rapid test kits, and the ARV combination of 150 mg of lamivudine (3TC)/2000 mg of nevirapine (NVP)/300 mg of zidovudine (AZT). The 3TC/NVP/AZT combination was the most widely procured fixed-dose combination (FDC), hence its inclusion in the analysis.
Initial inspection revealed some data outliers. We therefore reported medians and interquartile ranges (IQRs), which tend to be less sensitive to outliers than means. Unit costs were calculated in the smallest units, which were the costs of a single condom, a single diagnostic device, and a single FDC for the ARV (combined cost of the 3 tablets). Brand information was unavailable for the test kits, making it impossible to infer whether costs were for kits with the same exact specifications. Caution should be exercised when interpreting this set of results.
Scatter plots of unit costs were plotted against time (2005–2012) and a line of best fit used to illustrate the trend. Extreme values adjudged to result from data entry errors were omitted, most being values that deviated substantially from what would be a realistic price range. These were very few though, accounting for less than 1% of the data. Inclusion of extreme outliers would have distorted the regression lines.
Regional median costs and IQRs were also calculated and presented in Table 1.
Table 1. Median Costs and IQRs for Commodities by Region (2005–2012).
| Median Costs (IQRs) and (No. Purchases) for the 2005–2012 Period in US Dollars |
|||
|---|---|---|---|
| Global Fund Region | Condoms (Cost per Condom) | HIV Tests (Cost per Test) | 3TC/NVP/AZT (Cost per Combination) |
| East Asia/Pacific | 0.03 (0.02–0.04) (89)* | 1.3 (0.80–1.6) (129) | 0.18 (0.13–0.19) (47) |
| Eastern Europe/Central Asia | 0.07 (0.05–0.15) (146) | 1.5 (0.86–3.5) (143) | 0.23 (0.19–0.25) (6) |
| Latin America/Caribbean | 0.04 (0.03–0.06) (89) | 1.3 (0.95–1.8) (147) | 0.19 (0.18–0.22) (42) |
| North Africa/Middle East | 0.02 (0.02–0.03) (20) | 0.94 (0.80–1.8) (140) | 0.19 (0.15–0.22) (64) |
| South Asia | 0.02 (0.02–0.03) (121) | 0.23 (0.22–0.80) (125) | 0.15 (0.15–0.19) (81) |
| SSA: East Africa | 0.03 (0.03–0.03) (52) | 1.3 (0.90–1.9) (115) | 0.20 (0.16–0.23) (108) |
| SSA: Southern Africa | 0.04 (0.03–0.05) (27) | 0.84 (0.76–1.0) (92) | 0.22 (0.19–0.27) (82) |
| SSA: West and Central Africa | 0.02 (0.01–0.04) (51) | 1.4 (0.83–2.3) (194) | 0.19 (0.16–0.23) (145) |
Results format is medians, IQRs (first parentheses), and number of purchases reported (second parentheses). Medians and IQRs were aggregated over the entire period (2005–2012).
Finally, we compared the PQR and VPP costs to assess the effect of pooled procurement on the costs for the 3 commodities. The PQR and VPP Regression lines were superimposed on the same axes, visually inspected, and differences are discussed.
All costs were adjusted for inflation using World Bank–provided gross domestic product deflators and reported in US dollars. US dollar is the currency mainly used for procurement at the international level. Analyses were conducted using STATA version 12 (Stata Corp, College Station, TX).
Findings
For male condoms, HIV test kits, and the 3TC/NVP/AZT ARV combination, there were 613, 1148, and 576 entries, respectively. These procurements were reported from 578 grants in 125 countries spread across all 8 Global Fund regions.
Procurement Cost Trends Over the Period of Analysis (2005–2012)
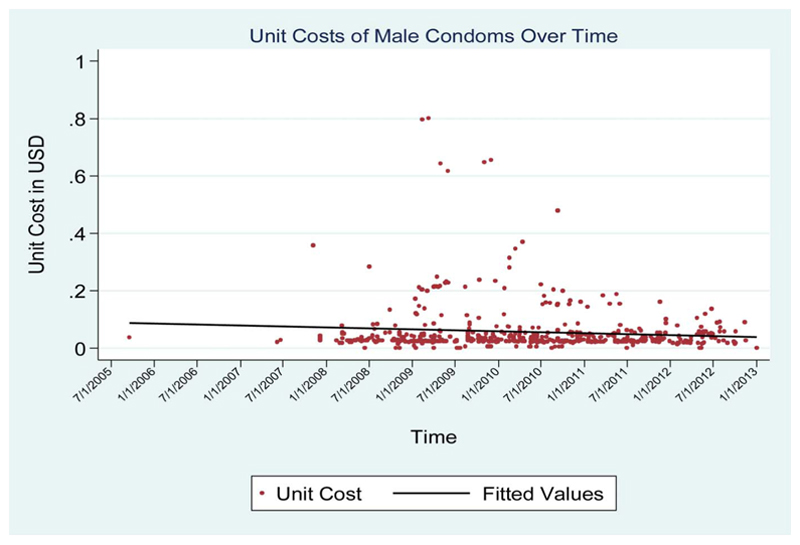
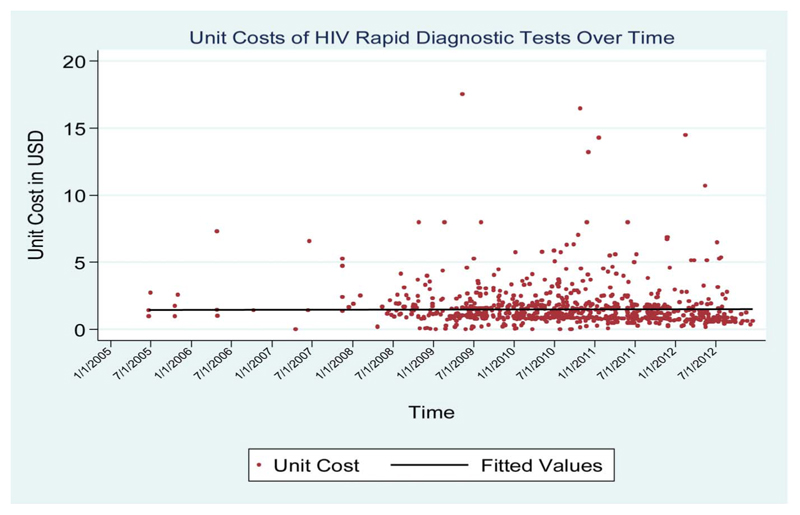
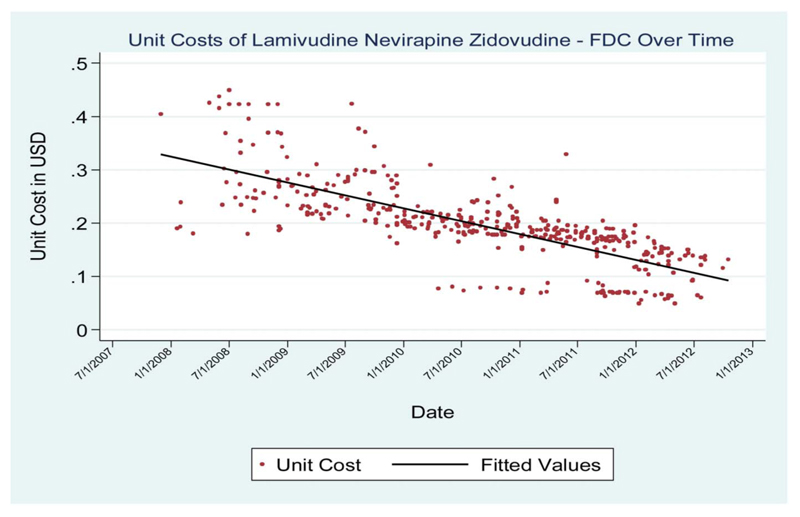
The cost trends had varied patterns across different commodities. Although procurement costs for condoms and HIV testing devices were relatively stable over the period of analysis (Figs. 1, 2), those for the ARV combination fell substantially over the period of analysis (Fig. 3).
Figure 1. Unit cost of male condoms over time.
Figure 2. Unit costs of HIV diagnostic tests over time.
Figure 3. Unit costs of the 3TC/NVP/AZT ARV over time.
Comparing Cost Trends for VPP and Non-VPP Procurement
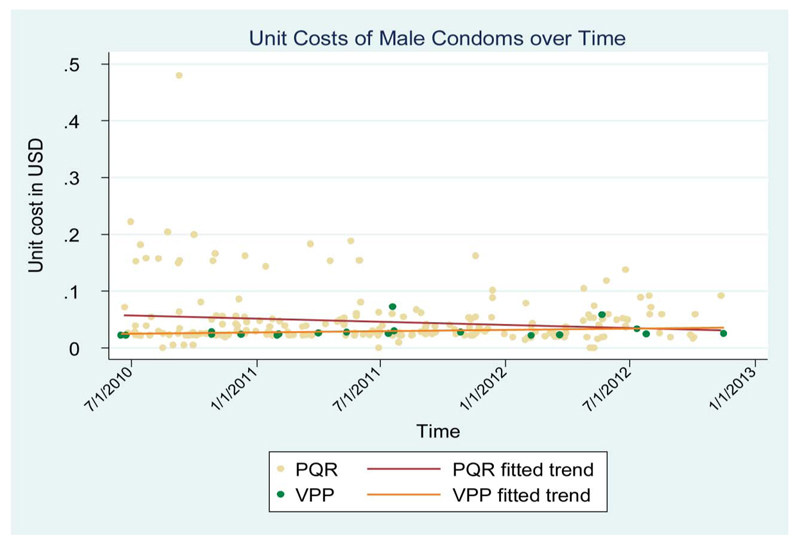
Procurement through the VPP system appeared to have visibly reduced the cost of purchasing condoms (Fig. 4). However, there appeared to be no visible difference for the procurement of the HIV test devices (see Figure S1, Supplemental Digital Content, http://links.lww.com/QAI/A483), with the latter graph showing a similar reduction in procurement costs through suggesting that both the VPP and the non-VPP procurements led to a similar decline in cost over time, with the VPP line having a marginally steeper slope.
Figure 4. Comparing costs of direct and VPP procurement of condoms.
Findings were mixed for the ARVs, with the VPP having higher benefits before 2011, but less benefit after 2011 (see Figure S2, Supplemental Digital Content, http://links.lww.com/QAI/A483).
Median Procurement Costs by Global Fund Region
The median cost of condoms was lowest in sub-Saharan Africa-West and central Africa, South Asia, and MENA regions, at US$0.02 (IQR: 0.01–0.04) (Table 1). The EECA region had the highest median cost (US$0.07, IQR: 0.05–0.15).
For the diagnostic devices, considerable differences were reported across regions. The EECA region, for instance, reported median costs of US$1.5 per test (IQR: 0.86–3.5), whereas the sub-Saharan Africa region and the MENA region recorded median per test costs of US$0.84 and 0.94, respectively. The median cost ranged between US$1.3 and 1.5 for most of the regions.
The median cost for the 3TC/NVP/AZT ARV FDC varied between US$0.15 (IQR: 0.15–0.18) in South Asia and US$0.23 (IQR: 0.19–0.25) in the EECA region.
Discussion
Economic theory dictates that all things remaining constant, prices fall as more suppliers enter a market, and as newer, more sophisticated commodities are introduced. However, markets for health care carry a high risk of failure due to information asymmetry.9,10 This may reduce competition, leading to inadequate supply and inflated prices. For this reason, prices for health care commodities must be monitored conscientiously, and interventions sought where inadequacies are detected. This analysis adds to knowledge of the global health care market by describing the costs for HIV commodities across regions and over time.
Substantial cost variations were observed for the ARV FDC over the period of analysis, whereas the costs were relatively stable for condoms and HIV tests. A variety of factors may explain these variations in trends.
The reduction in the cost for ARVs was likely to have resulted partly from increased competition among suppliers. Strong competition has been well documented in the market for ARVs, with studies showing the presence of many generic manufacturers (manufacturers of nonbranded medicines not covered by patent), mostly from the Asian region. In 2010, a study showed that more than 80% of donor-funded ARVs were purchased from Indian manufacturers of generics.11 Generic manufacturers supply more than 95% of solid form ARVs across Global Fund grant recipients according to 1 report.12
Price negotiations have also contributed to the reduction. Several organizations have combined efforts to negotiate lower manufacturer prices and to encourage countries to purchase generic HIV medicines. These include President’s Emergency Program for AIDS Relief, the Clinton Health Access Initiative, and the Global Fund.13–15 Although prices for newer ARVs such as Tenofovir are high, declines have begun, with further reductions expected as more manufacturers enter the ARVs market.16,17
The fall in the global procurement costs has resulted in reduced overall annual treatment costs per patient. A median cost reduction of nearly a half has been reported by World Health Organization between 2005 and 2012.18 The annual treatment cost for the stavudine/3TC/NVP adult FDC also reduced from US$339 to 200 between 2007 and 2010.17
Although the cost-effectiveness of ARVs has been demonstrated in the past,19 further price reductions would result in even better use of Global Fund resources. However, fears have emerged over how sustainable the ARVs market would be, and how attractive it would be for new manufacturers, if the prices were to drop further.20
Unlike ARVs, HIV tests, and condoms showed minimal cost variation, suggesting that the markets had stabilized. The Global Fund has in the past recognized the difficulties around influencing prices for commodities whose markets have stabilized.21
HIV test kits vary in price. In 2008/2009, market price per test for Determine HIV ½ and Uni-Gold brands were US $1.2 and 1.5, respectively.22 Most countries recommend the use of more than 1 brand, for instance, it is common to see Uni-gold being used to confirm a result from the Determine test.23,24 Because of the brand price variations and lack of information on brand names, and because countries were likely to have procured more than 1 brand concurrently, we cannot be certain that the trends were for tests of the same exact specifications.
Regional cost variations were minimal across the majority of commodities. This probably reflects the fact that countries tend to procure commodities from a common market, for instance, most ARV purchases are from Asian manufacturers.11 This may also suggest good awareness among countries on prices for these commodities in the global market. The most striking exceptions were costs for the HIV tests. However, as explained earlier, the wider variations may have resulted from countries procuring test kits of different brands.
The final part of the analysis compared individual country procurement with the VPP system procurement costs. The analyses gave a mixed picture, with the benefits of the VPP showing clearly for condoms but not for diagnostic tests and ARVs. However, as the VPP was only introduced in 2009, this comparison could only be done across 2 years, making it difficult to use the few data points to gauge the extent to which the pooled system was beneficial.
The downward trend in the cost of condoms agrees with previous Global Fund analyses, which showed the VPP prices to be at par or slightly lower than PQR prices.6,25 On the other hand, no clear benefits were seen for test kits and the ARV combination. This may be because the markets are competitive, and countries have sufficient information to negotiate directly for lower prices.
Failure to show a reduction in cost does not imply that the VPP system had no other benefits. There may be less obvious benefits, including improved transparency and governance of procurement, improved payment terms and conditions for countries (including those buying lower volumes), better reliability in the availability of commodities, and concurrent provision of technical support on supply chain issues.6
We acknowledge some limitations in the analysis. The main one was the presence of some outliers we believe resulted from data entry errors. This is a problem that the Global Fund has recognized in the past.5 Although measures such as omitting extreme values and using medians would have minimized the outlier effect, we cannot rule out the possibility that data entry errors may have biased the results in 1 direction or the other. Another possible cause of bias was low data availability, especially before 2008. We could not explore whether transactions that were captured differed systematically from those that were not captured during the early years of the PQR. It is expected that more data will be captured as the PQR system improves over time.
The trends discussed here reflect a variety of market factors, including an overall change in production costs. However, the role of the Global Fund and other global health initiatives cannot be ignored because these have contributed massively to increased demand, lowered procurement costs, and stabilized markets. As more data become available, research should describe the variations in greater depth, including the effect of the type of procuring organization (whether government or nongovernment), order lead times, procurement volumes, and shipment or transport costs. The effect of using the VPP system should also be examined over longer periods of time.
Conclusions
We have demonstrated the value of using routine Global Fund data to assess regional and temporal variations in commodity prices. As technical and funding partners continue supporting the fight against HIV/AIDS, it is important that resources are used in the most efficient way. Analyses like the one done here can highlight market inadequacies and allow interventions that ensure better use of resources.
We observed a consistent decline in the costs for ARVs, suggesting an overall improvement in the market. The pattern suggests that further reductions may be achieved, although there is the risk of excessively low prices making the market unattractive and unsustainable.
On the other hand, costs for condoms and test kits were stable, suggesting maturity of the markets. This implies that to realize lower costs, alternative technologies and/or production processes have to be developed going forward.
Pooled procurement had a direct benefit for some, but not all commodities. However, the period of analysis was too short to infer whether this would be the case over a longer period of time. Additionally, there may be other less direct benefits of using pooled procurement that would not have been captured in the analysis.
Future analyses should describe the causes of variations in unit costs of commodities in greater depth and assess the relative effectiveness of different market-shaping interventions. The effectiveness of the VPP system should also be examined over a longer period of time and across other Global Fund–supported commodities.
Acknowledgments
The authors are grateful to Dr D. McCoy for advice during the initial stages of the study and D. Garmaise, S. Korde, and Drs C. Goodman and J. Yukich for useful comments on earlier drafts. The authors are also grateful to staff from the Global Fund, particularly M. Olszak-Olszewski, for responding to data queries in good time.
Aidspan is funded by the UK Department for International Development, the Ford Foundation, GIZ Backup Initiative, Norad and Hivos.
Footnotes
The authors have no conflicts of interest to disclose.
Supplemental digital content is available for this article. Direct URL citations appear in the printed text and are provided in the HTML and PDF versions of this article on the journal’s Web site (www.jaids.com).
References
- 1.UNAIDS. Global Report: UNAIDS Report on Global AIDS Epidemic. Geneva, Switzerland: Joint United Nations Programme on HIV/AIDS (UNAIDS); 2012. [Google Scholar]
- 2.GFATM. Strategic Investments for Impact: Global Fund Results Report, 2012. Geneva, Switzerland: Global Fund to Fight AIDS, TB and Malaria; 2012. [Google Scholar]
- 3.GFATM. Procurement Support Services Website. Geneva, Switzerland: Global Fund to Fight AIDS, TB and Malaria; 2012. [Accessed December 2012]. Available at: http://www.theglobalfund.org/en/procurement/vpp/ [Google Scholar]
- 4.GFATM. Procurement Support Services Progress Report: Guidelines for Participation in the Voluntary Pooled Procurement Process. Geneva, Switzerland: Global Fund to Fight AIDS, TB and Malaria; 2012. [Google Scholar]
- 5.GFATM. Update on the Price and Quality Reporting (PQR) System. Geneva, Switzerland: Global Fund to Fight AIDS, TB and Malaria; 2010. [Google Scholar]
- 6.GFATM. Procurement Support Services Progress Report: June 2009—Dec 2010: Supporting Grant Implementation & Influencing Market Dynamics for HIV/AIDS and Malaria Products. Geneva, Switzerland: GFATM; 2011. [Google Scholar]
- 7.HAI. Retail Prices of ACTs Co-paid by the AMFm and Other Antimalarial Medicines. Ghana, Kenya, Nigeria, Tanzania and Uganda: Health Action International; 2011. [Google Scholar]
- 8.WHO & HAI. Measuring Medicine Prices, Availability, Affordability and Price Components. 2nd ed. Geneva, Switzerland: World Health Organization and Amsterdam, Health Action International; 2008. Available at: http://www.haiweb.org/medicineprices/manual/documents.html. [Google Scholar]
- 9.Blevins SA. The Medical Monopoly: Protecting Consumers or Limiting Competition? Washington DC: The Cato Institute; 1995. [Retrieved July 21, 2009]. Available at: http://www.cato.org/pub_display.php?pub_id=1105. [Google Scholar]
- 10.Folland S, Goodman A, Stano M. The Economics of Health and Health Care. 2nd ed. Parsippany, NJ: Simon & Schuster Company; 1997. [Google Scholar]
- 11.Waning B, Diedrichsen E, Moon S. A lifeline to treatment: the role of Indian generic manufacturers in supplying antiretroviral medicines to developing countries. J Int AIDS Soc. 2010;13:35. doi: 10.1186/1758-2652-13-35. [DOI] [PMC free article] [PubMed] [Google Scholar]
- 12.GFATM. 4th Market Dynamics and Commodities Ad-Hoc Committee Meeting Geneva, 4–5 April 2011. Geneva, Switzerland: GFATM; 2011. [Google Scholar]
- 13.GFATM. The Global Fund: Twenty-Fifth Board Meeting, Accra, Ghana, 21–22 Nov 2011: Report of the Market Dynamics and Commodities Ad-Hoc Committee. Accra, Ghana: GFATM; 2011. [Google Scholar]
- 14.Holmes CB, Coggin W, Jamieson D, et al. Use of generic antiretroviral agents and cost savings in PEPFAR treatment programs. JAMA. 2010;304:313–320. doi: 10.1001/jama.2010.993. [DOI] [PubMed] [Google Scholar]
- 15.Waning B, Kaplan W, King AC, et al. Global strategies to reduce the price of antiretroviral medicines: evidence from transactional databases. Bull World Health Organ. 2009;87:520–528. doi: 10.2471/BLT.08.058925. [DOI] [PMC free article] [PubMed] [Google Scholar]
- 16.Alcorn K. Further Cuts in Drug Prices Make Tenofovir More Affordable for Low-income Countries. London, United Kingdom: Aidsmap; 2011. [Accessed January 1, 2012]. Available at: http://www.aidsmap.com/Further-cuts-in-drug-prices-make-tenofovir-more-affordable-for-low-income-countries/page/1802323/ [Google Scholar]
- 17.UNITAID. HIV, Tuberculosis and Malaria Medicines Landscape: Progress Report on Emerging Issues and Potential Opportunities to Improve Access. Geneva, Switzerland: UNITAID Secretariat, World Health Organization; 2012. [Google Scholar]
- 18.WHO. Global Price Reporting Mechanism Website. World Health Organization; 2012. [Accessed December 2012]. Available at: aps.who.int/hiv/amds/price/hdd/ [Google Scholar]
- 19.Freedberg K, Losina E, Weinstein M, et al. The cost-effectiveness of combination antiretroviral therapy for HIV disease. N Engl J Med. 2001;344:824–831. doi: 10.1056/NEJM200103153441108. [DOI] [PubMed] [Google Scholar]
- 20.Nakakeeto ON, Elliott BV. Antiretrovirals for low income countries: an analysis of the commercial viability of a highly competitive market. Glob Health. 2013;9:6. doi: 10.1186/1744-8603-9-6. [DOI] [PMC free article] [PubMed] [Google Scholar]
- 21.GFATM. The Global Fund: Report of the Market Dynamics and Commodities Ad Hoc Committee (Twenty-First Board Meeting, Geneva, Switzerland, 28–30 April 2010) Geneva, Switzerland: GFATM; 2010. [Google Scholar]
- 22.Rational Pharmaceutical Management Plus. HIV test kits listed in the USAID source and origin waiver: procurement information document. In: Johnson A, editor. Submitted to the U.S. Agency for International Development by the Rational Pharmaceutical Management Plus Program. 5th ed. Arlington, VA: Management Sciences for Health; 2009. [Google Scholar]
- 23.NAC. Zambia National Guidelines for HIV Counseling & Testing of Children. Lusaka, Zambia: National AIDS Council, Ministry of Health; 2011. [Google Scholar]
- 24.NASCOP. National Guidelines for HIV Testing and Counseling in Kenya. 2nd ed. Nairobi, Kenya: National AIDS and STI Control Programme (NASCOP), Ministry of Public Health and Sanitation; 2010. [Google Scholar]
- 25.GFATM. Voluntary Vooped Procurement Key Results (2009-2011) Geneva, Switzerland: GFATM; 2012. [Google Scholar]


