

ABSTRACT
Background
Obese individuals are known to be at higher risk for vitamin D deficiency than normal-weight individuals. Cutaneous synthesis is a major source of vitamin D; however, objective measurements of sun exposure are lacking in this population.
Objective
To assess the validity of a regression model using sun exposure in lean individuals to estimate serum 25-hydroxyvitamin D [25(OH)D] in overweight and obese individuals, and to develop a prediction equation for serum 25(OH)D in overweight and obese adults.
Methods
This study was a secondary analysis of a 15-wk controlled feeding study investigating the effects of dairy consumption on body composition. Information regarding sun exposure, including day, hour, time outside, and clothing, were self-assessed in sun exposure diaries. Personal sun exposure energy (joules) was assessed by downloading time-specific ultraviolet B energy data from climate stations. Skin reflectance was measured using a Minolta 2500d spectrophotometer. Dietary intake of vitamin D was known. Serum 25(OH)D concentration was measured by radioimmunoassay. Body composition was determined from whole-body dual energy x-ray absorptiometry and computed tomography scans.
Results
Sun exposure was positively related to serum 25(OH)D (r = 0.26; P ≤ 0.05) and inversely related to total fat mass, android fat, and BMI (r = −0.25, −0.30, and −0.32, respectively). The modified Hall model significantly overestimated serum 25(OH)D in overweight and obese adults by 27.33–80.98 nmol/L, depending on the sun exposure calculation. A new regression model was developed for overweight and obese persons that explained 29.1% of the variance in postintervention 25(OH)D concentrations and included sun exposure, skin reflectance, total fat mass, total lean mass, and intra-abdominal adipose tissue as predictors.
Conclusion
Major determinants of serum 25(OH)D concentration in healthy overweight and obese individuals include sun exposure, skin reflectance, and adiposity. Addition of adiposity terms to the prior model significantly improved predictive ability in overweight and obese men and women. (clinicaltrials.gov: NCT00858312)
Keywords: sun exposure, skin reflectance, body composition, vitamin D, obesity
Introduction
Overweight and obesity significantly increases the risk for all-cause mortality (1) and recent worldwide estimates suggest >600 million people are afflicted by obesity alone (2). Several reports have described an inverse relationship between indices of obesity/adiposity and circulating concentrations of 25-hydroxyvitamin D [25(OH)D] (3–7), providing evidence that overweight and obese individuals are at a greater risk than lean individuals for vitamin D insufficiency. As the noncalcitropic properties of vitamin D have been suggested to influence inflammation,hypertension, insulin resistance, and dyslipidemia (8), the clinical burden of lower serum 25(OH)D concentrations in overweight and obese individuals may be significant.
The larger volume of adiposity in obesity has been suggested to reduce the bioavailability of the parent vitamin D compounds (cholecalciferol and ergocalciferol), via sequestration (9) or volumetric dilution (10). Still, these hypotheses are dependent on total vitamin D intake from both dermal production and dietary sources. While dietary intake of vitamin D is recommended (11), cutaneous synthesis of vitamin D through ultraviolet B (UVB) exposure, mainly derived from sunlight, is believed to be the major source of vitamin D for several of the following reasons: 1) there are very few nonfortified food sources of vitamin D, 2) the epidermis rapidly produces cholecalciferol when exposed to UVB energy (12), and 3) diurnal patterns of circulating 25(OH)D concentrations are consistently observed during seasonal periods of high terrestrial UVB penetration (13–15). However, sun exposure is rarely measured due to an inability to accurately measure or control factors affecting dermal production of cholecalciferol, e.g., skin pigmentation, genetics, latitude, use of sunscreen, cultural differences in dress, etc. (11). Furthermore, sun exposure habits of overweight and obese populations have not been fully characterized.
Quantification of personal UVB exposure with polysulphone dosimeter badges has been applied to several recent studies investigating the contribution of sun exposure to circulating 25(OH)D concentrations (16–21); however, these studies are mainly generalizable over a broad sampling of the local population and none have specifically targeted overweight and obese individuals. Furthermore, personal polysulphone dosimeters are not widely available for clinical practitioners, can become costly for large scale implementation, and do not take into account factors such as skin pigmentation, clothing, outdoor activity, and sun screen use that modulate cutaneous synthesis of vitamin D. Thus, sun exposure diaries have been used in conjunction with the polysulphone dosimeters to provide important information related to vitamin D synthesis (17–19, 22). A prior model developed by Hall et al. combined data from polysulphone dosimeter badges and exposure diaries in mostly normal-weight and college-aged (19–39 y) adults to estimate an individual sun exposure energy dose in joules (17). The Hall model used a linear regression model including sun exposure dose, skin pigmentation, and vitamin D intake to estimate the additional vitamin D intake needed to meet serum 25(OH)D recommended concentrations. To our knowledge, the Hall model to predict serum 25(OH)D concentration has not been validated in a second population or in overweight and obese individuals. To test the utility of the model, we applied the regression equation to overweight and obese adults enrolled in a controlled feeding study (23). The objectives of these analyses were to assess the validity of the Hall model in overweight and obese individuals consuming a known vitamin D content for a period of 12 wk and to develop a new model, if necessary, for overweight and obese individuals.
Subjects and Methods
Study design
The current study was a secondary analysis of a clinical trial investigating the inclusion of dairy foods in an energy-restricted diet; details of the parent project have been previously published (23). Healthy women, age 20–45 y, and men, age 20–50 y, were enrolled in a 15-wk controlled feeding study in which all foods were provided or prepared by the Metabolic Food Laboratory at the Western Human Nutrition Research Center (WHNRC). The 15-wk study was divided into a 3-wk “run-in” period and a 12-wk energy reduction period (−500 kcal/d). Baseline measurements were measured at the conclusion of the run-in period and are referred to as week 3 measurements throughout the text. Postintervention measurements were conducted at the end of the 12-wk diet intervention period (overall study weeks 4–15) and referred to as week 15 measurements. More specific details regarding the dietary aspects of the study can be found in the published report (23). All protocols were approved by the University of California, Davis, Institutional Review Board, and all subjects provided written consent. This study was registered with ClinicalTrials.Gov (NCT00858312).
Subject screening and selection
Overweight and obese adult women and men were recruited from the greater Davis and Sacramento communities. The lower age limit for women was used to avoid hormonal changes associated with the perimenopausal period that might affect study outcomes. The BMI for all parcipants was between 28 and 37 kg/m2. All participants were habitually low-dairy consumers, defined as ≤1 serving of dairy/d, and had a total calcium intake ≤600 mg/d from all sources, including dairy products. Exclusion from the study was based on not meeting the age and dairy-serving criteria as well as an extensive list of endocrine and other medically related parameters. Of importance to this study, exclusion criteria included presence of active gastrointestinal disorders such as malabsorption syndromes, pregnancy or lactation, use of calcium supplements in the past 12 wk, and initiation of hormonal birth control or change in hormonal birth control regimen. A comprehensive list of all exclusion criteria can be found elsewhere (23).
Subject randomization and treatment
Body composition was assessed during the run-in period; subjects were pair-matched based on percentage body fat and then randomly assigned to treatment group as follows: low dairy (≤1 serving/d) or adequate dairy (3–4 servings/d). Enrollment was continuous, with a new cohort starting approximately every 8 wk; volunteers were enrolled throughout the year. Since year-round enrollment would impact participant vitamin D status, participants were coded for the season in which they were enrolled into the study. Sample size per season is as follows: fall = 8, winter = 15, spring = 17, and summer = 23. Each cohort had a similar distribution of adequate and low dairy-consuming participants, so no treatments were weighted toward a particular season. Participant flowchart, including the final participant count used in this study, is provided as Figure 1. Participants self-identified their ethnic background as follows: Caucasian (57%), Hispanic (27%), African (8%), Asian (3%), Pacific Islander (2%), Native American (2%), and Other (2%). Monetary compensation was provided to participants who completed the intervention.
FIGURE 1.
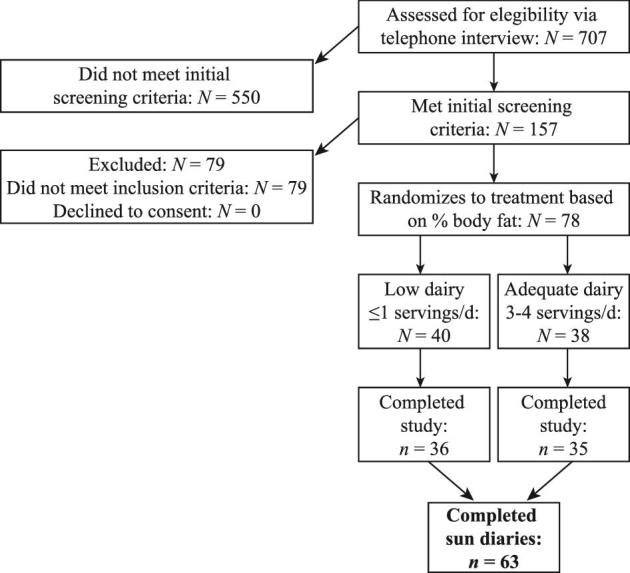
Consort diagram adapted from (23).
Food intake
Diets for the treatment arms provided comparable levels of macronutrients and fiber, and approximated the average composition of caloric consumption in the United States (fat ∼35% of total energy, carbohydrates ∼49%, protein ∼16%; fiber 8–10 g/1000 kcal). Diets were monitored as follows: during the 3-wk run-in phase, subjects were required to eat 2 of the 3 meals/d at the WHNRC dining room; the third meal and all weekend meals were packed to go. The pattern of eating 2 of the 3 meals/d at the WHNRC continued during the first 2 wk of the energy restriction period (weeks 4–5). For weeks 6–12, subjects were “free living,” but all food was weighed and provided by the Metabolic Food Laboratory staff for individual caloric needs. For the last 3 wk of the intervention (weeks 13–15), subjects returned to the WHNRC and once again ate 2 of 3 meals/d in the dining room. Based on a 2100-kcal menu, the adequate dairy diet included 3–4 servings of milk, yogurt, and cheese per day and the low diary diet had ≤1 serving of diary (e.g., milk, yogurt, or cheese) per day. Vitamin D content of the diet was determined by the Nutrition Data System for Research software (NDSR software version 2011) and expressed as daily intake in international units (IU). In the United States, fluid milk is routinely fortified with vitamin D (24) and other dairy products (e.g., yogurt, cheeses) are selectively fortified (25). Thus, the adequate-dairy group (320 ± 104 IU/d) had a significantly greater intake of vitamin D than the low-dairy group (128 ± 140 IU/d), as previously described (23). Dietary intake of nutritional supplements were not permitted. Use of tanning beds was not specifically prohibited by the study protocol; however, participants were discouraged from using tanning beds and instructed to report any use. No participants reported tanning bed use during the study duration.
Body composition measurements
Weight was measured on an electronic scale (Scaletronic model 6002) to the nearest 0.1 kg with subjects in light clothing, all jewelry removed, pockets emptied, and shoes removed. Height was measured using a wall-mounted stadiometer (Ayrton Stadiometer model S100) and recorded to the nearest 0.1 cm. BMI was calculated as kg/m2. Waist circumference was recorded to the nearest 0.1 cm and was determined in the standing position as the smallest horizontal circumference midway between the lower rib and the iliac crest at the end of a normal exhalation. The average of 2 readings was recorded for weight, height, and waist circumference. Lean and fat masses were assessed in overnight-fasted participants using a dual energy x-ray absorptiometry (DXA; GE Lunar, Prodigy Model) on weeks 3 and 15. Daily calibration procedures were carried out per manufacturer instructions. To reduce the variance in the measurement data, all DXA scans were analyzed by a single operator.
Intra-abdominal adipose tissue measurements
Intra-abdominal adipose tissue (IAAT) was measured using computed tomography transabdominal slices (Siemens Somaton 16 Scanner). Measurements were made at the level of the L4–L5 intervertebral space (26). Scan slices were 0.5 cm, with the subject in a supine position and arms stretched above the head. Measurements were made with no angulation and using a lateral pilot scout scan to determine proper location. Adipose tissue area was assessed using an attenuation range from −190 to −30 Hounsfield units. The IAAT measured included the adipose tissue contained in a measurement boundary formed by the most internal aspect of the abdominal and oblique muscle walls and the posterior aspect of the vertebral body. The IAAT measurements by computed tomography were made at weeks 3 and 15. All measurements were made following a 12-h overnight fast.
Serum vitamin D
Blood from overnight-fasted participants was drawn from the antecubital vein on weeks 3 and 15, and serum plasma samples were stored at −80°C until analyzed. Serum vitamin 25(OH)D was analyzed using standard RIA procedures (DiaSorin, Stillwater). Samples were processed in accordance with manufacturer's instructions: 25(OH)D was assayed using an equilibrium RIA procedure based on antibody with specificity for 25(OH)D. The sample, antibody, and tracer were incubated for 90 min at 20–25°C. Phase separation was accomplished after 20 min incubation at 20–25° with a second antibody precipitating complex. A nonspecific binder addition buffer was added after this incubation prior to centrifugation to aid in reducing the nonspecific binding. The WHNRC participates in the Vitamin D External Quality Assessment Scheme, and calibration standards of 25(OH)D from this program were analyzed in conjunction with participant samples. Mean intra-assay CV was 5.81%, while mean interassay CV was 5.99%.
Sun exposure diaries
Sun exposure diaries were utilized as previously described (17) (Figure 2). Each participant completed sun exposure diaries on 2 random days per week during the 12-wk intervention period. Recorded days were chosen randomly so that days of the week were equally distributed throughout the 12-wk intervention. Participants were given extra sun exposure diaries and instructed to record high–sun exposure time periods that were outside the required days. Binders were given to each participant containing a brief description of the study, information regarding vitamin D and sun exposure, a calendar with the recording days highlighted, an instructional page for the sun diaries, a clothing key for each body region, sun exposure diaries for each required day, and extra sun diaries. The sun exposure diaries contained key information to determine total UVB energy exposure and the percentage body surface area (BSA) exposed (BSAE), as shown in Figure 2A. Participants were instructed to only record their personal exposure during the hour in which they were exposed to sunlight for more than 5 min. Participants were instructed to note the location of the exposure in the second column as a city or specific geographical location (lake, mountain). Outdoor activity was recorded in the third column and participants were instructed to record simple activities (walking, sitting, biking, gardening, etc.). Participants were instructed to record their time outdoors as direct sun unless they were knowingly under a shaded area. On days with significant cloud cover, participants were instructed to record as if in direct sun unless specifically in a shaded area (i.e., outdoor tent, awning). Columns under the subheader “Body parts exposed to the sun” determined the % BSA of skin exposed to the sun which coincided with the body regions represented in the clothing key in Figure 2B. Participants recorded their clothing by marking the numerical option for each body region that corresponded to the amount of clothing worn during sun exposure. For example, a participant wearing no hat, a t-shirt, jeans, and tennis shoes would record the following: A-1, B-4, C-4, D-3. Participants were instructed to record their sunscreen use similarly to the recording of their clothing (i.e., sunscreen application on arms while wearing a t-shirt would be designated as a B-4), but only mark the hour of sunscreen application. Thus, if sunscreen was applied between 0800 and 0859, then the participant would mark that time regardless of whether they were exposed to the sun or not. Completed diaries were requested weekly during required WHNRC dining visits (e.g., weeks 4–5 and 13–15) and biweekly when subjects collected their packed-to-go meal. Diaries were reviewed for accuracy and completeness and, if necessary, participants were interviewed at their next available in-house meal/pick up to clarify details.
FIGURE 2.

Sun exposure diary (A) and clothing key (B) used in the current study.
Assessment of sun exposure dose
The erythemally weighted UVB measurements from the USDA UVB Monitoring and Research Program (UVMRP) website (27) were downloaded for each hour that participants recorded sun exposure. The UVMRP supports the UVB Monitoring Network, which comprises 37 domestic and international stations monitoring solar UV irradiance. For our purposes, we used measurements derived from the UVB-1 Pyranometer (Yankee Environmental Systems) that measures global irradiance in the UVB spectral range of 300–400 nm, which is weighted with the McKinlay and Diffey action spectrum (28). Since the erythema action spectrum and vitamin D action spectrum overlap, these energy measurements are a good estimate of UV energy required to initiate cutaneous vitamin D synthesis. Furthermore, erythemally weighted irradiance (including both UVA and UVB spectrum) has been noted as a practical estimation for vitamin D synthesis (29). The UVB-1 pyranometer measures UVB radiation as watts per square meter every 15 min and then reports 3-min averages. UVB data were downloaded in 1-h blocks corresponding to the hour time period in the sun exposure diaries. Downloaded data were averaged to determine a mean hourly UVB measurement for each hour of sun exposure. Most UVB measurements were collected from the University of California, Davis, Climate Station (38.5°N, 121.7°W; elevation 49 feet); however, measurements outside the northern California region were matched with regional climate stations and data were downloaded from the corresponding sites for specified sun exposure hours. The UVB measurements were then converted from W/m2 to J/m2. Each personal hourly UVB measurement was adjusted for percentage BSA exposed based on the daily clothing records. BSA (m2) was calculated using the Mosteller formula and percentage BSA. This resulted in an individual UVB dose expressed in joules for each time period recorded in the sun exposure diaries.
Skin reflectance assessment
Skin reflectance was assessed using a Minolta 2500d spectrophotometer (Konica Minolta Sensing). Measurements were taken at the beginning and end of the study at the following 3 sites; the dorsum of the right hand between the thumb and index finger, the middle upper inner right arm, and the middle of the forehead. Participants were seated and female subjects were asked to remove cosmetic products from their forehead if necessary. Each site was measured 3 times and the mean of each measurement was calculated. Measurements were expressed using the skin reflectance (L*) value of the Commission International d'Eclairage system. The L* value ranges from 0 to 100, with 0 indicating no reflected light (pure black) and a value of 100 indicating 100% reflectance or pure white.
Multiple linear regression model predicting serum 25(OH)D
The Hall model to predict serum 25(OH)D included sun exposure badge (J), dietary vitamin D intake (IU), skin reflectance (L*), and a dummy variable for season, coded as winter = 1, spring = 2, or summer = 3 (17).
 |
Data from the current study were entered into the Hall equation to obtain a predicted serum 25(OH)D concentration [25(OH)DPRED]. As we deviated from the Hall model in respect to sun exposure (i.e., polysulphone dosimeters were used to assess UVB energy by Hall et al. (17), whereas we used ambient UVB measurements), we will refer to the Hall model as “*Hall model” to indicate that we are testing a modified version of their linear regression. While we recognize that serum 25(OH)D concentrations are a function of the synthesis and metabolism of 25(OH)D, we assumed for this study that postintervention serum 25(OH)D concentrations were reflective of total sun exposure over the intervention period. Thus, we tested the *Hall model using total cumulative joules for all exposures over 12 wk (i.e., sum of all exposures). Since recorded days varied between subjects (range: 20–43, mean: 25.6), we also tested the *Hall model based on adjusting the cumulative joules for the number of recorded days. Lastly, prior research has shown differing amounts of time outdoors during weekdays compared with weekend days (22); therefore, we also tested the *Hall model based on joules scaled for weekdays and weekends. The latter calculation is the sum of the total cumulative joules for both weekdays and weekends adjusted for their respective number of days with exposure.
Statistical methods
All statistical analyses were performed using R version 3.4.1 (30). Data were tested for normality and transformed as needed prior to statistical analysis. Paired t tests were used to determine differences between weeks 3 and 15. A t test for bias was used to evaluate the difference between measured serum [25(OH)DACTUAL] and 25(OH)DPRED. Pearson correlation was used to compare associations among variables. Analysis of variance was used to compare differences by season. Multiple linear regression analyses were used to explore the contributions of sun exposure, dietary vitamin D intake, skin reflectance, and body composition variables (body weight, fat mass, percentage body fat, lean mass, android fat mass, gynoid fat mass, IAAT, BMI, and waist circumference) to 25(OH)DACTUAL. The Akaike Information Criterion was used to estimate the quality of linear regressions in the backwards stepwise regression procedure. Multicollinearity among parameters in linear regression models was assessed by calculating variable inflation factor. Parameters were removed if the variable inflation factor was > 2. P values ≤ 0.05 were considered statistically significant.
Results
Participant characteristics
Physical characteristics of the subjects at week 3 are shown in Table 1. The majority of participants were women and all were categorized as either overweight or obese according to BMI. Mean 25(OH)D concentrations were well below the recommended level, >50 nmol/L. Eighty-five percent of participants (54/63) had 25(OH)D concentrations below 50 nmol/L, whereas 32% (20/63) had concentrations below deficient levels, <25 nmol/L. Vitamin D intake at week 3 was below the current recommendation, 600 IU/d; however, the study was conducted and completed with the previous recommendation of 200 IU/d.
TABLE 1.
Physical characteristics at week 3 and week 151
| Parameter | Week 3 | Week 15 | P |
|---|---|---|---|
| Sex, F/M | 46/17 | ||
| Age, yrs | 32.7 ± 9.4 | ||
| Height, cm | 167.5 ± 8.9 | ||
| Weight, kg | 91.0 ± 10.5 | 85.0 ± 10.6 | <0.01 |
| Total fat mass, kg | 38.4 ± 7.5 | 33.2 ± 8.5 | <0.01 |
| Body fat, % | 43.2 ± 6.7 | 40.1 ± 8.2 | <0.05 |
| Total lean mass, kg | 48.2 ± 9.0 | 47.4 ± 9.3 | 0.63 |
| Intra-abdominal adipose tissue,2 cc | 38.5 ± 16.6 | 29.6 ± 12.8 | <0.01 |
| Waist circumference,3 cm | 94.3 ± 7.8 | 89.7 ± 7.5 | <0.01 |
| Gynoid fat, kg | 7.1 ± 1.6 | 6.2 ± 1.6 | <0.01 |
| Android fat, kg | 3.8 ± 0.9 | 3.2 ± 0.9 | <0.01 |
| BMI, kg/m2 | 32.4 ± 2.6 | 30.3 ± 2.6 | <0.01 |
| 25(OH)D, nmol/L | 34.8 ± 15.6 | 39.4 ± 14.2 | 0.08 |
| Skin reflectance,4 L* | 59.8 ± 6.2 | 59.2 ± 6.4 | 0.59 |
| Vitamin D intake, IU/d | 189.9 ± 21.7 | 233.2 ± 96.5 | <0.01 |
| Total sun exposure,5 J | 5082.3 ± 4901.9 | ||
| Average recorded daily sun exposure,6 J | 358.6 ± 357.7 | ||
| Scaled total sun exposure,7 J | 765.4 ± 744.5 | ||
| Average time outside,8 min | 20.2 ± 10.5 | ||
| Skin area exposed, % | 21.5 ± 8.4 |
Values are means ± SDs unless noted. n = 63 unless noted. P-value derived from Student's t-test, P < 0.05). 25(OH)D, 25-hydroxyvitamin D.
n = 60, week 3; n = 61, week 15.
n = 62, week 3; n = 59, week 15.
Average between forehead and hand skin reflectance.
Cumulative joules over 12-wk study period.
Cumulative joules/number of days with recorded exposure.
Weekday and weekend scaled sun exposure. Sum of the cumulative weekday and weekend joules adjusted for number of recorded days.
Average of the time in direct sun per participant.
Week 15 outcomes were used for model validation and model development as shown in Table 1. All body composition markers except total lean mass were reduced after the intervention. Serum 25(OH)D levels rose slightly but were not statistically significant (P = 0.089). There was no change in skin pigmentation (P = 0.595), but there was a significant change in vitamin D intake (P < 0.01) due to the increased dairy intake as part of the intervention protocol of the parent study. As these data were derived from an intervention utilizing dairy foods, the difference in vitamin D intake is likely driven by half of the cohort consuming greater servings of food products fortified with vitamin D. By week 15, 83% (52/64) of participants still had serum 25(OH)D concentrations <50 nmol/L, and only 14% (9/63) had concentrations <25 nmol/L.
BMI significantly correlates to total sun exposure in overweight and obese adults
Total sun exposure varied widely across subjects regardless of the calculation method (Table 1). There was a highly significant (P < 0.0001) relationship between sun exposure and the sun exposure index (SEI), (body surface area exposed × time outside) and between sun exposure and serum 25(OH)D (P = 0.040) (Table 2). Total fat mass, android fat, and BMI had a significant (P = 0.019) and negative correlation with total sun exposure. All other markers of adiposity, although not significant, also showed an inverse association with sun exposure. Although SEI was not quite statistically significantly associated with serum 25(OH)D concentrations (P = 0.061), percentage BSAE was strongly associated with serum 25(OH)D concentrations (Table 2). Several body composition markers, including percentage body fat, total fat mass, gynoid fat, android fat, intra-abdominal adipose tissue, and BMI, and waist circumference were negatively correlated with either SEI, average time outside, or percentage BSAE, whereas serum 25(OH)D was negatively correlated only with intra-abdominal adipose tissue and waist circumference (Table 2).
TABLE 2.
Pearson correlation coefficients relating total sun exposure to outcome multiple variables1
| Parameters | Sun exposure2 | SEI3 | Avg time outside4 | Skin area exposed | Serum 25(OH)D |
|---|---|---|---|---|---|
| SEI3 | 0.94** | ||||
| Average time outside,4 min | 0.48** | 0.62** | |||
| Skin area exposed, % | 0.46** | 0.42** | 0.22 | ||
| 25(OH)D, nmol/L | 0.26* | 0.24 | 0.19 | 0.39** | |
| Skin reflectance, L* | −0.16 | −0.20 | −0.12 | −0.15 | 0.25* |
| Dietary vitamin D intake, IU | −0.15 | −0.15 | −0.17 | −0.10 | −0.14 |
| Percentage body fat | −0.23 | −0.37** | −0.32* | −0.29* | −0.11 |
| Fat mass, kg | −0.28* | −0.38** | −0.28* | −0.30* | −0.08 |
| Lean mass, kg | 0.02 | 0.13 | 0.21 | −0.14 | 0.12 |
| Gynoid fat, kg | −0.22 | −0.33* | −0.20 | −0.19 | 0.11 |
| Android fat, kg | −0.28* | −0.36** | −0.22 | −0.30* | −0.16 |
| Intra-abdominal adipose tissue,5 cc | −0.15 | −0.07 | 0.11 | −0.40** | −0.31* |
| Weight, kg | −0.21 | −0.20 | −0.02 | −0.11 | 0.07 |
| BMI, kg/m2 | −0.32* | −0.39** | −0.27* | −0.26* | −0.09 |
| Waist circumference,6 cm | −0.19 | −0.18 | −0.10 | −0.16 | −0.26* |
Values are Pearson's correlation coefficients. *P value ≤ 0.05; **P value ≤ 0.01. n = 63 unless otherwise noted. 25(OH)D, 25-hydroxyvitamin D; Avg, average; IU, international units; SEI, sun exposure index;
Cumulative joules over 12-wk study period.
Time outside × body surface area.
Average of the time in direct sun per participant.
n = 61.
n = 59.
Based on the recorded diary entries, participants averaged 20.2 min in direct sun with an average percentage BSA of 21.5% (Table 1). Average time in direct sunlight and SEI did not statistically differ across seasons (Figure 3A and B), whereas percentage BSA was higher in spring and summer than in winter (Figure 3C). When accounting for sun exposure (i.e., UVB energy), participants enrolled during spring and summer months received greater cumulative sun exposure energy relative to participants enrolled during fall and winter (Figure 3D). When adjusting for the total observation days, cumulative sun exposure energy values for participants enrolled in summer months were still greater than those for participants enrolled in winter and fall, whereas the energy values for spring enrollees were only greater than those for winter enrollees (Figure 3E). Scaling sun exposure based on weekday and weekend exposure resulted in greater sun exposure in spring and summer relative to fall and winter (Figure 3F). No difference by season was observed for serum 25(OH)D concentrations, skin reflectance, and dietary vitamin D intake (Figure 4A–C).
FIGURE 3.

Seasonal differences in average time outside (A), sun exposure index (SEI) (B), body surface area exposed (C), cumulative joules over the 12-wk study period (D), cumulative joules/number of days with recorded exposure (E), and weekday and weekend scaled sun exposure (sum of the cumulative weekday and weekend joules adjusted for number of recorded days) (F). Fall (n = 8), winter (n = 15), spring (n = 17), summer (n = 23). Groups without a common letter differ by Dunn's test (P < 0.05).
FIGURE 4.

Seasonal differences in postintervention serum 25-hydroxyvitamin D [25(OH)D] concentrations (A), skin reflectance measurements (B), and dietary vitamin D intakes (C). Fall (n = 8), winter (n = 15), spring (n = 17), summer (n = 23). Groups without a common letter differ by Dunn's test (P < 0.05).
Predicted serum 25(OH)D concentrations in overweight and obese participants were overestimated by the *Hall model
We tested the difference between 25(OH)DPRED and 25(OH)DACTUAL for bias (HA: difference between predicted and actual does not equal 0) using 3 different sun exposure calculations (Table 3). Using the total accumulation of recorded sun exposure energy, the *Hall model resulted in a mean 25(OH)DPRED of 120.36 ± 42.12 nmol/L, which resulted in an overestimation of 25(OH)D concentrations by an average of 80.98 ± 4.83 nmol/L (Table 3). Similarly, adjusting the cumulative recorded sun exposure energy by the number of days resulted in a mean 25(OH)DPRED of 66.71 ± 22.81, resulting in an overestimation average of 27.33 ± 2.94 nmol/L (Table 3). When adjusting for exposures occurring on weekdays and weekends, the *Hall model resulted in a mean 25(OH)DPRED of 78.28 ± 26.73 and overestimated 25(OH)D concentrations by an average of 38.89 ± 3.26 nmol/L (Table 3).
TABLE 3.
Comparison of predicted serum 25(OH)D from *Hall regression model compared to measured week 15 serum 25(OH)D concentrations1
| Model | Average bias | t value | P |
|---|---|---|---|
| With season2 | |||
| Total sun exposure,4 J | 80.98 ± 4.83a | 16.76 | <0.0001 |
| Average recorded sun exposure,5 J | 27.33 ± 2.94b | 9.29 | <0.0001 |
| Scaled total sun exposure,6 J | 38.89 ± 3.26b | 11.93 | <0.0001 |
| Without season3 | |||
| Total sun exposure,4 J | 143.78 ± 6.63a | 21.70 | <0.0001 |
| Average recorded sun exposure,5 J | 61.30 ± 3.06c | 20.04 | <0.0001 |
| Scaled daily sun exposure,6 J | 78.87 ± 3.61b | 21.85 | <0.0001 |
Bias calculated as follows: predicted 25-hydroxyvitamin D minus measured 25-hydroxyvitamin D. Average bias is expressed as mean ± SE. Average bias values without a common letter differ (Tukey test). The t value is relative distance between 0 and bias. P value derived from Student's t test. P < 0.05 considered statistically significant. 25(OH)D, 25-hydroxyvitamin D.
Full model with season variable calculated as follows: ln 25(OH)D = 1.57739 + (1.12760 × badge0.1) + (0.12436 × ln dietary D) + (0.0000003754065 × skin reflectance3.4) − (0.57209 × winter) − (0.60856 × spring) − (0.37243 × summer).
Full model without season variable calculated as follows: ln 25(OH)D = 1.57739 + (1.12760 × badge0.1) + (0.12436 × ln dietary D) + (0.0000003754065 × skin reflectance3.4).
Cumulative joules over 12-wk study period.
Cumulative joules /number of days with recorded exposure.
Weekday and weekend scaled sun exposure. Sum of the cumulative weekday and weekend joules adjusted for number of recorded days.
Dropping the seasonal parameter from the *Hall model predicted higher 25(OH)D concentrations compared with models including the seasonal variable (Table 3). Generally, bias between the predicted and actual 25(OH)D was 1.7–2.2 times higher in the model without the season variable, depending how sun exposure was calculated.
Greatest explained variance in serum 25(OH)D concentrations when intra-abdominal adipose tissue was included with sun exposure and skin reflectance
Because we observed a significant bias between 25(OH)DPRED and actual 25(OH)DACTUAL using the *Hall model, we developed a new model to predict serum 25(OH)D in overweight and obese adults. When forcing all parameters from the *Hall model into the regression analysis, only 16% of the variance in week 15 serum 25(OH)D concentrations was explained (Table 4). Using backward stepwise regression, we selected total sun exposure, skin reflectance, total fat mass, total lean mass, intra-abdominal adipose tissue, and waist circumference as predictors; however, waist circumference was dropped from the model after assessment of the variable inflation factor calculations for multicollinearity. The final regression model, shown in Table 4, explained 29% of the variance in week 15 serum 25(OH)D concentrations. When forcing total sun exposure, skin reflectance, and a single body composition measurements into regression models, a model including IAAT explained the most variance in week 15 serum 25(OH)D concentrations (23.4%) relative to other models (Table 5).
TABLE 4.
Multiple linear regression models explaining week 15 serum 25(OH)D concentrations in overweight and obese adults1
| Model | Coefficient estimate | t value | P | R 2 |
|---|---|---|---|---|
| Parameters from *Hall model | 0.161 | |||
| Intercept | 1.07 ± 18.1 | 0.06 | 0.953 | |
| Sun exposure,2 J | 0.0009 ± 0.0004 | 2.29 | <0.05 | |
| Dietary vitamin D,3 IU/d | −0.01 ± 0.02 | −0.57 | 0.570 | |
| Skin reflectance,4 L* | 0.63 ± 0.28 | 2.28 | <0.05 | |
| Winter | Ref | |||
| Spring | −2.09 ± 5.09 | −0.41 | 0.683 | |
| Summer | −1.73 ± 4.8 | −0.36 | 0.720 | |
| Fall | −0.85 ± 6.01 | −0.14 | 0.887 | |
| Backward stepwise regression5 | 0.291 | |||
| Intercept | −26.59 ± 22.27 | −1.19 | 0.237 | |
| Sun exposure,2 J | 0.0008 ± 0.0003 | 2.32 | <0.05 | |
| Skin reflectance,4 L* | 0.84 ± 0.28 | 3.00 | <0.01 | |
| Total fat mass, kg | 0.11 ± 0.21 | 0.52 | 0.605 | |
| Total lean mass, kg | 0.40 ± 0.19 | 2.08 | <0.05 | |
| Intra-abdominal adipose tissue, cc | −0.36 ± 0.13 | −2.70 | <0.01 |
n = 63 unless noted. Values are coefficient estimate ± coefficient SE. t value is relative distance between 0 and the coefficient. P value derived from Student's t test, P < 0.05). 25(OH)D, 25-hydroxyvitamin D; Ref, reference.
Cumulative joules per participant.
Daily vitamin D intake.
Mean of average of forehead and hand L* reflectance per participant.
Predictive variables included sun exposure, skin reflectance, dietary vitamin D consumption, body weight, percentage body fat, total fat mass, total lean mass, android fat mass, gynoid fat mass, intra-abdominal adipose tissue, BMI, and waist circumference; backward stepwise regression with selection criteria based on Akaike information criterion. n = 61.
TABLE 5.
Multiple linear regression models explaining week 15 serum 25(OH)D concentrations in overweight and obese adults1
| Model | Coefficient estimate | t value | P | R 2 |
|---|---|---|---|---|
| Base model | 0.153 | |||
| Intercept | −3.81 ± 16.19 | −0.24 | 0.815 | |
| Sun exposure,2 J | 0.0009 ± 0.0003 | 2.55 | <0.05 | |
| Skin reflectance,3 L* | 0.65 ± 0.27 | 2.46 | <0.05 | |
| Base model with IAAT included4 | 0.234 | |||
| Intercept | 0.67 ± 17.58 | 0.04 | 0.970 | |
| Sun exposure,2 J | 0.0008 ± 0.0003 | 2.24 | <0.05 | |
| Skin reflectance,3 L* | 0.74 ± 0.28 | 2.64 | <0.05 | |
| IAAT, cc | −0.31 ± 0.13 | −2.31 | <0.05 | |
| Base model with lean mass included | 0.183 | |||
| Intercept | −21.11 ± 19.84 | −1.06 | 0.292 | |
| Sun exposure,2 J | 0.0009 ± 0.0003 | 2.60 | <0.05 | |
| Skin reflectance,3 L* | 0.73 ± 0.27 | 2.72 | <0.01 | |
| Total lean mass, kg | 0.27 ± 0.18 | 1.48 | 0.144 | |
| Base model with waist circumference included5 | 0.172 | |||
| Intercept | 29.46 ± 30.66 | 0.96 | 0.341 | |
| Sun exposure,2 J | 0.0008 ± 0.0004 | 2.11 | <0.05 | |
| Skin reflectance,3 L* | 0.62 ± 0.3 | 2.05 | <0.05 | |
| Waist circumference, cm | −0.34 ± 0.24 | −1.42 | 0.163 | |
| Base model with fat mass included | 0.154 | |||
| Intercept | −2.17 ± 17.52 | −0.12 | 0.902 | |
| Sun exposure,2 J | 0.0009 ± 0.0004 | 2.37 | <0.05 | |
| Skin reflectance,3 L* | 0.66 ± 0.27 | 2.45 | <0.05 | |
| Total fat mass, kg | −0.05 ± 0.21 | −0.26 | 0.797 |
n = 63 unless noted. Values are coefficient estimate ± coefficient SE. The t value is relative distance between 0 and the coefficient. P value derived from Student's t test, P < 0.05. 25(OH)D, 25-hydroxyvitamin D; IAAT, intra-abdominal adipose tissue,
Cumulative joules per participant.
Mean of average of forehead and hand L* reflectance per participant.
n = 61.
n = 59.
Discussion
It is recognized that vitamin D deficiency is an independent risk factor associated with obesity (8, 31, 32). Similar to several cross-sectional studies that have observed reduced circulating 25(OH)D concentrations in relation to increased markers of adiposity (6, 33–35), we found an inverse relationship between serum 25(OH)D concentrations and indices of visceral fat (IAAT and waist circumference). A prior study showed that obese individuals had lower circulating vitamin D concentrations compared to lean individuals after exposure to UVB radiation from a walk-in radiation chamber, suggesting that the parent vitamin D compound is sequestered in the larger volume of adiposity in obese participants (9). While that experiment provided evidence for sequestration of the parent compound in adipose tissue, it does not address sun exposure behaviors that may limit exposure to ambient UVB energy needed to produce dermal synthesis of vitamin D in overweight and obese populations. To our knowledge, this study is the first to objectively measure ambient sun exposure in this population and relate it to serum 25(OH)D concentration. We estimated ambient exposure to UVB energy (i.e., sun exposure) using key information obtained from sun exposure diaries to assess time in direct sun, location of sun exposure, and clothing worn and found that UVB energy significantly correlated to serum 25(OH)D concentrations in overweight and obese individuals with low vitamin D intakes. Interestingly, sun exposure, as a function of UVB energy, negatively correlated to BMI in this group, and this negative relationship becomes more widespread among other adiposity measures when focusing on nonenergy indicators of sun exposure (e.g., time outside, percentage BSA exposed, SEI). Our data suggest that even within obese populations, sun exposure and potential sun exposure behavior are reduced with increasing levels of adiposity, further contributing to the risk of vitamin D insufficiency in this population.
We conducted a secondary analysis of a randomized trial investigating the inclusion of dairy products to increase weight loss in overweight and obese study participants. A strength of this approach was the controlled feeding, so vitamin D intake was controlled and known over the course of the study. Dietary vitamin intakes were minimal and did not correlate to serum 25(OH)D concentrations. In contrast, sun exposure significantly correlated to serum 25(OH)D concentrations. Still, sun exposure levels measured in this study were inadequate to raise average serum 25(OH)D over the intervention period, even though the majority of individuals (64%) were enrolled during the spring and summer seasons and averaged 20 min/d for a recorded exposure. Recent estimates in the United Kingdom suggest 9–25 min of daily sun exposure per day (for skin types I and V, 35% BSA exposed with cloudless sun exposure around solar noon) between March and September would ensure 97.5% of the population had circulating 25(OH)D concentrations >89.6 nmol/L (36, 37). The central valley of California, where Sacramento and Davis are located, has mild winters and a long, hot, and dry summer with very little cloud cover. The region's latitude is located 12° lower than that of the United Kingdom and also has a high to very high daily UV index between April and October. Thus, it is surprising that the sun exposure level in this study did not appreciably increase serum 25(OH)D concentration during the summer and fall seasons. While our data do not meet all of the assumptions of the UK studies (36, 37), they suggest that overweight and obese participants in our study may need significantly greater exposure times to meet a similar circulating 25(OH)D concentration, even at lower latitudes with abundant sun.
We found that the *Hall model (17), which only accounts for sun exposure, dietary vitamin D intake, skin pigmentation, and season, significantly overestimated serum 25(OH)D concentrations in overweight and obese adults enrolled in our study. This finding was not entirely surprising and is likely an effect of reduced circulating 25(OH)D concentrations in overweight and obese individuals assessed in the current study compared to the normal-weight participants in the Hall study. Still, the discrepancy could also be partially explained by the fact that the prior study measured UVB energy with polysulphone dosimeters compared to targeted ambient UVB energy measurements in this study. Daily personal UVB exposure from polysulphone dosimeters has been compared to total daily ambient UVB measurements and it was found that differences were more apparent in summer months and at lower latitudes (38). We used the approach of downloading ambient UVB measurements at specific exposure times, but Hall's approach (38) suggests that ambient measurements may not be completely accurate depending on several circumstances. Participants in the study by Hall et al. (17) also recorded sun exposure using the same sun exposure diary employed in the current study and found concordant results between polysulphone dosimeters and ambient measurements (L Hall, unpublished results, 2008). Regardless, we were able to explain at least 29% of the variance in serum 25(OH)D concentrations by including sun exposure, skin reflectance, and several body composition parameters in a linear regression model. This is in line with other studies modeling indices of UVB energy–based measurements of sun exposure (39, 40). A diary approach is also more amenable to clinical applications because it requires few additional resources (e.g., polysulphone badges) and can be adapted to an easy-to-use mobile app to reduce subject burden. Thus, validating this approach or those of other diary-based methods may allow researchers and clinicians to quantitatively measure vitamin D equivalent sun exposure doses to optimize serum 25(OH)D concentrations.
Seasonal differences in circulating 25(OH)D concentrations are dependent on seasonal oscillations in solar energy and amplified with increasing latitudes (41); however, we did not find any seasonal difference in serum 25(OH)D as previously observed or predicted in other studies investigating obese populations (42–45). Dermal exposure to UVB energy was greatest in spring and summer, mirroring studies using polysulphone dosimeters (18, 21, 46). Those studies also saw a transient increase in circulating 25(OH)D concentrations in the fall, which we did not observe. Previous work revealed that individuals with greater total fat have a blunted seasonal variation in serum 25(OH)D concentrations relative to those with lower total fat (42). This would partially explain our findings; however, we also had fewer fall enrollees and were likely underpowered to identify seasonal differences. Future studies are needed to confirm our findings and verify the lack of seasonal differences in serum 25(OH)D in overweight and obese individuals.
We developed a new prediction model of serum 25(OH)D concentrations that included sun exposure, skin reflectance, total fat mass, total lean mass, and intra-abdominal adipose tissue. Interestingly, vitamin D intake was not selected as a predictor in this model, likely due to the low intake levels. Similar to our results, a report from Australia showed that vitamin D intake (from oily fish) was not retained in backward stepwise regression models that also included sun exposure from polysulphone dosimeters, skin reflectance (hand), BMI, and several other factors (47). Combined with our study, this line of evidence suggests that dietary sources of vitamin D minimally affect circulating 25(OH)D levels and that sun exposure is the major contributor. It should be noted that the admission of vitamin D supplementation was retained in models developed by Kimlin et al. (47), suggesting the reliance of supplementation if adequate sun exposure is not achieved or recommended. These studies also demonstrate the need to account for body composition when assessing circulating 25(OH)D concentration. Our study indicates that measurements of visceral fat explained more of the variability in serum 25(OH)D than did the other adiposity indices. Other investigators have also noted significant correlations between circulating 25(OH)D and visceral fat (4, 48), suggesting that the lower concentrations of circulating 25(OH)D observed in obesity may be related to the accumulation of visceral fat, rather than total fat. To our knowledge, this has not been rigorously studied and warrants further investigations.
While this study has several strengths, e.g., objective measurements of sun exposure in a vulnerable population and known vitamin D intake, there are several limitations that must be addressed. Primarily, this is a secondary analysis of a clinical trial, so our analyses may be underpowered. Subjects also lost weight during the trial and we did not account for this effect on serum 25(OH)D concentrations. While we saw no differences between week 3 and week 15 25(OH)D concentrations, a recent meta-analysis suggests that 25(OH)D increases with reductions of weight and fat mass (49). It is recognized that individuals generally underestimate report food intake (50), thus a strength of our study in terms of assessing vitamin D intake; however, the sun exposure diaries have not been rigorously tested and inherent biases toward over- or under-reporting is not currently known. Additionally, we collected information regarding sunscreen application and SPF levels, however, these data were not included in the model. Also, sun exposure conditions at climate stations may not reflect the exact conditions encountered by the participant at a given exposure time. A pyranometer measures UV radiation on flat and horizontal planes in unshaded areas, which does not represent the human shape. Lastly, the BSA calculation does not take into account areas of the body shaded by arms and other body areas, or body areas not in the direct angle of the sun. For these reasons, total sun exposure energy may be overestimated in our models.
In conclusion, the *Hall model did not accurately predict serum 25(OH)D concentrations in overweight and obese individuals. The previously reported dietary vitamin D intake recommendation of 200 IU/d was a poor predictor of 25(OH)D, whereas body composition variables may be important contributors to the prediction of serum 25(OH)D. We suggest a predictive model that includes sun exposure, skin reflectance, and several body composition variables to predict serum 25(OH)D in overweight and obese individuals.
Acknowledgments
The authors’ responsibilities were as follows—MDVL: designed research; BDP, LMH, and MDVL: conducted the study; BDP, LMH, CBS, and ERG: provided essential reagents and materials; BDP: analyzed data; BDP, LMH, CBS, ERG, and MDVL: wrote the paper; BDP: had primary responsibility for final content; and all authors read and approved the final manuscript.
Reference to a company or product name does not imply approval or recommendation of the product to the exclusion of equivalent materials. The USDA is an equal opportunity provider and employer.
Notes
Funding for this project was provided by the National Dairy Council and administered by the Dairy Research Institute (58-5306-9-339) and the Dairy Council of California. Additional support was provided by USDA Agricultural Research Service intramural projects (5306-51530-006-00D and 6251-51000-010-05S), and the National Center for Research Resources Clinical and Translational Science Center of the University of California, Davis (UL1 RR024146)
Author disclosures: BDP, LMH, CBS, ERG, and MDVL, no conflicts of interest.
Supporting files, including data and R coding, can be found at https://github.com/bdpiccolo/Piccoloetal_SunExposure.
Abbreviations used: 25(OH)D, 25-hydroxyvitamin D; 25(OH)DACTUAL, measured serum 25(OH)D concentration; 25(OH)DPRED, predicted serum 25(OH)D concentration; BSA, body surface area; BSAE, body surface area exposed; DXA, dual energy x-ray absorptiometry; IAAT, intra-abdominal adipose tissue; IU, international units; SEI, sun exposure index; UVB, ultraviolet B radiation; UVMRP, UVB Monitoring and Research Program; WHNRC, Western Human Nutrition Research Center.
References
- 1. Di Angelantonio E, Bhupathiraju SN, Wormser D, Gao P, Kaptoge S, de Gonzalez AB, Cairns BJ, Huxley R, Jackson CL, Joshy G et al.. Body-mass index and all-cause mortality: individual-participant-data meta-analysis of 239 prospective studies in four continents. Lancet 2016;388:776–86. [DOI] [PMC free article] [PubMed] [Google Scholar]
- 2. GBD 2015 Obesity Collaborators, Afshin A, Forouzanfar MH, Reitsma MB, Sur P, Estep K, Lee A, Marczak L, Mokdad AH, Moradi-Lakeh M et al.. Health effects of overweight and obesity in 195 countries over 25 years. N Engl J Med 2017;377:13–27. [DOI] [PMC free article] [PubMed] [Google Scholar]
- 3. Samuel L, Borrell LN.. The effect of body mass index on optimal vitamin D status in U.S. adults: The National Health and Nutrition Examination Survey 2001–2006. Ann Epidemiol 2013;23:409–14. [DOI] [PubMed] [Google Scholar]
- 4. Zhang M, Li P, Zhu Y, Chang H, Wang X, Liu W, Zhang Y, Huang G. Higher visceral fat area increases the risk of vitamin D insufficiency and deficiency in Chinese adults. Nutr Metab (Lond) 2015;12:50. [DOI] [PMC free article] [PubMed] [Google Scholar]
- 5. Al-khalidi B, Kimball SM, Kuk JL, Ardern CI. Metabolically healthy obesity, vitamin D, and all-cause and cardiometabolic mortality risk in NHANES III. Clin Nutr 2019;38:820–8. [DOI] [PubMed] [Google Scholar]
- 6. Looker AC. Body fat and vitamin D status in black versus white women. J Clin Endocrinol Metab 2005;90:635–40. [DOI] [PubMed] [Google Scholar]
- 7. Ceglia L, Nelson J, Ware J, Alysandratos K-D, Bray GA, Garganta C, Nathan DM, Hu FB, Dawson-Hughes B, Pittas AG et al.. Association between body weight and composition and plasma 25-hydroxyvitamin D level in the Diabetes Prevention Program. Eur J Nutr 2017;56:161–70. [DOI] [PMC free article] [PubMed] [Google Scholar]
- 8. Hyppönen E, Boucher BJ.. Adiposity, vitamin D requirements, and clinical implications for obesity-related metabolic abnormalities. Nutr Rev 2018;76:678–92. [DOI] [PubMed] [Google Scholar]
- 9. Wortsman J, Matsuoka LY, Chen TC, Lu Z, Holick MF. Decreased bioavailability of vitamin D in obesity. Am J Clin Nutr 2000;72:690–3. [DOI] [PubMed] [Google Scholar]
- 10. Drincic AT, Armas LAG, Van Diest EE, Heaney RP. Volumetric dilution, rather than sequestration best explains the low vitamin D status of obesity. Obesity 2012;20:1444–8. [DOI] [PubMed] [Google Scholar]
- 11. Institute of Medicine (US) Committee to Review Dietary Reference Intakes for Vitamin D and Calcium, Ross AC, Taylor CL, Yaktine AL, Valle HB Del. Dietary reference intakes for calcium and vitamin D. Dietary reference intakes for calcium and vitamin D. Washington, DC: National Academies Press (US); 2011. [PubMed] [Google Scholar]
- 12. Matsuoka LY, Wortsman J, Haddad JG, Hollis BW. In vivo threshold for cutaneous synthesis of vitamin D3. J Lab Clin Med 1989;114:301–5. [PubMed] [Google Scholar]
- 13. Hypponen E, Power C.. Hypovitaminosis D in British adults at age 45 y: nationwide cohort study of dietary and lifestyle predictors. Am J Clin Nutr 2007;85:860–8. [DOI] [PubMed] [Google Scholar]
- 14. Shoben AB, Kestenbaum B, Levin G, Hoofnagle AN, Psaty BM, Siscovick DS, de Boer IH. Seasonal variation in 25-hydroxyvitamin D concentrations in the cardiovascular health study. Am J Epidemiol 2011;174:1363–72. [DOI] [PMC free article] [PubMed] [Google Scholar]
- 15. Maeda SS, Saraiva GL, Hayashi LF, Cendoroglo MS, Ramos LR, Corrêa M de P, Henrique de Mesquita C, Lazaretti-Castro M. Seasonal variation in the serum 25-hydroxyvitamin D levels of young and elderly active and inactive adults in São Paulo, Brazil. Dermatoendocrinol 2013;5:211–7. [DOI] [PMC free article] [PubMed] [Google Scholar]
- 16. Scragg RKR, Stewart AW, McKenzie RL, Reeder AI, Liley J Ben, Allen MW. Sun exposure and 25-hydroxyvitamin D3 levels in a community sample: quantifying the association with electronic dosimeters. J Expo Sci Environ Epidemiol 2017;27:471–7. [DOI] [PubMed] [Google Scholar]
- 17. Hall LM, Kimlin MG, Aronov PA, Hammock BD, Slusser JR, Woodhouse LR, Stephensen CB. Vitamin D intake needed to maintain target serum 25-hydroxyvitamin D concentrations in participants with low sun exposure and dark skin pigmentation is substantially higher than current recommendations. J Nutr 2010;140:542–50. [DOI] [PMC free article] [PubMed] [Google Scholar]
- 18. Webb AR, Kift R, Durkin MT, O'Brien SJ, Vail A, Berry JL, Rhodes LE. The role of sunlight exposure in determining the vitamin D status of the U.K. white adult population. Br J Dermatol 2010;163:1050–5. [DOI] [PubMed] [Google Scholar]
- 19. Patwardhan V, Mughal Z, Chiplonkar S, Webb A, Kift R, Khadilkar V, Padidela R, Khadilkar A. Duration of casual sunlight exposure necessary for adequate vitamin D status in Indian men. Indian J Endocrinol Metab 2018;22:249. [DOI] [PMC free article] [PubMed] [Google Scholar]
- 20. Kift R, Berry JL, Vail A, Durkin MT, Rhodes LE, Webb AR. Lifestyle factors including less cutaneous sun exposure contribute to starkly lower vitamin D levels in U.K. South Asians compared with the white population. Br J Dermatol 2013;169:1272–8. [DOI] [PubMed] [Google Scholar]
- 21. Farrar MD, Mughal MZ, Adams JE, Wilkinson J, Berry JL, Edwards L, Kift R, Marjanovic E, Vail A, Webb AR et al.. Sun exposure behavior, seasonal vitamin D deficiency, and relationship to bone health in adolescents. J Clin Endocrinol Metab 2016;101:3105–13. [DOI] [PubMed] [Google Scholar]
- 22. Kift R, Rhodes L, Farrar M, Webb A, Kift R, Rhodes LE, Farrar MD, Webb AR. Is sunlight exposure enough to avoid wintertime vitamin D deficiency in United Kingdom population groups? Int J Environ Res Public Health 2018;15:1624. [DOI] [PMC free article] [PubMed] [Google Scholar]
- 23. Van Loan MD, Keim NL, Adams SH, Souza E, Woodhouse LR, Thomas A, Witbracht M, Gertz ER, Piccolo B, Bremer AA et al.. Dairy foods in a moderate energy restricted diet do not enhance central fat, weight, and intra-abdominal adipose tissue losses nor reduce adipocyte size or inflammatory markers in overweight and obese adults: a controlled feeding study. J Obes 2011;2011:989657. [DOI] [PMC free article] [PubMed] [Google Scholar]
- 24. Calvo MS, Whiting SJ, Barton CN. Vitamin D fortification in the United States and Canada: current status and data needs. Am J Clin Nutr 2004;80:1710S–6S. [DOI] [PubMed] [Google Scholar]
- 25. Pilz S, März W, Cashman KD, Kiely ME, Whiting SJ, Holick MF, Grant WB, Pludowski P, Hiligsmann M, Trummer C et al.. Rationale and plan for vitamin D food fortification: a review and guidance paper. Front Endocrinol (Lausanne) 2018;9:373. [DOI] [PMC free article] [PubMed] [Google Scholar]
- 26. Clasey JL, Bouchard C, Teates CD, Riblett JE, Thorner MO, Hartman ML, Weltman A. The use of anthropometric and dual-energy X-ray absorptiometry (DXA) measures to estimate total abdominal and abdominal visceral fat in men and women. Obes Res 1999;7:256–64. [DOI] [PubMed] [Google Scholar]
- 27. Natural Resource Ecology Laboratory. UV-B monitoring and research program [Internet]. Colorado State University; [date unknown]: [cited 2019 April 25]. Available from: http://uvb.nrel.colostate.edu/UVB/da_queryErythemal.jsf. [Google Scholar]
- 28. McKinlay C, Diffey A.. A reference action spectrum for ultraviolet induced erythema in human skin. CIE J 1987;66:17–22. [Google Scholar]
- 29. Webb AR. Who, what, where and when—influences on cutaneous vitamin D synthesis. Prog Biophys Mol Biol 2006;92:17–25. [DOI] [PubMed] [Google Scholar]
- 30. R Core Team. R: A language and environment for statistical computing [Internet]. Vienna, Austria: R Foundation for Statistical Computing; 2018. Available from: http://www.r-project.org [Google Scholar]
- 31. Pereira-Santos M, Costa PRF, Assis AMO, Santos CAST, Santos DB. Obesity and vitamin D deficiency: a systematic review and meta-analysis. Obes Rev 2015;16:341–9. [DOI] [PubMed] [Google Scholar]
- 32. Holick MF, Binkley NC, Bischoff-Ferrari HA, Gordon CM, Hanley DA, Heaney RP, Murad MH, Weaver CM. Evaluation, treatment, and prevention of vitamin D deficiency: an Endocrine Society Clinical Practice Guideline. J Clin Endocrinol Metab 2011;96:1911–30. [DOI] [PubMed] [Google Scholar]
- 33. Arunabh S, Pollack S, Yeh J, Aloia JF. Body fat content and 25-hydroxyvitamin D levels in healthy women. J Clin Endocrinol Metab 2003;88:157–61. [DOI] [PubMed] [Google Scholar]
- 34. Jorde R, Sneve M, Emaus N, Figenschau Y, Grimnes G. Cross-sectional and longitudinal relation between serum 25-hydroxyvitamin D and body mass index: the Tromso study. Eur J Nutr 2010;49:401–7. [DOI] [PubMed] [Google Scholar]
- 35. Blum M, Dallal GE, Dawson-Hughes B. Body size and serum 25 hydroxy vitamin D response to oral supplements in healthy older adults. J Am Coll Nutr 2008;27:274–9. [DOI] [PMC free article] [PubMed] [Google Scholar]
- 36. Webb A, Kazantzidis A, Kift R, Farrar M, Wilkinson J, Rhodes L, Webb AR, Kazantzidis A, Kift RC, Farrar MD et al.. Meeting vitamin D requirements in white Caucasians at UK latitudes: providing a choice. Nutrients 2018;10:497. [DOI] [PMC free article] [PubMed] [Google Scholar]
- 37. Webb A, Kazantzidis A, Kift R, Farrar M, Wilkinson J, Rhodes L, Webb AR, Kazantzidis A, Kift RC, Farrar MD et al.. Colour counts: sunlight and skin type as drivers of vitamin D deficiency at UK latitudes. Nutrients 2018;10:457. [DOI] [PMC free article] [PubMed] [Google Scholar]
- 38. Sun J, Lucas RM, Harrison S, van der Mei I, Armstrong BK, Nowak M, Brodie A, Kimlin MG. The relationship between ambient ultraviolet radiation (UVR) and objectively measured personal UVR exposure dose is modified by season and latitude. Photochem Photobiol Sci 2014;13:1711–8. [DOI] [PubMed] [Google Scholar]
- 39. Nair-Shalliker V, Clements M, Fenech M, Armstrong BK. Personal sun exposure and serum 25-hydroxy vitamin D concentrations. Photochem Photobiol 2013;89:208–14. [DOI] [PubMed] [Google Scholar]
- 40. Kelly D, Theodoratou E, Farrington SM, Fraser R, Campbell H, Dunlop MG, Zgaga L. The contributions of adjusted ambient ultraviolet B radiation at place of residence and other determinants to serum 25-hydroxyvitamin D concentrations. Br J Dermatol 2016;174:1068–78. [DOI] [PubMed] [Google Scholar]
- 41. Webb AR, Kline L, Holick MF. Influence of season and latitude on the cutaneous synthesis of vitamin D3: exposure to winter sunlight in Boston and Edmonton will not promote vitamin D3 synthesis in human skin. J Clin Endocrinol Metab 1988;67:373–8. [DOI] [PubMed] [Google Scholar]
- 42. Bolland MJ, Grey AB, Ames RW, Mason BH, Horne AM, Gamble GD, Reid IR. The effects of seasonal variation of 25-hydroxyvitamin D and fat mass on a diagnosis of vitamin D sufficiency. Am J Clin Nutr 2007;86:959–64. [DOI] [PubMed] [Google Scholar]
- 43. Olmos JM, Hernández JL, Pariente E, Martínez J, González-Macías J. Serum 25-hydroxyvitamin D in obese Spanish adults: the Camargo Cohort Study. Obes Surg 2018;28:3862–71. [DOI] [PubMed] [Google Scholar]
- 44. Vuistiner P, Rousson V, Henry H, Lescuyer P, Boulat O, Gaspoz J-M, Mooser V, Vollenweider P, Waeber G, Cornuz J et al.. A population-based model to consider the effect of seasonal variation on serum 25(OH)D and vitamin D status. Biomed Res Int 2015;2015:1–9. [DOI] [PMC free article] [PubMed] [Google Scholar]
- 45. Ernst B, Thurnheer M, Schmid SM, Wilms B, Schultes B. Seasonal variation in the deficiency of 25-hydroxyvitamin D3 in mildly to extremely obese subjects. Obes Surg 2009;19:180–3. [DOI] [PubMed] [Google Scholar]
- 46. Rhodes LE, Webb AR, Berry JL, Felton SJ, Marjanovic EJ, Wilkinson JD, Vail A, Kift R. Sunlight exposure behaviour and vitamin D status in photosensitive patients: longitudinal comparative study with healthy individuals at U.K. latitude. Br J Dermatol 2014;171:1478–86. [DOI] [PubMed] [Google Scholar]
- 47. Kimlin MG, Lucas RM, Harrison SL, van der Mei I, Armstrong BK, Whiteman DC, Kricker A, Nowak M, Brodie AM, Sun J. The contributions of solar ultraviolet radiation exposure and other determinants to serum 25-hydroxyvitamin D concentrations in Australian adults: The AusD Study. Am J Epidemiol 2014;179:864–74. [DOI] [PubMed] [Google Scholar]
- 48. Hao Y, Ma X, Shen Y, Ni J, Luo Y, Xiao Y, Bao Y, Jia W. Associations of serum 25-hydroxyvitamin D3 levels with visceral adipose tissue in Chinese men with normal glucose tolerance. PLoS One 2014;9:e86773. [DOI] [PMC free article] [PubMed] [Google Scholar]
- 49. Pannu PK, Zhao Y, Soares MJ. Reductions in body weight and percent fat mass increase the vitamin D status of obese subjects: a systematic review and metaregression analysis. Nutr Res 2016;36:201–13. [DOI] [PubMed] [Google Scholar]
- 50. Dhurandhar NV, Schoeller D, Brown AW, Heymsfield SB, Thomas D, Sørensen TIA, Speakman JR, Jeansonne M, Allison DB, Group the EBMW. Energy balance measurement: when something is not better than nothing. Int J Obes 2015;39:1109–13. [DOI] [PMC free article] [PubMed] [Google Scholar]