Abstract
Background:
Management of tumors has become more complex owing to tumor heterogeneity. Fewer studies have been performed on intra-tumor heterogeneity of endometrial cancer (EC) until now. Therefore, it is of great clinical value to explore the intra-tumor heterogeneity of EC based on clinical features and gene expression profiles.
Methods:
A total of 1688 patients with EC were screened and 114 patients were finally selected, including specimens from 84 patients with primary EC without relapse (PE) and the paired metastases (P-M) specimens, as well as specimens from 30 patients with primary EC with relapse (RPE) and the paired relapsed EC (P-RE) specimens. Microarray and RNA-seq were used to detect gene expression of EC samples. Clinicopathological characteristics and molecular data were compared between PE and P-M groups and between RPE and P-RE groups to explore the intra-tumor heterogeneity of EC.
Results:
The clinical intra-tumor spatial heterogeneity of pathological type, grade, ER status, and PR status between PE and P-M were 17.9%, 13.1%, 28.6%, and 28.6%, respectively. The clinical intra-tumor spatiotemporal heterogeneity of pathological type, grade, ER status, and PR status between RPE and P-RE were 16.7%, 33.3%, 25.0%, and 37.5%, respectively. Cluster analysis sorts EC samples based on progression type of lesion and their pathological type. There were differentially expressed genes between PE and P-M and between RPE and P-RE, of which gene ontology and Kyoto Encyclopedia of Genes and Genomes analysis were mainly enriched in cell proliferation, the p53 signaling pathway, etc.
Conclusions:
Clinical and molecular data showed that there was spatiotemporal heterogeneity in intra-tumor of EC, which may add to the complexity of diagnosis and therapeutics for EC. Considering the intra-tumor heterogeneity, sequential chemotherapy and precision medicine may be a more suitable treatment plan for EC.
Keywords: Cancer, Endometrial cancer, Heterogeneity
Introduction
Endometrioid cancer (EC) is one of the most common gynecological tumors and its prevalence is increasing in younger patients.[1] Although the prognosis of EC is good, management of tumors has become more complex owing to its extensive heterogeneous prognosis, especially for stage patients, exposing women to relapsed disease.[2–4] Clinically, some patients with EC with advanced stage have a good prognosis, while some early stage patients still relapse and die quickly.[5,6]
Studies showed that intra-tumor heterogeneity exists and plays important roles in the genesis, development, and prognosis of different patients.[7–10] Tumor occurrence and development are driven by genetic alterations, and the phenotypic diversity might be accompanied by a corresponding diversity in gene expression patterns.[11] Tumor heterogeneity may foster tumor evolution and adaptation and hinder personalized-medicine strategies.[7,10,12–14] Heterogeneity degree itself might serve as a clinically valid molecular marker.[15,16] Though, there have been many studies of intra-tumor heterogeneity in breast cancer, colorectal cancers, and non-small cell lung cancer, etc, fewer studies have been performed on intra-tumor heterogeneity of EC until now. Therefore, it is of great clinical value to explore the intra-tumor heterogeneity of EC based on clinical features and gene expression profiles. Hence, to explore the spatiotemporal intra-tumor heterogeneity of EC, we analyzed clinicopathological characteristics and molecular data between primary tumors and the paired metastases or relapsed specimens, which may benefit the diagnosis and therapeutics of EC.
Methods
Ethical approval
This study was approved by the Institutional Review Board (IRB) of Peking University People's Hospital and the Affiliated Hospital of Qingdao University. Informed consent was obtained from all the patients.
Patient selection
A total of 1688 patients with EC between December 2001 and January 2016 were screened from Peking University People's Hospital (PKUPH) and the Affiliated Hospital of Qingdao University (AHQDU) cohort. Clinical data from a total of 114 patients with EC were finally selected from the screened 1688 EC samples, including 84 primary EC specimens from patients without relapse with at least 3 years follow-up (PE) and the paired metastases (P-M), as well as specimens from 30 patients with primary ECs with relapse (RPE) and the paired relapsed EC specimens (P-RE). Two patients with primary EC without relapse (PE) and the paired metastases (P-M) specimens were tested by cDNA microarray with 492 genes. Two patients with primary ECs with relapse (RPE) and the paired relapsed EC specimens (P-RE) were tested by RNA-seq. The diagnosis of all the primary EC samples was confirmed by at least two pathologists. The detailed selection of these 114 participants is shown in Figure 1.
Figure 1.

Flow chart of study participants. AHQDU: The Affiliated Hospital of Qingdao University; EC: Endometrial cancer; PKUPH: Peking University People's Hospital.
RNA isolation
The total RNA was extracted with Trizol (Tiangen, Beijing, China) and assessed with an Agilent 2100 BioAnalyzer (Agilent Technologies, Santa Clara, CA, USA) and a Qubit Fluorometer (Invitrogen, California, USA). The total RNA samples that met the following requirements were used in subsequent experiments: RNA integrity number (RIN) >7.0 and a 28S:18S ratio >1.8. All tumor specimens processed contained at least 70% cancer cells.
cDNA microarray techniques of EC samples
A low-density microarray with 492 genes[17] that were selected from EC-related literature obtained from the National Center of Biotechnology Information Web site was used to test the expression profiles of EC samples. The detailed protocols have been previously published.[18] A gene was regarded as being expressed when the intensity of the hybridization signal was 1.5-fold greater than the background signal. The expression values of housekeeping genes and the Hex gene were used as positive controls. And the spotting solution with 50% dimethyl sulfoxide was set as the negative control. The signals of the housekeeping genes were repeatable and the coefficient of variation of the ratio was no >0.3. The local background was subtracted from the remaining spots, and the ratios of net fluorescence from the Cy5-specific channel to the net fluorescence from the Cy3-specifc channel were calculated for each spot, representing tumor mRNA expression.
RNA-seq library preparation and sequencing of EC samples
RNA-seq libraries were generated and sequenced by Capital BioTechnology (Beijing, China). Triplicate samples of all the assays were constructed in an independent library, and the following sequencing and analysis were performed. The NEB Next Ultra RNA Library Prep Kit for Illumina (NEB) was used to construct the libraries for sequencing. The NEB Next Poly (A) mRNA Magnetic Isolation Module (NEB) kit was used to enrich the poly (A)-tailed mRNA molecules from 1 μg total RNA. The mRNA was fragmented into ∼200 base pair pieces. The first-strand cDNA was synthesized from the mRNA fragments reverse transcriptase and random hexamer primers, and then the second-strand cDNA was synthesized using DNA polymerase I and RNaseH. The end of the cDNA fragment was subjected to an end repair process that included the addition of a single “A” base, followed by ligation of the adapters. The products were purified and enriched by polymerase chain reaction (PCR) to amplify the library DNA. The final libraries were quantified using the KAPA Library Quantification kit (KAPA Biosystems, Cape Town, South Africa) and an Agilent 2100 Bioanalyzer. After quantitative reverse transcription-PCR (RT-qPCR) validation, the libraries were subjected to pair-end sequencing with pair-end 150-base pair reading length on an Illumina HiSeq sequencer (Illumina, San Diego, USA).[19]
Microarray data analysis
We used the Cluster and TreeView software to perform average linkage clustering,[20] which organized all of the data elements into a single tree, with the highest levels of the tree representing the undiscovered classes. First the expression level of each gene was log-transformed and then median-centerd (relative to its median expression across all samples). Ratios were log transformed (base 2) and normalized so that the relative variations were shown, rather than the absolute intensities. Only the genes with good data presence in 80% of the experiment samples were recruited. Clustering was an average linkage clustering using the Pearson correlation coefficient as the similarity metric. The algorithm arranged the order of genes and the order of samples to place those with the most correlated expression in closest proximity. The results were then displayed through the TreeView program.[21] The significance analysis of microarrays (SAM) method version 3.02 (http://www-stat.stanford.edu/) was applied to find differential expression among samples of different clinicopathologies. The qualified microarray data were filtered for presenting in 80% of the arrays and the normalized median of ratio values were log-transformed (base 2) for parametric Student and fold-change analysis, genes having P values <0.05 or showing at least a two-fold change were selected.
RNA-seq data analysis
The genome of human genome version of hg19 was used as reference (unpublished). The sequencing quality was assessed with FastQC (Version 0.11.5) and then low quality data were filtered using NGSQC (v0.4). The clean reads were then aligned to the reference genome using HISAT2 (Johns Hopkins University, Maryland, USA) with default parameters.[22] The processed reads from each sample were aligned using HISAT2 (Johns Hopkins University) against the reference genome. The gene expression analyses were performed with Cuffquant and Cuffnorm (Cufflinks 2.2.1). Cuffdiff was used to analyze the differentially expressed genes (DEGs) between samples. The standardization method of Cuffdiff is geometric, with the per-condition and pooled as the discrete model.[23]
Annotation of the DEGs
The annotation of the DEGs was performed based on the information obtained from the database of ENSEMBL, NCBI, Uniprot, gene ontology (GO), and Kyoto Encyclopedia of Genes and Genomes (KEGG) databases.
Statistical analysis
The software SPSS version 13.0 (SPSS Inc., Chicago, IL, USA) was chosen for the statistical analysis. The associations between clinicopathologic characteristics and outcomes were calculated by the χ2 test and Fisher exact test.
Results
Patient characteristics
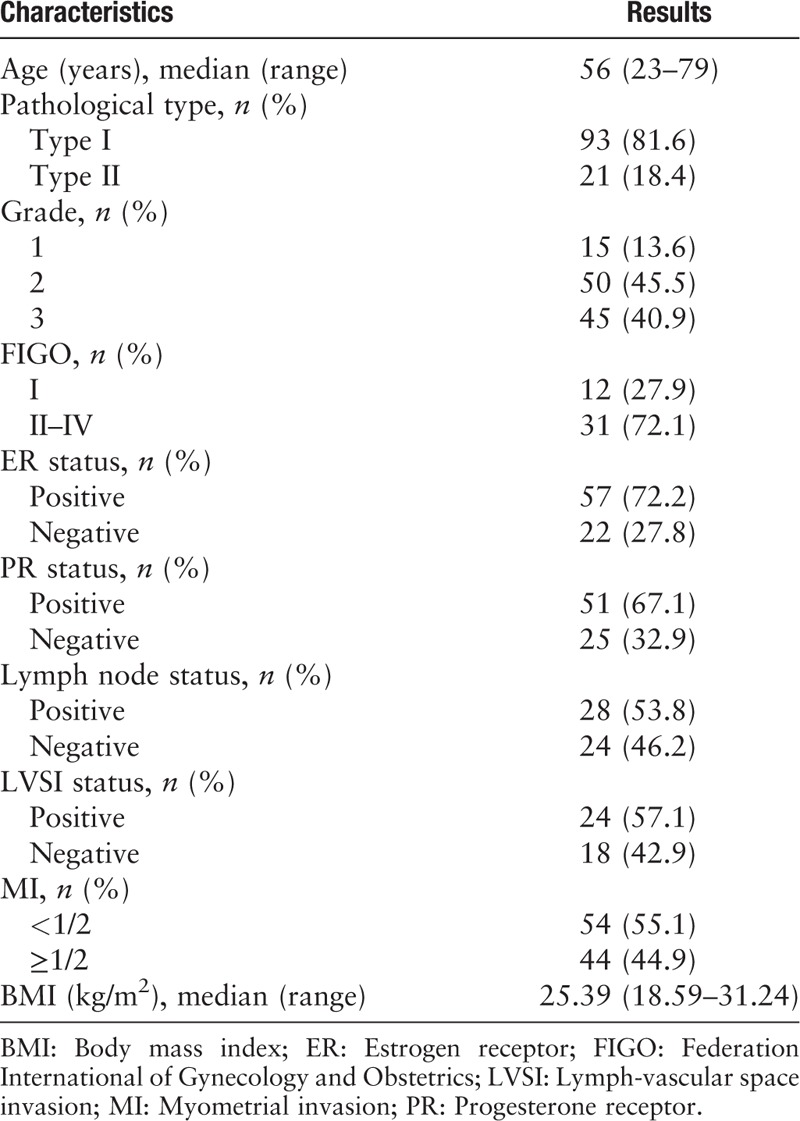
Of the 114 EC samples, the median age was 56 years (range 23–79 years), and body mass index (BMI) was 25.39 kg/m2 (range 18.59–31.24 kg/m2). The demographics and clinicopathological characteristics of the whole cohort are reported in Table 1.
Table 1.
Characteristics of patients with endometrial cancer.
Clinical spatial intra-tumor heterogeneity between primary and the paired metastatic EC
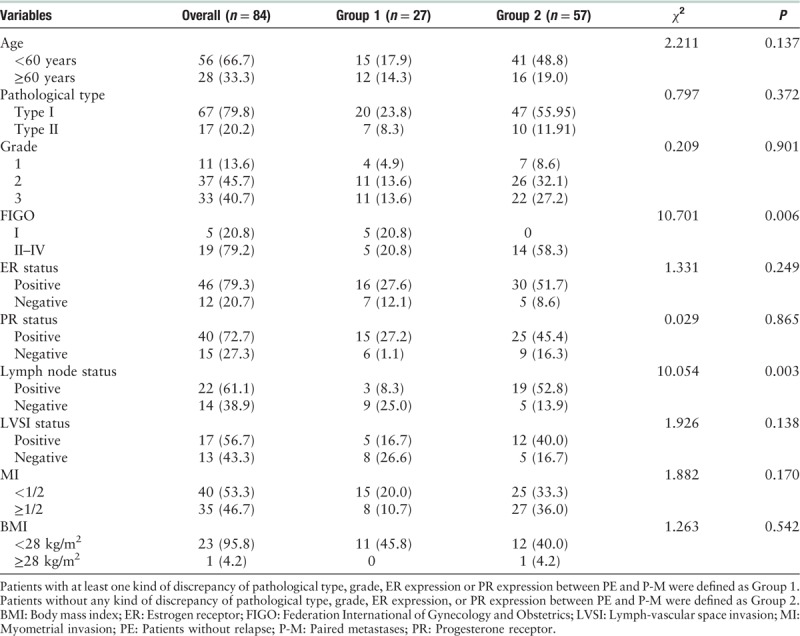
The discrepancy of pathological type between PE and P-M was 17.9% (15/84), of which 66.7% (10/15) was endometrioid adenocarcinoma (EEA, type I) and 33.3% was type II EC (including uterine serous carcinoma, clear cell carcinoma, and mixed carcinoma) [Figure 2]. The discrepancy of grade between PE and P-M was 13.2% (11/84), of which 36.4% (4/11) was grade 3, 36.4% (4/11) was grade 2, and 27.3% (3/11) was grade 1 [Figure 2]. The discrepancy of ER immunohistochemistry between PE and P-M was 28.6% (4/14). The discrepancy of PR immunohistochemistry between PE and P-M was 28.6% (4/14). Patients with at least one kind of discrepancy of pathological type, grade, ER expression, or PR expression between PE and P-M were defined as Group 1. Patients without any kind of discrepancy of pathological type, grade, ER expression, or PR expression between PE and P-M were defined as Group 2. The median age of diagnosis for the samples in Group 1 was 59 years (range 46–79 years), and the median age of diagnosis for the samples in Group 2 was 56 years (range 23–77 years). There were significant differences in FIGO stage and lymph node status between Group 1 and Group 2, while there was no significant difference in diagnostic age, pathological type, grade, ER status, PR status, lymphatic vascular infiltration (LVSI), or BMI. Detailed clinicopathological features are summarized in Table 2.
Figure 2.
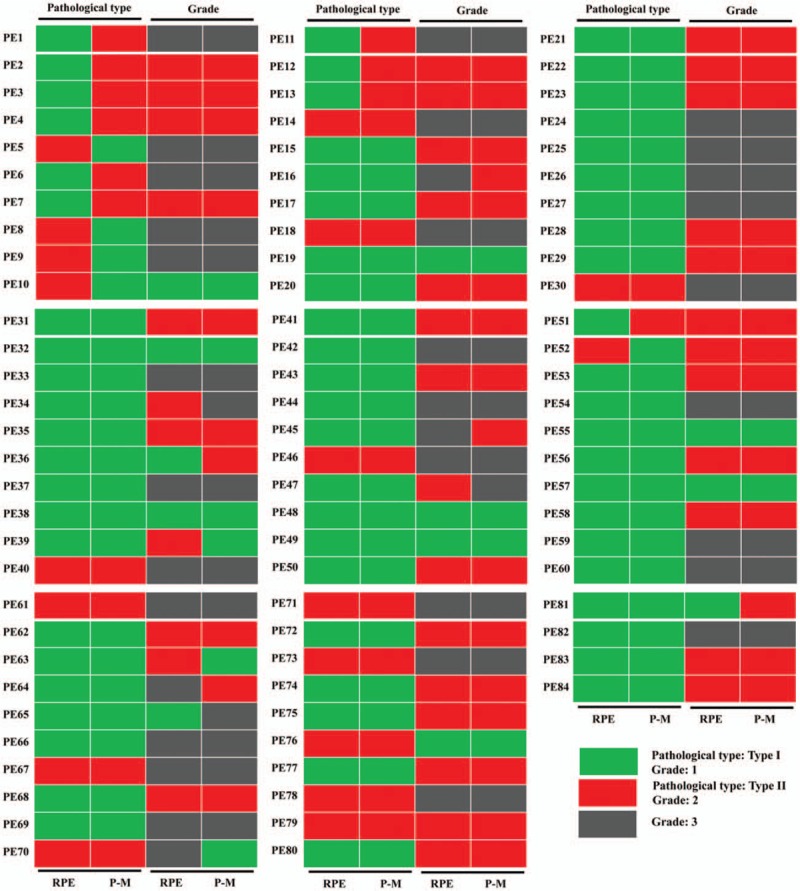
Clinical spatial heterogeneity between primary and the paired metastatic endometrial cancer. RPE: Primary endometrial cancer specimen without relapse; P-M: The paired metastatic endometrial cancer specimen without relapse.
Table 2.
Clinicopathologic characteristics of patients with endometrial cancer in Group 1 and Group 2, n (%).
Clinical spatiotemporal intra-tumor heterogeneity between primary and the paired relapsed EC
The discrepancy of pathological type between RPE and P-RE was 16.7% (5/30), of which 80.0% (4/5) was EEA (type I) and 20.0% was type II EC [Figure 3]. The discrepancy of grade between RPE and P-RE was 33.3% (10/30), of which 10.0% (1/10) was grade 3, 50.0% (5/10) was grade 2 and 40.0% (4/10) was grade 1 [Figure 3]. The discrepancy of ER immunohistochemistry between RPE and P-RE was 25.0% (2/8). The discrepancy of PR immunohistochemistry between RPE and P-RE was 37.5% (3/8). Patients with at least one kind of discrepancy of pathological type, grade, ER expression or PR expression between RPE and P-RE were defined as Group 3. Patients without any kind of discrepancy of pathological type, grade, ER expression or PR expression between RPE and P-RE were defined as Group 4. The median age of diagnosis for the samples in Group 3 was 57 years (range 31–74), and the median age of diagnosis for the samples in Group 4 was 55.5 years (range 47–77 years). Between Group 3 and Group 4, there were no significant differences in diagnostic age, pathological type, grade, FIGO stage, ER status, PR status, lymph node status, lymphatic vascular infiltration (LVSI), myometrium infiltration (MI), BMI or chemo/radiation therapy. Detailed data are summarized in Table 3.
Figure 3.
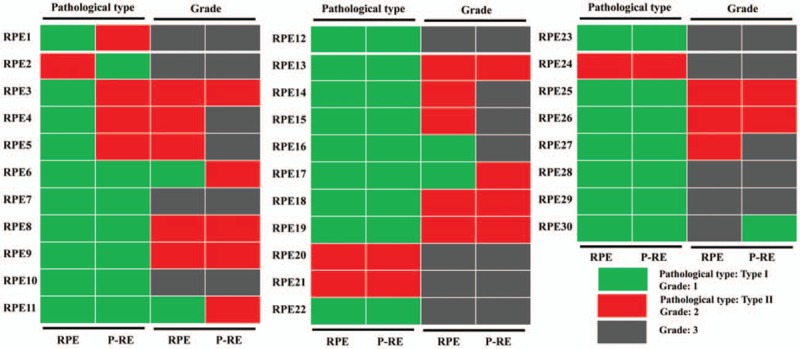
Clinical temporal heterogeneity between primary and the paired relapsed endometrial cancer. RPE: Primary endometrial cancer with relapse; P-RE: The paired relapsed endometrial cancer specimen.
Table 3.
Clinicopathologic characteristics of patients with endometrial cancer in Group 3 and Group 4, n (%).

Molecular spatial heterogeneity between primary and the paired metastatic EC
To further explore the potential molecular spatial heterogeneity of EC, a low-density microarray with 492 genes was used to detect the expression of two primary (PE60, PE61) and the paired (P60-M, P61-M) metastatic EC specimens [Figure 2]. A hierarchical cluster algorithm was used to sort tumor samples according to their DEGs. Figure 4A shows that two cases of primary EC and the paired metastases were grouped into two clusters: I and II. Cluster I contained two primary tumors (PE60, PE61), and Cluster II contained the paired two metastatic foci (P60-M, P61-M). DEGs between PE60 and P60-M showed that 46 genes exhibited significant differences including 34 down-regulated genes (STAT1, JUN, SPP1, TYMP, CDKN1A, PTGS2, MCM2, CXCR4, NMU, NID2, PPP2R1B, SERPINE1, SERPINA1, FGF18, LTF, GLRX, CEBPA, IGF2, BHLHB3, GDF15, BUB1, AGPAT2, CYP1B1, HBA2, APOE, CCL20, TFP12, IL8, CDC2, MAL, MMP12, GJB2, AREG, FOS) and 12 up-regulated genes (IGFBP1, CDH13, ITPR1, JAZF1, TCEAL1, ABCB1, FOXP1, DMD, WT1, SQSTM1, TPM1, DST) [Figure 4B]. DEGs between PE61 and P61-M showed that 37 genes exhibited significant differences including 25 down-regulated genes (RARRES1, IGF1, HSPB2, BUB1, FGF18, PTGS2, TFPI2, VASH1, CDKN1A, FOSB, HBA2, STAT1, LDLR, PPP2R1B, LUM, CDC2, LIMA1, CRABP2, IL8, FOLR1, TIMP1, COL1A2, MMP12, SERPINE1, SPP1) and 12 up-regulated genes (FOS, SFRP1, BAMBI, CDKN1B, TCEAL1, CYR61, JUN, RGS2, DST, GPNMB, ACTA2, FOXO1) [Figure 4C]. GO term and KEGG were subsequently carried out to explore the function of these DEGs. The top 30 enriched GO term enrichment analysis revealed that the significant differences in GO-biological process analysis of PE60 vs. P60-M, PE61 vs. P61-M were mainly enriched in response to chemical, cell proliferation, cell migration, response to hormone, etc, [Figure 4C-i and 4C-ii]. The top 30 KEGG-pathway analysis of PE60 vs. P60-M, PE61 vs. P61-M was mainly enriched in pathways in cancer, PI3K-Akt signaling pathway, p53 signaling pathway, etc (data not shown). The top 30 KEGG-disease analysis of PE60 vs. P60-M, PE61 vs. P61-M was mainly enriched in pathways in cancers, cancers of the urinary system and male genital organs, cervical cancer and so on (data not shown).
Figure 4.

Molecular heterogeneity between the two primary and the paired metastatic EC specimens. (A) Cluster map of DEGs in the two primary (PE60, PE61) and the paired metastatic EC specimens (P60-M, P61-M). (B) DEGs between PE60 and P60-M, PE61 and P61-M. (C) The top 30 enriched GO-biological process terms. (C-i) Significant Go terms between PE60 and P60-M. (C-ii) Significant Go terms between PE61 and P61-M. Gene number: number of target genes in each term or pathway. Rich factor: the ratio of the number of target genes divided by the number of all the genes in each term or pathway. EC: Endometrial cancer; DEGs: Differentially expressed genes; P-RE: The paired relapsed endometrial cancer specimen.
Molecular temporal heterogeneity between primary and the paired relapsed EC
To explore the potential molecular temporal heterogeneity of EC, RNA-seq was used to detect the expression of two primary (RPE3, RPE11) and the paired (P3-RE, P11-RE) relapsed EC specimens [Figure 3]. A hierarchical cluster algorithm was used to sort tumor samples according to their DEGs. Figure 5A shows that two cases of primary EC and the paired relapsed EC were grouped into two clusters: I and II. Cluster I contained one relapsed tumor (P3-RE), of which the pathological type was endometrial serous carcinoma (SA). Cluster II contained the paired two primary specimens and one relapsed specimen (RPE3, P11-RE, and RPE11), of which the pathological type was EEA. DEGs between RPE3 and P3-RE showed that 1680 genes exhibited significantly differently, including 970 down-regulated genes and 710 up-regulated genes [Figure 5B]. DEGs between RPE11 and P11-RE showed that 1408 genes exhibited significantly differently, including 611 down-regulated genes and 797 up-regulated genes [Figure 5B]. The top 20 in GO-biological process analysis of RPE3 vs. P3-RE, RPE11 vs. P11-RE, were mainly enriched in cell development, extracellular matrix organization, cell differentiation, etc [Figure 5C-i and 5C-ii]. The top 20 enriched KEGG term enrichment analysis revealed that the significant differences in KEGG-pathway analysis of RPE3 vs. P3-RE, RPE11 vs. P11-RE were mainly enriched in protein digestion and absorption, PI3K-Akt signaling pathway, etc (data not shown). The top 20 enriched KEGG-term enrichment analysis revealed that the significant difference in KEGG-disease analysis of RPE3 vs. P3-RE, RPE11 vs. P11-RE were mainly enriched in skeletal diseases, cancers of the urinary system and male genital organs, etc (data not shown). Protein-interaction analysis of RPE3 vs. P3-RE showed that CDH1, BMP2, COL1A1, IGF1, COL2A1, and ESR1 may play core roles in the biological process of EC relapse [Figure 6A]. The hypermethylation of CDH1 promoter was associated with not only clinicopathological progress of EC but also with the overall 5-year clinical survival rate.[24] BMP2 induces growth suppression and enhances chemosensitivity of human colon cancer cells.[25] COL1A1 were identified as candidate prognostic factors in gastric cancer.[26] Up-regulation of IGF1 in the endometrium may link endometrial cancer.[27] Highly expressed COL2A1 was associated with delayed time-to-recurrence for high-grade serous ovarian cancer (HGSOC).[28] The single-nucleotide polymorphisms of ESR1 was in relation to EC risk and survival.[29] Protein-interaction analysis of RPE11 vs. P11-RE showed that ubiquitin C (UBC) may play very important roles in the biological process of EC relapse [Figure 6B]. UBC had great diagnostic value for the detection and prognosis of bladder cancer.[30,31] The results showed that there was molecular temporal heterogeneity between primary and the paired relapsed EC.
Figure 5.
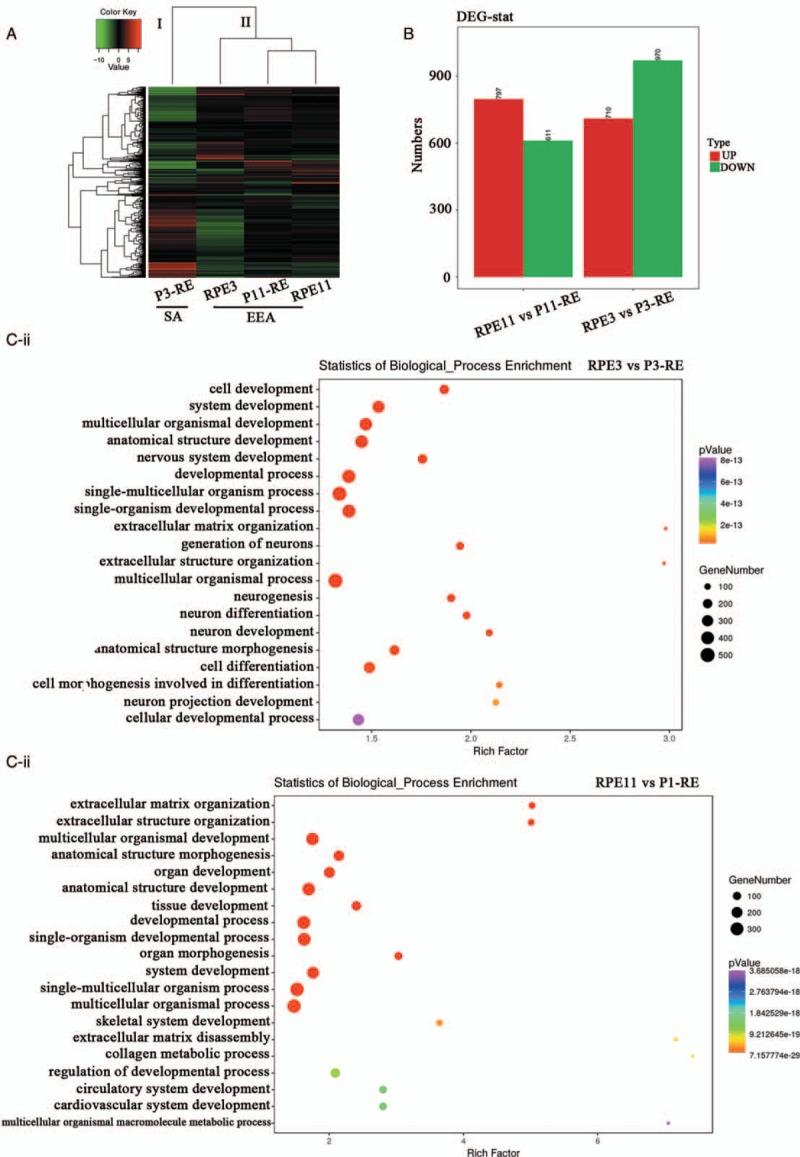
Molecular heterogeneity between the two primary and the paired relapsed EC specimens. (A) Cluster map of DEGs in the two primary (RPE3, RPE11) and the paired relapsed EC specimens (P3-RE, P11-RE). (B) DEGs of RPE3 vs. P3-RE, RPE11 vs. P11-RE. (C) The top 20 enriched GO-biological process terms. (C-i) Significant Go terms between RPE3 and P3-RE. (C-ii) Significant Go terms between RPE11 and P11-RE. Gene number: number of target genes in each term or pathway. Rich factor: the ratio of the number of target genes divided by the number of all the genes in each term or pathway. EC: Endometrial cancer; DEGs: Differentially expressed genes; P-RE: The paired relapsed endometrial cancer specimen.
Figure 6.
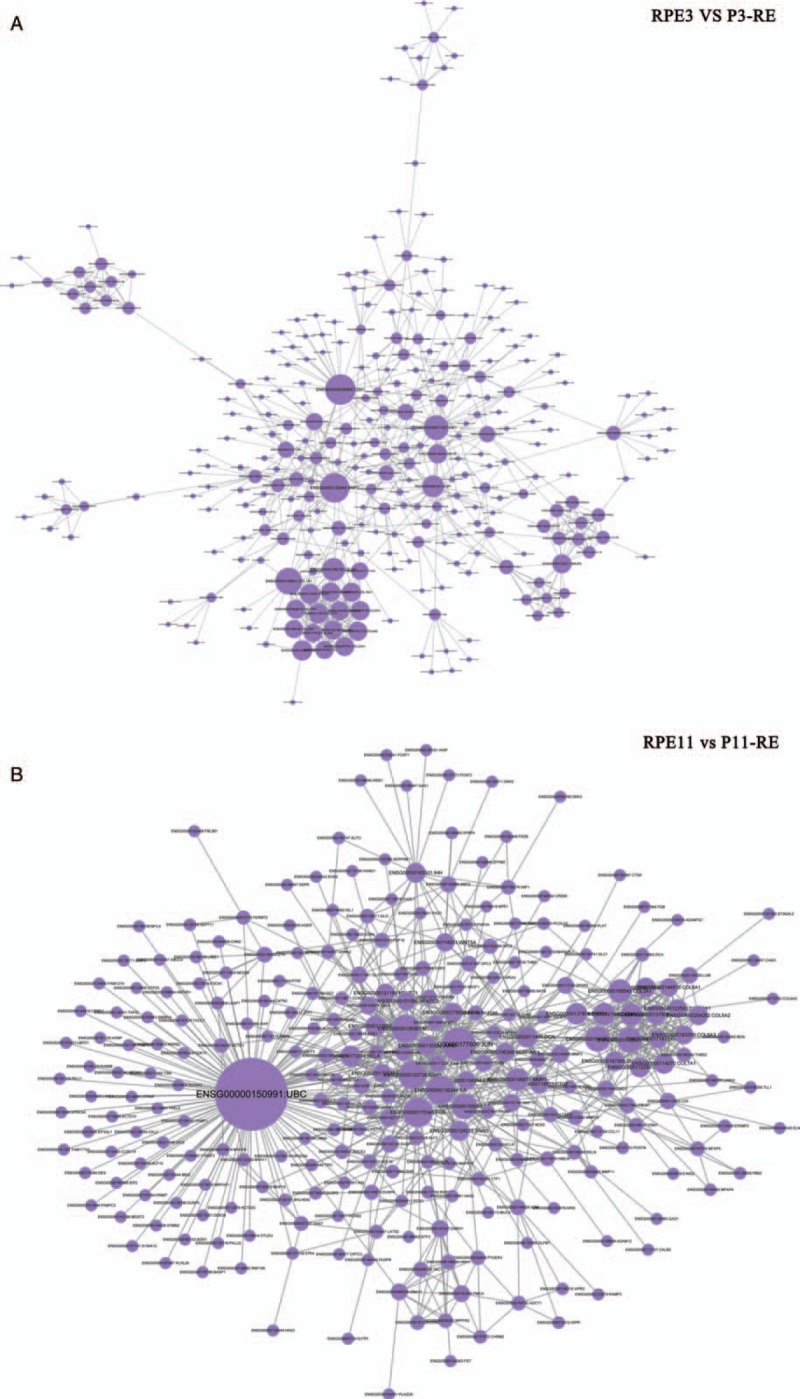
Protein-interaction analysis in EC. (A) Protein-interaction analysis of RPE3 vs. P3-RE. (B) Protein-interaction analysis of RPE11 vs. P11-RE. EC: Endometrial cancer; RPE: Primary endometrial cancer specimen without relapse.
Discussion
Tumor heterogeneity included inter-tumor heterogeneity and intra-tumor heterogeneity, and was presumed to be the main reason, based on a single-biopsy personalized treatment failure, and could have also disturbed pathologic evaluation and diagnosis.[32] Studies have revealed that heterogeneity may foster tumor evolution and adaptation and hinder personalized-medicine strategies.[32,33] Human cancers display substantial intra-tumor heterogeneity in cellular morphology, genetic variation and gene expression.[14,34–36] Heterogeneity degree itself might serve as a clinically valid molecular marker.[15,16] Therefore, it is of great clinical value to explore the intra-tumor heterogeneity based on clinical features and gene expression profiles for EC.
During the pathogenesis of EC, spatiotemporal heterogeneity of intra-tumor could lead to underestimation of the tumor genomic landscape portrayed from tumor-biopsy samples, and then may present major challenges to personalized-medicine and biomarker development.[35] Data from Runowicz et al[36] supported the concept of tumor cell heterogeneity for steroid hormone receptors in EC. Our result showed that there were discrepancies in pathological type, grade, ER status, and PR status between Primary EC and the paired metastases or the relapsed samples [Figures 2 and 3]. Clinical data in our study revealed that spatiotemporal heterogeneity existed in EC, which may have exposed the complexity of diagnosis and therapeutics in EC. Our study, in Table 2, also shows that there were significant differences in FIGO stage and lymph node status between primary ECs with clinical heterogeneity and those without clinical heterogeneity, revealing that for these patients with EC with early stage cancer or those with positive lymph node status, heterogeneity should be especially considered.
Gibson et al[10] demonstrated extensive genetic heterogeneity between primary EC and the paired metastatic lesions. Our results showed that cluster analysis sorts EC samples based on progression type of lesion or their pathological type [Figures 4A and 5A], indicating the molecular characteristics between primary EC specimens and the paired metastatic or relapsed patients were different. There were DEG profiles between primary EC and the paired metastases or the relapsed samples, accompanied by different functions and pathways [Figures 4B, 4C, 5B, and 5C]. All these results showed that there was extensive molecular spatiotemporal heterogeneity between primary EC, and the paired metastatic or relapsed sites.
Chemotherapy is an important adjuvant therapy for patients with EC, but chemotherapy resistance is one of the reasons for the failure of clinical EC therapy.[1,37–39] At present, there are many mechanisms of drug resistance, including gene heterogeneity, cell growth heterogeneity, and cell growth repair.[40,41] Previous results showed that there were significant differences in gene expression and phenotypic characteristics between the multiple passages of tumor cell lines and primary tumor cells.[10,42,43] Tumor heterogeneity, associated with heterogeneous protein function, may foster tumor adaptation and therapeutic failure through Darwinian selection,[35] revealing that tumor heterogeneity might affect the response to treatment. During the course of cancer chemotherapy, drug resistance and side effects were the main limitations.
Our results showed that there were DEG profiles between primary EC and the paired metastases or the relapsed samples. Therefore, genetic heterogeneity and cell growth heterogeneity should be considered in clinical chemotherapy.
Paclitaxel combined with carboplatin (Platinum) is the first-line chemotherapy regimen for patients with EC. However, due to the intra-tumor heterogeneity of EC cells, there was a significant difference in the reactivity and efficacy of chemotherapy. Whether according to the EC tissue and cell heterogeneity, different types of patients with EC and the same tissue type of patients with EC, different chemotherapeutic regimens and chemotherapeutic methods may be used to improve the curative effect, which becomes the focus of attention of clinicians. Sequential chemotherapy is the sequential application of non-cross-resistant regimens in accordance with the Norton-Simon hypothesis,[44,45] in which the specific way of therapeutic regimen is to apply several cycles of the optimum dose of regimens A first, and then give several cycles of the optimal dose of regimens B. The most suitable regimens may be treated with a single drug or drug combination regimens, which aims to improve the efficacy of chemotherapy and reduce side effects.[44,45] Sequential chemotherapy has been used as the first-line chemotherapy regimen for gestational trophoblastic neoplasia for many years with excellent therapeutic results,[46] has been applied to other human tumors, such as breast cancer, lung cancer, and ovarian cancer[47,48] and to a certain extent, showed better curative effect than conventional combined chemotherapy. A phase II study conducted by Mäenpää et al[48] also showed that sequential gemcitabine-carboplatin followed by paclitaxel-carboplatin was feasible in the first-line treatment of advanced ovarian cancer. Recent studies of sequential chemotherapy also showed that the efficacy of sequential chemotherapy was better than traditional chemotherapy treatment, and the side effects could be acceptable.[49,50] In view of intra-tumor heterogeneity of EC, sequential chemotherapy may have certain advantages in the treatment of EC, and whether it could become the clinical application chemotherapy regimen for EC needs further verification.
In conclusion, clinical and molecular data showed that spatiotemporal heterogeneity existed in EC. Owing to intra-tumor heterogeneity of EC, sequential chemotherapy and individualized treatment may be adopted in the clinical tumor chemotherapy model, which could reduce the drug resistance, improve the curative effect, and reduce the side effects. In the pathological diagnosis and follow-up of the tumor, heterogeneity should also be considered.
Funding
This work was supported by grants from the National Key R&D Program of China (Nos. 2016YFC1303100, 2016YFC1303103), the National Natural Science Foundation of China (Nos. 81502237, 81874108, 81672571, and 81802607), National Key Technology Research and Development Program of the Ministry of Science and Technology of China (No. 2015BAI13B06), and Basic Research Project of Peking University (No. BMU2018JC005).
Conflicts of interest
None.
Footnotes
How to cite this article: Yin FF, Zhao LJ, Ji XY, Duan N, Wang YK, Zhou JY, Wei LH, He XJ, Wang JL, Li XP. Intra-tumor heterogeneity for endometrial cancer and its clinical significance. Chin Med J 2019;00:00–00. doi: 10.1097/CM9.0000000000000286
References
- 1.Morice P, Leary A, Creutzberg C, Abu-Rustum N, Darai E. Endometrial cancer. Lancet 2016; 387:1094–1108. doi: 10.1016/s0140-6736(15)00130-0. [DOI] [PubMed] [Google Scholar]
- 2.Piulats JM, Guerra E, Gil-Martin M, Roman-Canal B, Gatius S, Sanz-Pamplona R, et al. Molecular approaches for classifying endometrial carcinoma. Gynecol Oncol 2017; 145:200–207. doi: 10.1016/j.ygyno.2016.12.015. [DOI] [PubMed] [Google Scholar]
- 3.Bendifallah S, Ouldamer L, Lavoue V, Canlorbe G, Raimond E, Coutant C, et al. Patterns of recurrence and outcomes in surgically treated women with endometrial cancer according to ESMO-ESGO-ESTRO Consensus Conference risk groups: Results from the FRANCOGYN study Group. Gynecol Oncol 2017; 144:107–112. doi: 10.1016/j.ygyno.2016.10.025. [DOI] [PubMed] [Google Scholar]
- 4.Getz G, Gabriel SB, Cibulskis K, Lander E, Sivachenko A, Sougnez C, et al. Integrated genomic characterization of endometrial carcinoma. Nature 2013; 497:67–73. doi: 10.1038/nature12113. [DOI] [PMC free article] [PubMed] [Google Scholar]
- 5.Marnitz S, Kohler C. Current therapy of patients with endometrial carcinoma. A critical review. Strahlenther Onkol 2012; 188:12–20. doi: 10.1007/s00066-011-0004-0. [DOI] [PubMed] [Google Scholar]
- 6.Wright JD, Medel NIB, Sehouli J, Fujiwara K, Herzog TJ. Contemporary management of endometrial cancer. Lancet 2012; 379:1352–1360. doi: 10.1016/s0140-6736 (12)60442-5. [DOI] [PubMed] [Google Scholar]
- 7.Gerlinger M, Rowan AJ, Horswell S, Math M, Larkin J, Endesfelder D, et al. Intratumor heterogeneity and branched evolution revealed by multiregion sequencing. N Engl J Med 2012; 366:883–892. doi: 10.1056/NEJMoa1113205. [DOI] [PMC free article] [PubMed] [Google Scholar]
- 8.Lee JH, Song SY, Kim MS, Yoo NJ, Lee SH. Intratumoral heterogeneity of frameshift mutations of GLI1 encoding a hedgehog signaling protein in colorectal cancers. Pathol Oncol Res 2018; 24:477–481. doi: 10.1007/s12253-017-0272-9. [DOI] [PubMed] [Google Scholar]
- 9.Welch HG. The heterogeneity of cancer. Breast Cancer Res Treat 2018; 169:207–208. doi: 10.1007/s10549-018-4691-4. [DOI] [PubMed] [Google Scholar]
- 10.Gibson WJ, Hoivik EA, Halle MK, Taylor-Weiner A, Cherniack AD, Berg A, et al. The genomic landscape and evolution of endometrial carcinoma progression and abdominopelvic metastasis. Nat Genet 2016; 48:848–855. doi: 10.1038/ng.3602. [DOI] [PMC free article] [PubMed] [Google Scholar]
- 11.Perou CM, Sorlie T, Eisen MB, van de Rijn M, Jeffrey SS, Rees CA, et al. Molecular portraits of human breast tumours. Nature 2000; 406:747–752. doi: 10.1038/35021093. [DOI] [PubMed] [Google Scholar]
- 12.Anichini A, Tassi E, Grazia G, Mortarini R. The non-small cell lung cancer immune landscape: emerging complexity, prognostic relevance and prospective significance in the context of immunotherapy. Cancer Immunol Immunother 2018; 67:1011–1022. doi: 10.1007/s00262-018-2147-7. [DOI] [PMC free article] [PubMed] [Google Scholar]
- 13.Wangsa D, Braun R, Schiefer M, Gertz EM, Bronder D, Quintanilla I, et al. The evolution of single cell-derived colorectal cancer cell lines is dominated by the continued selection of tumor specific genomic imbalances, despite random chromosomal instability. Carcinogenesis 2018; Epub ahead of print. doi: 10.1093/carcin/bgy068. [DOI] [PMC free article] [PubMed] [Google Scholar]
- 14.Ye XS, Yu C, Aggarwal A, Reinhard C. Genomic alterations and molecular subtypes of gastric cancers in Asians. Chin J Cancer 2016; 35:42.doi: 10.1186/s40880-016-0106-2. [DOI] [PMC free article] [PubMed] [Google Scholar]
- 15.Maley CC, Galipeau PC, Finley JC, Wongsurawat VJ, Li XH, Sanchez CA, et al. Genetic clonal diversity predicts progression to esophageal adenocarcinoma. Nat Genet 2006; 38:468–473. doi: 10.1038/ng1768. [DOI] [PubMed] [Google Scholar]
- 16.Gerashchenko TS, Denisov EV, Litviakov NV, Zavyalova MV, Vtorushin SV, Tsyganov MM, et al. Intratumor heterogeneity: nature and biological significance. Biochemistry (Mosc) 2013; 78:1201–1215. doi: 10.1134/s0006297913110011. [DOI] [PubMed] [Google Scholar]
- 17.Chen Y, Yao Y, Zhang L, Li X, Wang Y, Zhao L, et al. cDNA microarray analysis and immunohistochemistry reveal a distinct molecular phenotype in serous endometrial cancer compared to endometrioid endometrial cancer. Exp Mol Pathol 2011; 91:373–384. doi: 10.1016/j.yexmp.2011.04.005. [DOI] [PubMed] [Google Scholar]
- 18.Yao Y, Chen Y, Wang Y, Li X, Wang J, Shen D, et al. Molecular classification of human endometrial cancer based on gene expression profiles from specialized microarrays. Int J Gynaecol Obstet 2010; 110:125–129. doi: 10.1016/j.ijgo.2010.03.020. [DOI] [PubMed] [Google Scholar]
- 19.Kwon SG, Hwang JH, Park DH, Kim TW, Kang DG, Kang KH, et al. Identification of differentially expressed genes associated with litter size in berkshire pig placenta. PLoS One 2016; 11:e0153311.doi: 10.1371/journal.pone.0153311. [DOI] [PMC free article] [PubMed] [Google Scholar]
- 20.Zaino RJ. FIGO staging of endometrial adenocarcinoma: a critical review and proposal. Int J Gynecol Pathol 2009; 28:1–9. doi: 10.1097/PGP.0b013e3181846c6d. [DOI] [PubMed] [Google Scholar]
- 21.Eisen MB, Spellman PT, Brown PO, Botstein D. Cluster analysis and display of genome-wide expression patterns. Proc Natl Acad Sci U S A 1998; 95:14863–14868. doi: 10.1073/pnas.95.25.14863. [DOI] [PMC free article] [PubMed] [Google Scholar]
- 22.Liu LC, Si LF, Meng X, Luo LX. Comparative transcriptomic analysis reveals novel genes and regulatory mechanisms of Tetragenococcus halophilus in response to salt stress. J Ind Microbiol Biotechnol 2015; 42:601–616. doi: 10.1007/s10295-014-1579-0. [DOI] [PubMed] [Google Scholar]
- 23.Trapnell C, Hendrickson DG, Sauvageau M, Goff L, Rinn JL, Pachter L. Differential analysis of gene regulation at transcript resolution with RNA-seq. Nat Biotechnol 2013; 31:46–50. doi: 10.1038/nbt.2450. [DOI] [PMC free article] [PubMed] [Google Scholar]
- 24.Yi TZ, Guo J, Zhou L, Chen X, Mi RR, Qu QX, et al. Prognostic value of E-cadherin expression and CDH1 promoter methylation in patients with endometrial carcinoma. Cancer Invest 2011; 29:86–92. doi: 10.3109/07357907.2010.512603. [DOI] [PubMed] [Google Scholar]
- 25.Vishnubalaji R, Yue S, Alfayez M, Kassem M, Liu FF, Aldahmash A, et al. Bone morphogenetic protein 2 (BMP2) induces growth suppression and enhances chemosensitivity of human colon cancer cells. Cancer Cell Inter 2016; 16:77.doi: 10.1186/s12935-016-0355-9. [DOI] [PMC free article] [PubMed] [Google Scholar]
- 26.Li J, Ding Y, Li A. Identification of COL1A1 and COL1A2 as candidate prognostic factors in gastric cancer. World J Surg Oncol 2016; 14:297.doi: 10.1186/s12957-016-1056-5. [DOI] [PMC free article] [PubMed] [Google Scholar]
- 27.Shafiee MN, Seedhouse C, Mongan N, Chapman C, Deen S, Abu J, et al. Up-regulation of genes involved in the insulin signalling pathway (IGF1, PTEN and IGFBP1) in the endometrium may link polycystic ovarian syndrome and endometrial cancer. Mol Cell Endocrinol 2016; 424:94–101. doi: 10.1016/j.mce.2016.01.019. [DOI] [PubMed] [Google Scholar]
- 28.Ganapathi MK, Jones WD, Sehouli J, Michener CM, Braicu IE, Norris EJ, et al. Expression profile of COL2A1 and the pseudogene SLC6A10P predicts tumor recurrence in high-grade serous ovarian cancer. Int J Cancer 2016; 138:679–688. doi: 10.1002/ijc.29815. [DOI] [PubMed] [Google Scholar]
- 29.Einarsdottir K, Darabi H, Czene K, Li Y, Low YL, Li YQ, et al. Common genetic variability in ESR1 and EGF in relation to endometrial cancer risk and survival. Br J Cancer 2009; 100:1358–1364. doi: 10.1038/sj.bjc.6604984. [DOI] [PMC free article] [PubMed] [Google Scholar]
- 30.Sanchez-Carbayo M, Urrutia M, Hernandez-Cerceno ML, Gonzalez de Buitrago JM, Navajo JA. Cytokeratins (UBC and CYFRA 21-1) and nuclear matrix proteins (NMP22) as urine tumor markers in the diagnosis of bladder cancer [in Spanish]. Med Clin (Barc) 2000; 114:361–366. [DOI] [PubMed] [Google Scholar]
- 31.Jeong S, Park Y, Cho Y, Kim YR, Kim HS. Diagnostic values of urine CYFRA21-1, NMP22, UBC, and FDP for the detection of bladder cancer. Clin Chim Acta 2012; 414:93–100. doi: 10.1016/j.cca.2012.08.018. [DOI] [PubMed] [Google Scholar]
- 32.Supernat A, Lapinska-Szumczyk S, Majewska H, Gulczynski J, Biernat W, Wydra D, et al. Tumor heterogeneity at protein level as an independent prognostic factor in endometrial cancer. Transl Oncol 2014; 7:613–619. doi: 10.1016/j.tranon.2014.06.001. [DOI] [PMC free article] [PubMed] [Google Scholar]
- 33.Mota A, Colas E, Garcia-Sanz P, Campoy I, Rojo-Sebastian A, Gatius S, et al. Genetic analysis of uterine aspirates improves the diagnostic value and captures the intra-tumor heterogeneity of endometrial cancers. Mod Pathol 2017; 30:134–145. doi: 10.1038/modpathol.2016.143. [DOI] [PubMed] [Google Scholar]
- 34.Durrett R, Foo J, Leder K, Mayberry J, Michor F. Intratumor heterogeneity in evolutionary models of tumor progression. Genetics 2011; 188:461–477. doi: 10.1534/genetics.110.125724. [DOI] [PMC free article] [PubMed] [Google Scholar]
- 35.Gerlinger M, Rowan AJ, Horswell S, Larkin J, Endesfelder D, Gronroos E, et al. Intratumor heterogeneity and branched evolution revealed by multiregion sequencing. N Engl J Med 2012; 366:883–892. doi: 10.1056/NEJMoa1113205. [DOI] [PMC free article] [PubMed] [Google Scholar]
- 36.Runowicz CD, Nuchtern LM, Braunstein JD, Jones JG. Heterogeneity in hormone receptor status in primary and metastatic endometrial cancer. Gynecol Oncol 1990; 38:437–441. [DOI] [PubMed] [Google Scholar]
- 37.Moxley KM, McMeekin DS. Endometrial carcinoma: a review of chemotherapy, drug resistance, and the search for new agents. Oncologist 2010; 15:1026–1033. doi: 10.1634/theoncologist.2010-0087. [DOI] [PMC free article] [PubMed] [Google Scholar]
- 38.Chaudhry P, Asselin E. Resistance to chemotherapy and hormone therapy in endometrial cancer. Endocr-Relat Cancer 2009; 16:363–380. doi: 10.1677/erc-08-0266. [DOI] [PubMed] [Google Scholar]
- 39.Yang YN, Wang Y, Wang XG, Jiang SJ. Effects of trichostatin A and paclitaxel on apoptosis and mitochondrial membrane potential of human endometrial carcinoma ark2 cells. Chin J Cancer 2008; 27:816–821. [PubMed] [Google Scholar]
- 40.Cannataro VL, Gaffney SG, Stender C, Zhao ZM, Philips M, Greenstein AE, et al. Heterogeneity and mutation in KRAS and associated oncogenes: evaluating the potential for the evolution of resistance to targeting of KRAS G12C. Oncogene 2018; 37:2444–2455. doi: 10.1038/s41388-017-0105-z. [DOI] [PubMed] [Google Scholar]
- 41.Norouzi-Barough L, Sarookhani MR, Sharifi M, Moghbelinejad S, Jangjoo S, Salehi R. Molecular mechanisms of drug resistance in ovarian cancer. J Cell Physiol 2018; 233:4546–4562. doi: 10.1002/jcp.26289. [DOI] [PubMed] [Google Scholar]
- 42.Greenfield JP, Hoffman C, Boockvar JA. Fallibility of glioblastoma multiforme cell lines overcome by use of tumor-derived stem. Neurosurgery 2006; 59:N9. [Google Scholar]
- 43.de Velasco G, Wankowicz SA, Madison R, Ali SM, Norton C, Duquette A, et al. Targeted genomic landscape of metastases compared to primary tumours in clear cell metastatic renal cell carcinoma. Br J Cancer 2018; 118:1238–1242. doi: 10.1038/s41416-018-0064-3. [DOI] [PMC free article] [PubMed] [Google Scholar]
- 44.Norton L, Simon R. Tumor size, sensitivity to therapy, and design of treatment schedules. Cancer Treat Rep 1977; 61:1307–1317. [PubMed] [Google Scholar]
- 45.Norton L, Simon R. The Norton-Simon hypothesis revisited. Cancer Treat Rep 1986; 70:163–169. [PubMed] [Google Scholar]
- 46.Deng LY, Zhang J, Wu TX, Lawrie TA. Combination chemotherapy for primary treatment of high-risk gestational trophoblastic tumour. Cochrane Database Syst Rev 2013; CD005196.doi: 10.1002/14651858.CD005196.pub4. [DOI] [PMC free article] [PubMed] [Google Scholar]
- 47.Arca R, Ibarra J, Lerzo G, Mandachain M, Mickievicz E, Perez J, et al. Gemcitabine (GEM) plus oxaliplatin (OX) in patients (pts) with stage III/IV ovarian cancer following 3 cycles of carboplatin (CB) plus paclitaxel (PAC): preliminary report of a phase II study. J Clin Oncol 2004; 22:476S. [Google Scholar]
- 48.Mäenpää JU, Grenman SE, Jalkanen JT, Kuoppala TA, Leminen AO, Puistola US, et al. Sequential gemcitabine-carboplatin followed by paclitaxel-carboplatin in the first-line treatment of advanced ovarian cancer: a phase II study. Gynecol Oncol 2006; 101:114–119. doi: 10.1016/j.ygyno.2005.09.043. [DOI] [PubMed] [Google Scholar]
- 49.Mariani G, Galli G, Cavalieri S, Valagussa P, Bianchi G, Capri G, et al. Long term results of ASTER study, a single Institution phase II trial of sequential chemotherapy (CT) for operable breast cancer (BC). Ann Oncol 2017; 28:1. [Google Scholar]
- 50.Koynova R, Antonova B, Sezanova B, Tenchov B. Beneficial effect of sequential chemotherapy treatments of lung cancer patients revealed by calorimetric monitoring of blood plasma proteome denaturation. Thermochim Acta 2018; 659:1–7. doi: 10.1016/j.tca.2017.11.001. [Google Scholar]


