Abstract
The aim of this study was to check whether the sFlt-1/PIGF ratio, established as the biomarker for preeclampsia, reduces the false positive rate of late fetal growth restriction (FGR) detection by ultrasound biometry.
This was a prospective case-control study, conducted at one regional maternity hospital in Romania. Study participants included singleton pregnancy women for whom the estimated fetal weight (EFW) at 28 to 35 weeks was < 10 percentiles and as controls, pregnant women with EFW >10 percentiles. All pregnancies were dated in the first trimester by crown-rump-length. We also recorded maternal characteristics, pregnancy and neonatal outcomes.
The primary outcome measures were the relation between the sFlt-1/PIGF ratio and incidence of FGR. Secondary outcome was establishing a threshold for statistical significance of the marker and influence of other conditions (e.g., pre-eclampsia) on the accuracy of the marker in FGR prediction.
Included in the study were 37 pregnant women and 37 controls.
When we used ultrasound (US) biometry and maternal risk factors to estimate EFW <10 percentiles, the sensitivity was 44.4% with a specificity of 89% for an FPR (false positive result) of 10%. When we combined the US biometry and maternal risk factors with sFlt1/PIGF ratio, for a cut off of 38, the sensitivity was 84.21%, and the specificity was 84.31% for an FPR of 10%. The cut off value (36) did not change if we considered all cases of SGA, including those with associated preeclampsia or if we considered only FGR cases without associated preeclampsia.
When associated with maternal factors and US biometry, the sFlt1/PIGF ratio enhanced the sensitivity for detecting late FGR.
Keywords: fetal growth restriction, fetal hypotrophy, preeclampsia, ultrasound biometry
1. Introduction
Placenta insufficiency and its poor obstetrical outcomes are correlated with an imbalance between angiogenic and anti-angiogenic factors. The soluble fms-like tyrosine kinase 1 (sFlt-1) to placental growth factor (PlGF) ratio, also called “the preeclampsia (PE)” fraction, was consecrated as the biomarker for PE detection.[1]
The aim of the study was to determine whether the serum PE fraction can predict and confirm the suspicion of third-trimester fetal growth restriction (FGR) suggested by US measurements not related to PE and predict a poor outcome for these pregnancies.
2. Methods
This was a prospective, case-control study, carried out between 01.10.2017 and 01.05.2018, in a tertiary regional public hospital of Northeast Romania.
We included in the study pregnant women coming to our hospital for their third trimester ultrasound (between 28 + 0 weeks and 34 + 6 weeks). All patients underwent a third-trimester ultrasound scan with the estimation of fetal weight by measurement of bi-parietal diameter, head circumference, abdominal circumference, and femoral length, using Hadlock biometry curves.
We selected for the study singleton pregnant women with the estimated fetal weight at the 3rd-trimester US of <10 percentiles and as controls, pregnant women with estimated fetal weight between the 10th and the 90th percentile. The FGR definition was the one provided by ACOG: “According to the guideline of the American College of Obstetricians and Gynecologists, a fetus with IUGR is a fetus with an estimated weight of less than the 10th percentile for gestational age.”[2]
Exclusion criteria were multiple pregnancies and pregnancies that were not dated in the first trimester by CRL (crown rump length). We did not exclude patients with 1st trimester evaluation done in other centers. Written consent was obtained from women agreeing to participate in the study, which was approved by the ethics committee of the hospital.
Blood samples for sFlt-1/PIGF assessment were obtained from all the patients that were included in the study (in FGR group or controls).
Other data we recorded were as follows:
-
1.
Maternal characteristics: maternal age, racial origin, maternal weight and height with BMI (body mass index) calculation, method of conception (spontaneous, assisted conception requiring ovulation drugs, IVF), cigarette smoking during pregnancy (yes/no), patient's medical history (chronic hypertension (yes/no), diabetes mellitus (yes/no), acquired or inherited thrombophilia, systemic lupus erythematosus, or antiphospholipid syndrome.
-
2.
Obstetrical history: gestation, parity, previous pregnancy with PE (yes/no), UAP (uterine apoplexy) (yes/no), previous children with FGR (yes/no).
-
3.
First trimester: beta HCG and PAPPA1 values (if available)
-
4.
Ultrasound data:
first trimester dating of pregnancy by crown rump length (CRL);
2nd- and 3rd-trimester biometry (BPD, HC, AC, FL) using Hadlock curves, allowing the calculation of fetal weight and the weight percentile;
Doppler parameters: uterine artery mean pulsatility index (UtAPI) (PI), and the presence of the notch, umbilical artery pulsatility index PI (UAPI), median cerebral artery pulsatility index (MCAPI);
amniotic fluid index;
placenta characteristics.
Pregnancy outcome was evaluated for gestational age at admission, gestational age at delivery, occurrence of maternal complications (severe PE, eclampsia, or HELLP [hemolysis, elevated liver enzymes, low platelet count] syndrome, uterine apoplexy). PE was defined as gestational hypertension (defined as systolic blood pressure of at least 140 mm Hg and/or a diastolic blood pressure of at least 90 mm Hg on at least two occasions at least 6 hours apart after the 20th week of gestation in women known to be normotensive before pregnancy and before 20 weeks’ gestation) plus proteinuria (300 mg or more per 24-hour period). The rate of cesarean deliveries (CD) was reported for fetal distress before/during labor vs CD for other indications or vaginal delivery.
Neonatal outcome was evaluated according to neonatal weight and height, which allowed the calculation of Rohrer ponderal index and the classification in small for gestational age (SGA) or appropriate for gestational age (AGA), using Lubchenco Growth Curves and Fenton Growth Charts for premature infants,[3,4] and the following postnatal complications: stillbirth; 5-minute and 10-minute Apgar scores below 7; cord blood pH <7, admission to the neonatal intensive care unit (NICU)/number of days for NICU hospitalization; respiratory distress (severe [requiring intubation and mechanical ventilation], medium [requiring noninvasive respiratory support – CPAP] or mild [requiring supplemental oxygen administration]; intraventricular hemorrhage; necrotizing enterocolitis (NEC); hypoglycemia; hyperbilirubinemia; patent ductus arteriosus or foramen ovalae.
We measured the maternal serum PIGF and soluble fms-like tyrosine-kinase 1 (s-Flt-1) using Roche Elecsis Pintzcraft Germany kit with Cobas 6000 analyzer system, Cobas e-pack, method supported electrochemiluminescence/magnetic particle. Blood samples could clot between 15°C and 22°C for 30 minutes. Then, the samples were centrifuged for 15 minutes at 300 g. The serum was collected and stored at −20°C for up to 4 days, and then it was stored at −70°C.
We compared the values of PIGF, sFLT-1, and the sFLT1/PIGF ratio of participants and controls.
Statistical data were analyzed with IBM SPSS statistical software, version 2018. The types of data we analyzed required the following tests:
for the real, numerical data of the continuous type, we used the t test, and the Mann Whitney U test, respectively,
for categorical data, we used the chi-square test and in special cases, Fisher approximation. P < .05 was considered statistically significant.
For the ROC curve, we determined the cutoff using the minimal distance for optimization.
The size of the study group and controls was determined by the number of cases included in the given period, and the matching 1:1 with controls according to the inclusion and exclusion criteria.
The study was approved by the Ethics Committee of Cuza Voda University Hospital, Iasi- Romania. The informed consents were signed by all the patients from the study and control groups.
3. Results
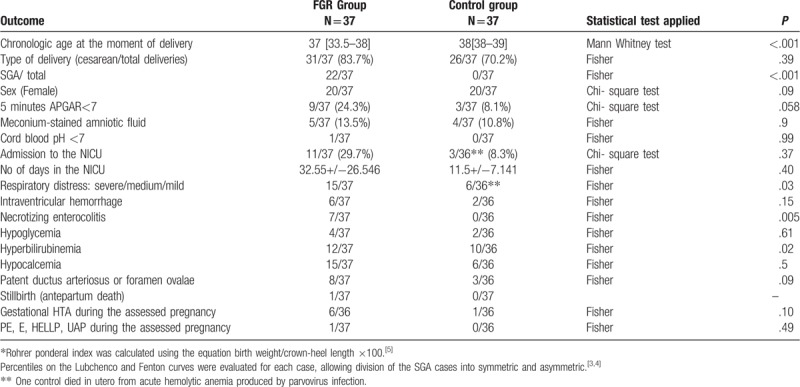
Between 01.10.2017 and 01.01.2018, we enrolled 37 participants and 37 controls. The maternal characteristics, the US and biochemical marker results as well as the neonatal outcomes are presented in Tables 1–3.
Table 1.
Characteristics of the study population of pregnant women from the FGR group vs control group.
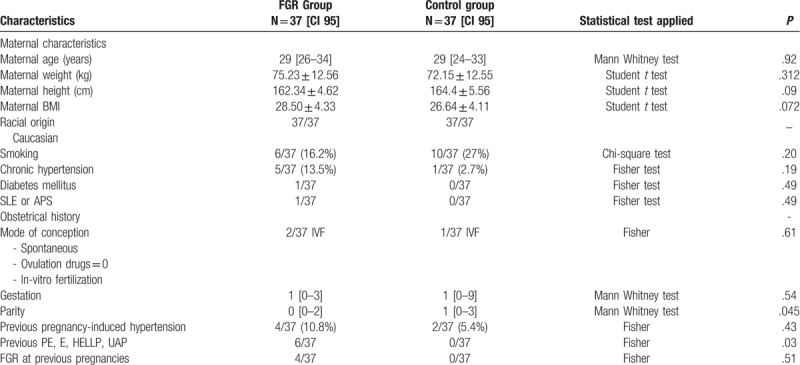
Table 3.
Perinatal and neonatal outcomes of FGR group and controls.
The characteristics of the study population are presented in Table 1.
No significant differences were found between participants and controls for maternal age, maternal BMI, gestational age at the moment of recruitment, racial origin (all subjects being Caucasians), smoking and alcohol consumption (no alcohol users among participants or controls), personal history of chronic hypertension, diabetes mellitus, SLE or APS, and for the obstetrical history data mode of conception (spontaneous or in-vitro fertilization IVF), gestations, parity, and previous hypertension induced by pregnancy or preeclampsia and its complications, eclampsia, HELLP syndrome, and uterine apoplexy.
Data are presented as median (interquartile range), mean ± standard deviation, or n (%). Comparisons between outcome groups were calculated using chi-square test or Fisher exact test for categorical variables and Mann–Whitney U test or Student t test for continuous variables. P < .005 was considered statistically significant.
APS = antiphospholipid syndrome; GA = gestational age; SLE = systemic lupus erythematosus; PE = preeclampsia, E = eclampsia, HELLP = hemolysis, elevated liver enzymes, low platelet count; UAP = uterine apoplexy;
Table 2 shows ultrasound pregnancy data at the moment of recruitment: estimation of biometrical age, weight percentile, pulsatility index (PI) of the uterine arteries and the presence/absence of the notch, PI for umbilical artery, cerebral artery and the cerebro-placental index value, amniotic fluid index (AFI); CTG data including abnormal variability and the presence of decelerations; some first trimester biochemical marker values (PAPPA1 (MoM) and beta HCG (MoM) (when available); as well as the angiogenic marker values (sFlt-1, PIGF) and the sFlt-1/ PIGF ratio.
Table 2.
Ultrasound (US) data at the moment of recruitment and CTG data and biochemical markers of the assessed pregnancies.
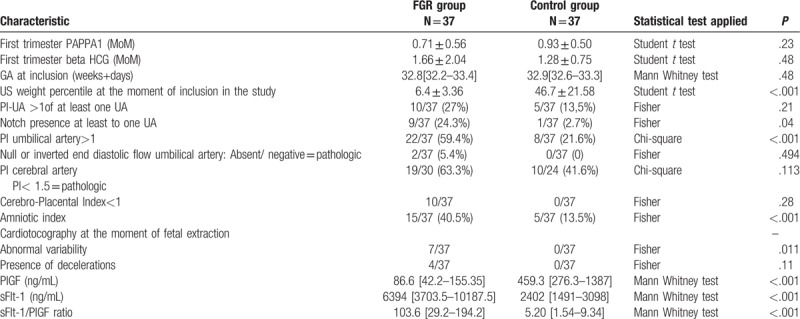
Average PIGF level among pregnant women with FGR was significantly lower than that of the control group (86.6 and 459.3, P < .001).
The average sFlt1 levels in pregnancies complicated by FGR was higher than among normal pregnancies (6394 and 2402, P < .001).
The sFlt-1/PIGF ratio among FGR vs normal pregnancies was (103.6 vs 5.20), significantly higher (P < .001).
The ROC curve (Fig. 1) was calculated splitting the enrolled cases into SGA (pathological condition) and AGA/LGA (normal condition), according to the neonatal evaluation (using the neonatal growth curves Lubcenco and Fenton for preterm newborns).[3,4] We considered the sFlt-1/PIGF ratio as a variable.
Figure 1.
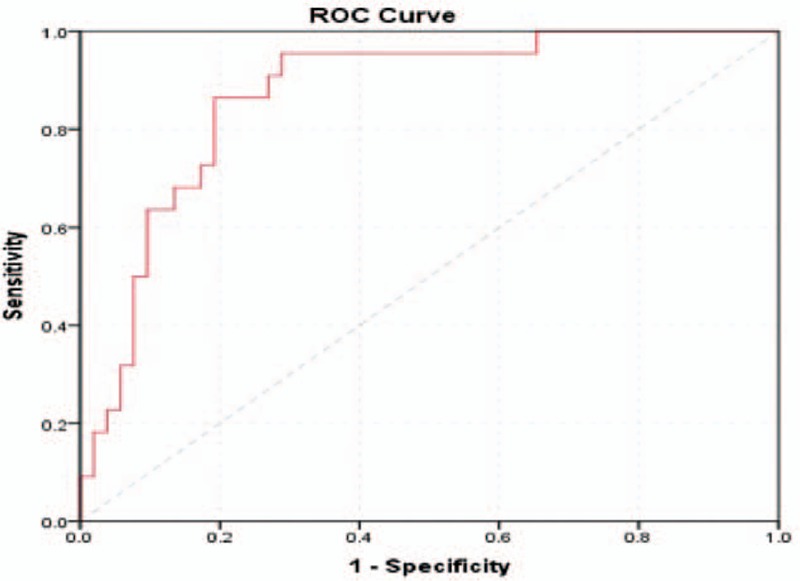
Receiver-operating characteristics curve calculating the cutoff value for the sFLT-1/PIGF ratio in the detection of SGA including all cases and controls.
We considered, this time, all patients enrolled (including those who developed PE and its complications during the current pregnancy).
We found a cutoff value of 36.065 with a sensitivity of 86.4% and a specificity of 80.8%, very close to the cutoff for preeclampsia found by Zeisler (38)[1]
Because preeclampsia is associated with high values of the sFlt1/PIGF ratio 1, we recalculated the ROC curve after the exclusion of patients who developed PE and its complications (pre-eclampsia, HELLP syndrome, uterine apoplexy), not to bias the results.
The new ROC curve is presented in Figure 2, after the exclusion of 5 participants, 4 with preeclampsia and one with uterine apoplexy. No participants with eclampsia or HELLP syndrome were enrolled in our study.
Figure 2.
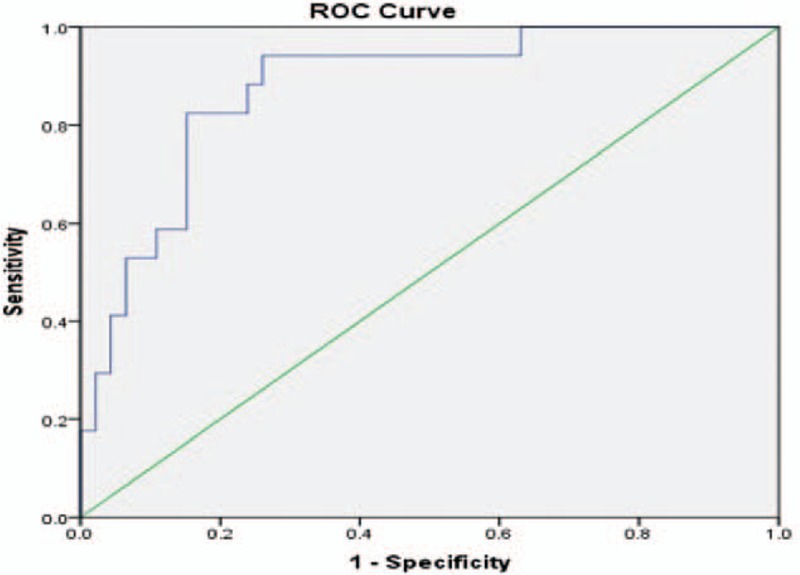
Receiver-operating characteristics curve calculating the cutoff value for the sFLT-1/PIGF ratio in the detection of SGA when PE and its complications (pre-eclampsia, HELLP syndrome, AUP) (n = 5) are excluded.
In this case, the cutoff value did not change (36.065), but a lower sensitivity (82.4%) and a higher specificity (84.8%) were registered.
Figure 3 represents the flow chart with the outcome of pregnancies included in the study, according to the sFlt-1/PIGF ratio, when we considered the cutoff value of 38.
Figure 3.
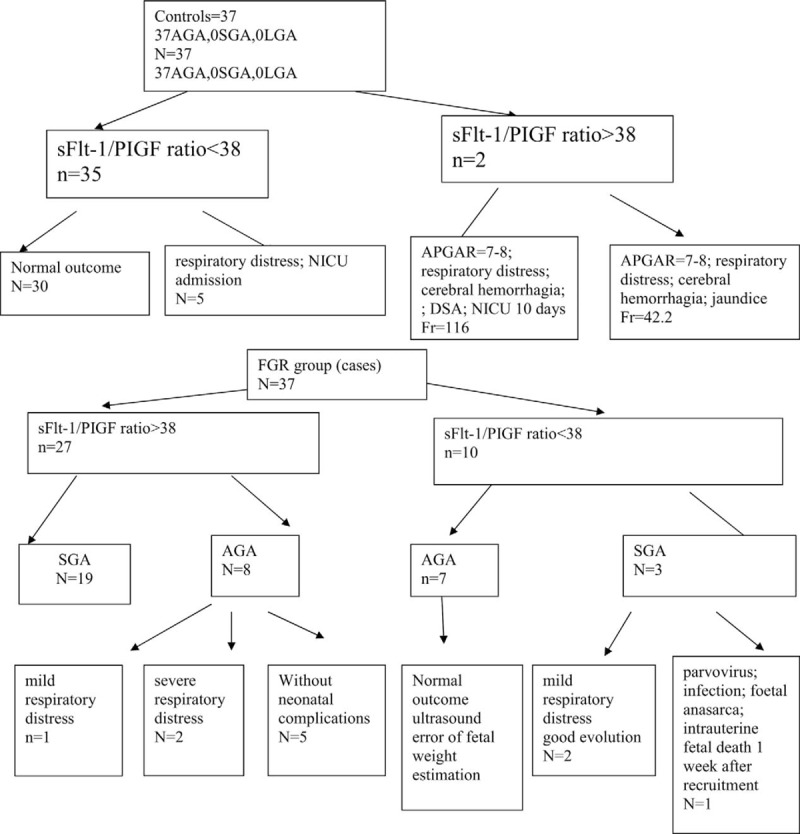
Flow chart representing the outcome of pregnancies in participants enrolled, according to sFlt-1/PIGF ratio, for a cutoff of 38.
When we used ultrasound biometry alone for the EFW<10th percentile, the sensitivity was 44.4% with a specificity of 89% for a false-positive rate of 10%.
When we combined the ultrasound EFW<10th percentile with the sFLT-1/PIGF ratio >38, the sensitivity became 84.21% with a specificity of 84.31% for an FPR of 10%.
4. Discussion
4.1. What is already known on this topic?
FGR is a condition responsible for many poor neonatal outcomes, requiring hospitalization in a neonatal intensive care unit (NICU). During pregnancy, FGR status is suspected initially by serial symphysis-fundal height measurements. But the performance of this screening method is poor, with less than a 30% detection rate.[6,7]
A meta-analysis performed by Goto[8] to evaluate the use of symphysis-fundal height for prediction of low birthweight and small for gestational age found a sensitivity to predict low birth weight of 0.72 with a specificity of 0.73 and a sensitivity to predict small for gestation age of 0.73 for a specificity of 0.87, suggesting that symphysis-fundal height is unsuitable for primary screening of low birthweight or small for gestational age.
The next step was to estimate fetal weight by ultrasound biometry, measuring HC, BPD, CA, and LF, using reference curves, but this method also presents errors.
Figueras et al[9] published a metanalysis of 13 series of routine ultrasound screenings that were performed at a mean gestational age >32 weeks. Articles published since 2012, including 22,927 pregnancies with 1776 SGA babies, (SGA defined as BW<10th percentile or <5th percentile), and found an area under the curve of 88.2% (95%CI, 85.4–91%). In other words, for a false-positive rate of 10%, the resulting detection rate was 70% (95% CI, 62–78%).
Another promising approach is to add serum biomarkers when the suspicion of FGR is raised by third trimester scan biometry and maternal factors.
The first biochemical markers analyzed were those performed for other indications, such as fetal aneuploidies.
Low serum concentrations of PAPP-A1 in the first or second trimester are associated with a high risk of FGR.[10,11]
The second trimester biomarkers for aneuploidies can also predict placentally related pregnancy complications. Thus, an elevated alfa fetoprotein >2MoM,[12–14] inhibin A ≥2MoM, uE3 (≤0.5MoM) are associated with high risk of SGA,[14] whereas the association of a high beta HCG with SGA is controversial. Some studies show a correlation,[13,15] whereas others do not report the same correlation.[14]
Other serum markers analyzed were angiogenic factors, such as PIGF, sFLT1, sFLT1/PIGF ratio, serum endoglin, PP13, and hormonal factors, such as ADAM12, hLP, and DLK.[16]
The reason for using angiogenic biomarkers is that placental insufficiency is related to impaired angiogenesis.
The practical utility of the angiogenic fraction, sFLT1/PIGF ratio, has already been demonstrated in preeclampsia screening. Zeisler et al, in the PROGNOSIS study, showed its predictive value for preeclampsia, finding a cutoff value of 38.[1] Many studies confirm the role of angiogenic fraction (sFlt-1/PIGF ratio) in the detection of preeclampsia,[17–19] some of them finding the same cutoff value of 38 as in our study.[18–20] Fewer studies have analyzed the role of placental angiogenic factors in predicting other poor pregnancy outcomes due to placental insufficiency, for example, uterine apoplexy,[20,21] fetal growth restriction[16,19,22–25] in utero fetal death,[22] early pregnancy loss,[26] and some cases of preterm delivery.[22]
Many studies suggest that adding angiogenic biomarkers to the routine third-trimester scan and maternal risk factors improves the detection rate of SGA.
Thus, Bakalis et al,[27] in a routine screening for delivery of SGA neonates by a combination of maternal characteristics, medical history (maternal factors) and EFW from ultrasound biometry performed at 30 to 34 weeks’ gestation, found a 10% false-positive rate (FPR), 80%, 87%, and 92% of SGA neonates delivered <5 weeks following assessment with a birth weight <10th, <5th, and <3rd percentiles, respectively; the respective detection rates for SGA neonates delivering ≥5 weeks following assessment were 53%, 58%, and 61%.
When adding an angiogenic biomarker at the previous screening, at a 10% false-positive rate, the prediction rate rises to 85%, 93%, and 92% in the detection of SGA neonates delivering <5 weeks following assessment with birthweight <10th, <5th and <3rd percentiles, respectively; the respective detection rates of combined screening for SGA neonates delivering ≥5 weeks following assessment were 57%, 64%, and 71%.[23]
4.2. The strength of the present study
Our study confirms the idea that by adding angiogenic biomarkers (sFLT1/PIGF ratio) to ultrasound biometry, we can increase the sensitivity of screening for late SGA. When we used ultrasound biometry alone for the estimation of fetal weight <10th percentile, the sensitivity was 44.4% with a specificity of 89% for a false-positive rate of 10%. When we combined the ultrasound EFW <10th percentile with the sFLT-1/PIGF ratio >38, the sensitivity became 84.21% with a specificity of 84.31% for an FPR of 10%.
Other studies that investigated the role of the sFlt1/PIGF ratio to identify the fetal growth restriction did not exclude the association of FGR with other pathologic outcomes connected to placental insufficiency, such as preeclampsia, eclampsia, HELLP syndrome, uterine apoplexy that can bias the results. Komwilaisak published such a study, arguing that “in daily practice, these conditions are frequently associated, so the study reflects the reality and its results could be generalizable”.[25]
Our study demonstrated that the sFlt1/PIGF ratio is a useful biochemical marker in identifying FGR cases. More than that, our study calculated the cutoff value for this ratio of 36.05, very close to the cutoff of the same ratio when screening for preeclampsia (38).[1]
This cutoff value does not change if we consider all cases of SGA, including those with associated preeclampsia and/or its complications to the ongoing pregnancy or if we consider only FGR cases without associated preeclampsia.
The limitation of the study is the small number of participants and controls. Nevertheless, using the sample size was calculated using the 2-sided test as published by John Wiley & Sons on behalf of the World Health Organization in 1990. Based on the article of Wallner,[28] the formula is:
 |
α = 0.05 (Type I error)
β = 0.2, Power = 80%
Z α/2 = 95% CI
Z β = 0.84 (Type II error)
sFlt-1 of IUGR group = 4479
sFlt-1 of control group = 2199
δ = standard deviation of the outcome = 2633
sample size n = 21/group
So the number of cases and controls was satisfactory for the study.
4.3. What are the implications for public health practice?
The third trimester screening for PE or SGA does not allow us to apply primary prevention because the administration of low-dose aspirin after 16 weeks does not prevent the subsequent development of PE or SGA.[29–31]
So, the objective of the screening for SGA in the third trimester (28–35 weeks) is to identify a high-risk group that needs closer monitoring, referral for a third-degree pregnancy, and a better evaluation of the proper time of delivery.
5. Conclusions
The use of the sFlt1/PIGF ratio has already entered current practice for the diagnosis and management of preeclampsia, but it is also useful in other pathologies related to placental insufficiency, one of them being fetal growth restriction. To screen for FGR, we can use the same cutoff value of 38, like for preeclampsia, and the presence of an associated preeclampsia seems not to have biased the results.
Author contributions
Conceptualization: Demetra Socolov, Razvan Socolov, Cristina Dimitriu.
Data curation: Valeria Visan, Ioana Sadiye Scripcariu.
Formal analysis: Valeria Visan, Ioana Sadiye Scripcariu, Daniela Rusu, Andreea Avasiloaiei.
Investigation: Ioana Sadiye Scripcariu.
Methodology: Amelia Costescu, Andreea Avasiloaiei.
Software: Lucian Boiculese.
Supervision: Demetra Socolov.
Validation: Razvan Socolov, Lucian Boiculese.
Writing – original draft: Demetra Socolov, Amelia Costescu.
Writing – review & editing: Demetra Socolov, Cristina Dimitriu.
Razvan Socolov orcid: 0000-0002-8969-8016.
Footnotes
Abbreviations: AC = abdominal circumference, ACOG = American College of Obstetricians and Gynecologists, AFI = amniotic fluid index, AGA = appropriate for gestational age, APS = antiphospholipid syndrome, BMI = Body mass index, BPD = bi parietal diameter, BW = birth weight, CD = caesarean delivery, CPAP = continuous positive air pressure, CRL = crown-rump length, CTG = cardio tocography, EFW = estimated fetal weight, FGR = fetal growth restriction, FL = femoral length, FPR = false positive result, GA = gestational age, HC = head circumference, HCG = human chorionic gonadotropine, HELLP = hemolysis elevated liver enzymes low platelet count, IUGR = intrauterine growth restriction, IVF = in vitro fertilization, LGA = large for gestational age, MCAPI = median cerebral artery pulsatility index, NEC = necrotizing enterocolitis, NICU = neonatal intensive care unit, PAPP-A1 = pregnancy associated plasma protein A- 1, PE = preeclampsia, PIGF = placental growth factor, sFlt-1 = soluble fmd-like tyrosine kinase-1, SGA = small for gestational age, SLE = systemic lupus erythematosus, UAP = uterine apoplexy, UAPI = umbilical artery pulsatility index, US = ultrasound, UtAPI = uterine artery mean pulsatility index.
Technical appendix, statistical code, and dataset available at the corresponding authors.
The study was approved by the Ethical Committee of Cuza Voda University Hospital of Iasi, Romania.
The authors have no funding and conflicts of interests to disclose.
References
- [1].Zeisler H, Llurba E, Chantraine F, et al. Predictive value of the sFlt-1:PlGF ratio in women with suspected preeclampsia. N Engl J Med 2016;374:13–22. [DOI] [PubMed] [Google Scholar]
- [2].American College of Obstetricians and Gynecologists. ACOG Practice bulletin no. 134: fetal growth restriction. Obstet Gynecol 2013;121:1122e33. [DOI] [PubMed] [Google Scholar]
- [3].Lubchenco LO, Hansman C, Dressler M, et al. Intrauterine growth as estimated from liveborn birthweight data at 24 to 42 weeks of gestation. Pediatrics 1963;32:793–800. [PubMed] [Google Scholar]
- [4].Fenton TR, Kim JH. A systematic review and meta-analysis to revise the Fenton growth chart for preterm infants. BMC Pediatr 2013;13:59. [DOI] [PMC free article] [PubMed] [Google Scholar]
- [5].Der Index der Körperfülle als Maß des Ernährungszustandes [The index of corpulence as measure of nutritional state] Munchener Medizinische Wochenschrift, 68(1921), 580–2. [Google Scholar]
- [6].Bais JMJ, Eskes M, Pel M, et al. Effectiveness of detection of intrauterine retardation by abdominal palpation as screening test in a low-risk population: an observational study. Eur J Obstet Gynecol Reprod Biol 2004;116:164–9. [DOI] [PubMed] [Google Scholar]
- [7].Lindhard A, Nielsen PV, Mouritsen LA, et al. The implications of introducing the symphyseal-fundal height-measurement. A prospective randomized controlled trial. Br J Obstet Gynaecol 1990;97:675–80. [DOI] [PubMed] [Google Scholar]
- [8].Goto E. Prediction of low birthweight and small for gestational age from symphysis-fundal height mainly in developing countries: a meta-analysis. J Epidemiol Community Health 2013;67:999–1005. [DOI] [PubMed] [Google Scholar]
- [9].Figueras F, Caradeux J, Crispi F, et al. Diagnosis and surveillance of late-onset fetal growth restriction. Am J Obstet Gynecol 2018;218(2S):S790–802. e1. [DOI] [PubMed] [Google Scholar]
- [10].Smith GC, Stenhouse EJ, Crossley JA, et al. Early pregnancy levels of pregnancy-associated plasma protein a and the risk of intrauterine growth restriction, premature birth, preeclampsia, and stillbirth. J Clin Endocrinol Metab 2002;87:1762–7. [DOI] [PubMed] [Google Scholar]
- [11].Khalil A, Sodre D, Syngelaki A, et al. Maternal hemodynamics at11-13 weeks of gestation in pregnancies delivering small for gestational age neonates. Fetal Diagn Ther 2012;32:231–8. [DOI] [PubMed] [Google Scholar]
- [12].Lesmes C, Gallo DM, Gonzalez R, et al. Prediction of small-for-gestational-age neonates: screening by maternal serum biochemical markers at 19-24 weeks. Ultrasound Obstet Gynecol 2015;46:341–9. [DOI] [PubMed] [Google Scholar]
- [13].Odibo AO, Sehdev HM, Stamilio DM, et al. Evaluating the thresholds of abnormal second trimester multiple marker screening tests associated with intra-uterine growth restriction. Am J Perinatol 2006;23:363–7. [DOI] [PubMed] [Google Scholar]
- [14].Dugoff L, Hobbins JC, Malone FD, et al. Quad screen as a predictor of adverse pregnancy outcome. Obstet Gynecol 2005;106:260–7. [DOI] [PubMed] [Google Scholar]
- [15].Benn PA, Horne D, Briganti S, et al. Elevated second-trimester maternal serum hCG alone or in combination with elevated alpha-fetoprotein. Obstet Gynecol 1996;87:217–22. [DOI] [PubMed] [Google Scholar]
- [16].Gaccioli F, Aye ILMH, Sovio U, et al. Screening for fetal growth restriction using fetal biometry combined with maternal biomarkers. Am J Obstet Gynecol 2018;218(2S):S725–37. [DOI] [PubMed] [Google Scholar]
- [17].Caillon H, Tardif C, Dumontet E, et al. Evaluation of sFlt-1/PlGF ratio for predicting and improving clinical management of pre-eclampsia: experience in a specialized perinatal care center. Ann Lab Med 2018;38:95–101. [DOI] [PMC free article] [PubMed] [Google Scholar]
- [18].Dragan I, Georgiou T, Prodan N, et al. Screening for pre-eclampsia using sFlt-1/PlGF ratio cut-off of 38 at 30-37 weeks’ gestation. Ultrasound Obstet Gynecol 2017;49:73–7. [DOI] [PubMed] [Google Scholar]
- [19].Crispi F, Llurba E, Domínguez C, et al. Predictive value of angiogenic factors and uterine artery Doppler for early- versus late-onset pre-eclampsia and intrauterine growth restriction. Ultrasound Obstet Gynecol 2008;31:303–9. [DOI] [PubMed] [Google Scholar]
- [20].Herraiz I, Llurba E, Verlohren S, et al. Spanish Group for the Study of Angiogenic Markers in Preeclampsia. Update on the diagnosis and prognosis of preeclampsia with the aid of the sFlt-1/PlGF ratio in singleton pregnancies. Fetal Diagn Ther 2018;43:81–9. [DOI] [PubMed] [Google Scholar]
- [21].Signore C, Mills JL, Qian C, et al. Circulating angiogenic factors and placental abruption. Obstet Gynecol 2006;108:338–44. [DOI] [PubMed] [Google Scholar]
- [22].Smith GC, Crossley JA, Aitken DA, et al. Circulating angiogenic factors in early pregnancy and the risk of preeclampsia, intrauterine growth restriction, spontaneous preterm birth, and stillbirth. Obstet Gynecol 2007;109:1316–24. [DOI] [PubMed] [Google Scholar]
- [23].Bakalis S, Gallo DM, Mendez O, et al. Prediction of small-for-gestational-age neonates: screening by maternal biochemical markers at 30-34 weeks. Ultrasound Obstet Gynecol 2015;46:208–15. [DOI] [PubMed] [Google Scholar]
- [24].Chang YS, Chen CN, Jeng SF, et al. The sFlt-1/PlGF ratio as a predictor for poor pregnancy and neonatal outcomes. Pediatr Neonatol 2017;58:529–33. [DOI] [PubMed] [Google Scholar]
- [25].Komwilaisak R, Tangkiratichai P. Maternal serum angiogenic growth factors in intrauterine growth restriction versus normal pregnancies. J Med Assoc Thai 2017;100:119–24. [PubMed] [Google Scholar]
- [26].Muttukrishna S, Swer M, Suri S, et al. Soluble Flt-1 and PlGF: new markers of early pregnancy loss? PLoS One 2011;6:e18041. [DOI] [PMC free article] [PubMed] [Google Scholar]
- [27].Bakalis S, Silva M, Akolekar R, et al. Prediction of small-for-gestational-age neonates: screening by fetal biometry at 30-34 weeks. Ultrasound Obstet Gynecol 2015;45:551–8. [DOI] [PubMed] [Google Scholar]
- [28].Bujold E, Roberge S, Lacasse Y, et al. Prevention of preeclampsia and intrauterine growth restriction with aspirin started in early pregnancy: a meta-analysis. Obstet Gynecol 2010;116:402–14. [DOI] [PubMed] [Google Scholar]
- [29].Wallner W, Sengenberger R, Strick R, et al. Angiogenic growth factors in maternal and fetal serum in pregnancies complicated by intrauterine growth restriction. Clin Sci (Lond) 2007;112:51–7. [DOI] [PubMed] [Google Scholar]
- [30].Roberge S, Villa P, Nicolaides K, et al. Early administration of low-dose aspirin for the prevention of preterm and term preeclampsia: a systematic review and meta-analysis. Fetal Diagn Ther 2012;31:141–6. [DOI] [PubMed] [Google Scholar]
- [31].Yu CK, Papageorghiou AT, Parra M, et al. Randomized controlled trial using low-dose aspirin in the prevention of pre-eclampsia in women with abnormal uterine artery Doppler at 23 weeks’ gestation. Ultrasound Obstet Gynecol 2003;22:233–9. [DOI] [PubMed] [Google Scholar]


