Supplemental Digital Content is available in the text
Keywords: biomarker, endoscopy, MSX2, pancreatic cancer, PDX1
Abstract
Early diagnosis of pancreatic cancer (PC) is based on endoscopic ultrasound (EUS). However, EUS is invasive and requires a high level of technical skill. Recently, liquid biopsies have achieved the same sensitivity and specificity for the diagnosis of numerous pathologies, including cancer. Insulin-promoting factor 1 (PDX1) and Msh-homeobox 2 (MSX2), 2 homeotic genes, have been confirmed to be related to pancreatic oncogenesis.
The aim of this study is to establish the diagnostic utility of circulating serum levels of MSX2 and PDX1 expression in patients with PC.
A prospective study was conducted from January 2014 to February 2017. Patients with a suspected diagnosis of PC who underwent fine needle aspiration biopsy guided by EUS (EUS-FNA) were included in the study, in addition to non-PC control subjects. Both tissue and blood serum samples were submitted to histopathological analysis and measurement of PDX1 and MSX2 gene expression by means of qRT-PCR.
Patients were divided into non-PC, malignant pathology (MP), or benign pathology (BP) groups. Significant differences in both MSX2 [2.05 (1.66–4.60) vs 0.83 (0.49–1.60), P = .006] and PDX1 [2.59 (1.28–10.12) vs 1.02 (0.81–1.17), P = .036] gene expression were found in blood samples of PC compared with non-PC subjects. We also observed a significant increase in MSX2 transcripts in tissue biopsy samples of patients diagnosed with MP compared with those with BP [1.98 (1.44–4.61) and 0.66 (0.45–1.54), respectively, P = .012]. The ROC curves indicate a sensitivity and specificity of 80% for PDX1 and 86% for MSX2.
Gene expression of MSX2 in tissue samples obtained by EUS-FNA and serum expression of MSX2 and PDX1 were higher in patients with PC.
1. Introduction
Pancreatic cancer (PC) is the seventh most common cause of cancer mortality worldwide,[1] with a 5-year survival rate of 5%.[2,3] Infiltrating pancreatic ductal adenocarcinoma (PDA) is the most prevalent tumor type, making up 90% of all PC cases. According to the 2014 World Cancer Report, PC mortality is higher on the European continent (31.6%) than the rest of the world.[4] Around 70% to 80% of patients present unresectable lesions at the time of diagnosis.[3] The global incidence of PC based on the 2012 GLOBOCAN is 4.2 out of every 100,000 individuals.[5] The estimated rate in lower in Mexico, with an incidence of 3.4 per 10,000 inhabitants, which is thought to be underestimated due to limited or incomplete data availability.[6–8]
Historically, early diagnosis of PC has been difficult due to technical issues related to the physiopathology of the disease. Genetic alterations have been reported for intraductal adenocarcinoma (IDA), which is characterized by mutations in several genes, including K-Ras, Cdkn2a, Tp53, Tgfbr2, Epc1, Arid2, and Map2k4, among others.[9–12] Cystadenomas, intraductal papillary mucinous, and mucinous cystic neoplasms are also characterized by gene mutations in β-catenin, Gnas, Rnf43, and Tp53.[13] In addition, inherited mutations such as those occurring in the BRCA2, p16/CDKN2A, and PRSS1 genes might have an impact on the risk of developing PC.[13] Previous reports indicate that K-ras gene mutations are most frequently observed in tissue (45–100%) and serum (77%) samples of PC patients,[14,15] followed by mutations in the genes encoding cyclin-dependent kinase 2A (CDKN2A)/P16, tumor protein 53 (TP53), and SMAD family member 4 (SMAD4).[9–11] Notably, K-Ras mutations have been detected in pre-malignant stages, which could be useful as an early detection marker for PC.[16,17]
Aside from the above-mentioned genes, some reports have indicated that homeotic genes such as insulin promoter factor 1 (PDX1) and the transcription factor Msh-homeobox 2 (MSX2) are related to PC. In the first case, it has been shown that PDX1 directly regulates acinar cell identity, resisting the formation of PanIN-derived PDA. Thus, upon neoplastic transformation, PDX1 becomes an oncogenic factor.[18] In the second case, MSX2 was shown to be a transcription factor related to the epithelial-to-mesenchymal transition (EMT), with elevated expression noted in several tumors of epithelial origin.[19] The expression of MSX2 has also been related to PDA aggressiveness through induction of EMT via the BMP4-related signaling pathway.[20] Together, these findings highlight the potential use of MSX2 and PDX1 as potential biomarkers for use in PC diagnostics.
The aim of this study was to evaluate the diagnostic utility of MSX2 and PDX1 expression in the circulating blood of patients with PC.
2. Materials and methods
2.1. Study population
A prospective case–control study was conducted between January 2014 and February 2017. Patients (>18 years old) with a suspected diagnosis of PC with solid or cystic lesions, without a contraindication to the procedure, platelet count >50,000, and a pro-thrombin time (INR) <1.5 were included in the study. All patients authorized their participation in the study by providing informed signed consent. The protocol was reviewed and authorized by the Ethics and Research Committees. Clinical follow-up of patients with neoplasms was carried out for 6 months after the diagnosis.
Patients with a lesion in the pancreas diagnosed by at least 1 imaging study and histologically confirmed by a biopsy sample obtained by endoscopic ultrasound (EUS) were considered cases. Tissue biopsies were processed to measure the mRNA expression of PDX1 and MSX2 genes. Control (non-PC) pancreas tissue was obtained from cadaveric donors for liver transplantation.
2.2. Aspiration biopsy guided by endoscopic ultrasound
Endosonographic studies were performed under sedation with a FUJI EG-530UT convex linear instrument attached to a SU-8000 console (Fujifilm Corporation, Minato-Ku, Tokyo, Japan) or with a GF-UCT140 (Olympus Corp., Tokyo, Japan) device attached to an Aloka SSD-console 5500 (Aloka Ltd., Tokyo, Japan). Biopsy collection was conducted with 19G, 22G and/or 25G needles (Wilson-Cook Echotip Ultra, Winston-Salem, NC or Boston Scientific, MA). Following ultrasonography screening, once the lesion was located, the transducer was placed in a stable position in front of the lesion and a needle was inserted through the gastrointestinal wall with the stylet in position only during the first pass, then the stylet was removed and suction was applied. An average of 2 to 3 passes were performed per patient with a “fan” technique. The tissue obtained was used for histopathological evaluation and for the extraction of total RNA.
After the procedure, the patients remained under surveillance for at least 2 hours to assess for complications. The EUS procedures were conducted by 2 endosonographers with experience in the field (>2500 procedures), assisted by an anesthesiologist and performed under continuous monitoring.
2.3. Peripheral blood sample collection
Blood samples were collected using K2-EDTA tubes (BD-Vacutainer; Franklin Lakes, NJ). Control blood samples were collected from healthy patients who attended the endoscopy service for routine procedures. The plasma was separated from the globular package by centrifugation at 3000 rpm for 10 minutes at room temperature.
2.4. Total RNA extraction and RT-qPCR
Total RNA was extracted from whole blood or biopsy samples with the Tripure Isolation Reagent (Roche Diagnostics GmbH, Mannheim, Germany). Total RNA enrichment and integrity were assessed by 260-nm wavelength absorbance and denaturing agarose gel electrophoresis, respectively. Ratios of 260/280 nm and 260/230 nm above 1.8 and 1.5, respectively, were used as indicators of RNA purity. Once evaluated, RNA was kept at -70°C until use. As the pancreas samples were too small to obtain enough RNA, cDNA was synthetized using 1 μg of total RNA, a mix of random hexamers (60 μM), and anchored-oligo-dT 18 (50 μM) primers, according to the Transcriptor First-Strand cDNA Synthesis Kit guidelines (Roche Diagnostics GmbH). The resulting single-stranded cDNA was amplified by real-time polymerase chain reaction (qPCR) in duplicate, using TaqMan hydrolysis probes (Roche Diagnostics GmbH) and the LightCycler TaqMan Master kit (Roche Diagnostics GmbH), according to the manufacturer's instructions. The primers used in this study are as follows: pancreatic and duodenal homeobox 1 (PDX1, NM_000209.3), forward 5’-AAGCTCACGCGTGGAAAG-3’, reverse 5’-GCCGTGAGATGTACTTGTTGAA-3’; Msh-homeobox 2 (MSX2, NM_002449.4), forward 5’-CATGATGGATGCTTGTTTCAA-3’, reverse 5’-TGGCTGGTACTGCCTTCG-3’; and beta-actin, (ACTB, ENST00000331789.2) as the constitutively expressed gene, forward 5’-CAACCGCGAGAAGATGAC-3’, reverse 5’-GTCCATCACGATGCCAGT-3’. The reaction was performed using a LightCycler-480 II apparatus (Roche Diagnostics LTD, Rotkreuz, Switzerland) under the following conditions: 1 cycle of 95°C for 10 minutes; followed by 45 cycles of 95°C for 10 seconds, 60°C for 30 seconds, and 72°C for 1 second.
2.5. qPCR data analysis
Raw qPCR data were analyzed according to the standard curve method.[21] Briefly, serial 0.2-fold dilutions starting with 100 ng of input RNA were prepared to obtain a dynamic range of PCR amplification product. The crossing point (Cp) and the log10-based amount of RNA (nanograms) for each dilution were plotted, and the linear regression and coefficient of determination (R2) were obtained. These data were correlated with the log10-based input amount of RNA (nanograms) to interpolate and calculate the real concentration of curve input points, which were found to have a high correlation coefficient (0.9980). Once the curves were ready, sample data were interpolated on the curve, and the amount of RNA was calculated and used to normalize the control and PC-positive samples. The data were then compared, using control patients as the basal expression (1-fold).
2.6. Statistical analysis
Data distribution for each variable were analyzed with the Kolmogorov–Smirnov test. Qualitative data are expressed as frequencies and percentages, while quantitative data are expressed as mean ± standard deviation (SD) for parametric data and median (25th–75th percentiles) for nonparametric data. The Mann–Whitney test was used to assess the differences between groups. Analysis of the correlation between variables was conducted by applying the Pearson correlation test. A receiver operating characteristic (ROC) analysis was carried out for MSX2 and PDX1 serum gene expression in comparison with the control group. The area under curve (AUC), sensitivity, specificity, positive predictive values (PPV), negative predictive value (NPV), and diagnostic odds ratio (DOR) were also calculated. All of the statistical analyses were conducted using SPSS software 25.0 (SPSS, Chicago, IL), and graphs were generated with GraphPad Prism software V7.0 (GraphPad Software, San Diego, CA). All tests were 2-tailed and considered significant at P < .05.
3. Results
3.1. Clinical characteristics of the participants
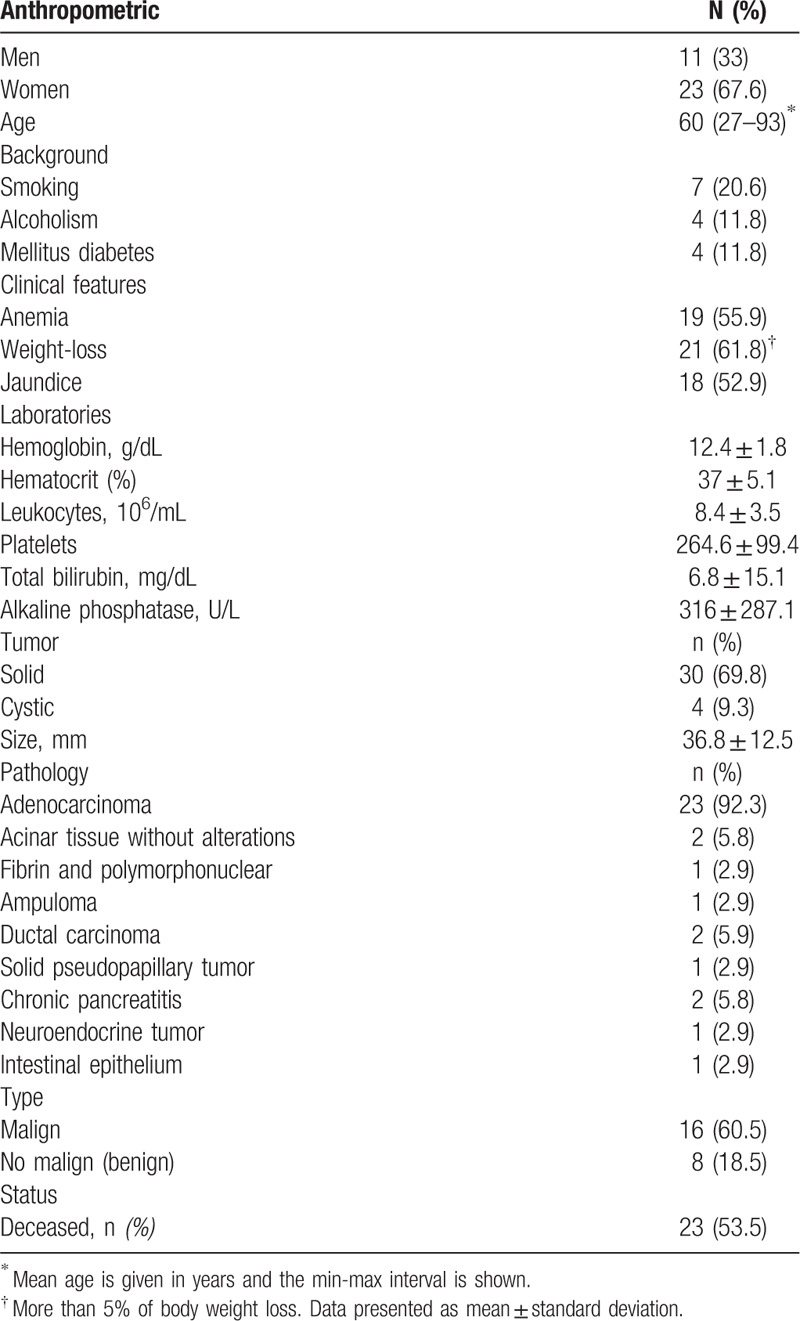
The inclusion criteria allowed us to initially recruit 83 patients with diagnostic suspicion of PC, from whom 49 were excluded due to insufficient tissue sample. Thus, 34 patients with pancreatic lesions were included in the final analysis. We also included 13 non-PC participants (non-PC). Of the patients with pancreatic lesions, 23 (67%) were women and 11 (33%) were men, and the average age was 60 ± 16 years. The baseline characteristics are summarized in Table 1.
Table 1.
Clinical feature and tumor characteristics of participants.
3.2. Findings of endoscopic ultrasonography
EUS allowed the diagnosis of PC in 30 out of 34 (88.2%) patients, of whom 26 (90%) corresponded to malignant pathology. The histopathological results confirmed that 24 of the 26 (92.3%) were malignant adenocarcinomas, with ampuloma and malignant neuroendocrine tumor representing the remaining 7.7% of cases (Table 1). Of the remaining 4 patients who were not diagnosed with PC by EUS-FNA, 2 were found to have normal acinar tissue, and the other 2 had chronic pancreatitis. The overall average lesion size was 36.8 ± 12.5 mm. In terms of tumor type, we observed that 30 of 34 (88.2%) were solid lesions, while the remaining 4 (11.8%) were cystic lesions. All of patients with malignant neoplasms presented vascular invasion, mainly to the portal vein, which was the affected vessel in 17 cases. The most frequently used needle for the biopsy was 22G. The average number of passes was 2 (range 1–3) per procedure, and there were no reported complications.
3.3. Tissue biopsy MSX2 and PDX1 gene expression
In order to make a reliable comparison, we first determined MSX2 and PDX1 gene expression in the non-PC group (data not shown). We then use those values as the basal expression (1-fold). The group of patients with a pancreatic lesion was divided into 2 groups depending on the histopathological findings. The first group included patients with malignant pathology (MP, n = 26) and the second group were patients with a benign pathology (BP, n = 8) (Table 1).
We observed that MSX2 expression was increased in patients with a pancreatic lesion compared with the non-PC group [1.72 (0.87–3.70) and 1.07 (0.29–1.63), respectively], although this result did not reach statistical significance (P = .17; Fig. 1B). Analysis of PDX1 transcript levels also showed that there was no difference between the PC and non-PC groups [0.52 (0.16–0.96) and 0.79 (0.71–1.49), respectively, P = .23; Fig. 1A].
Figure 1.
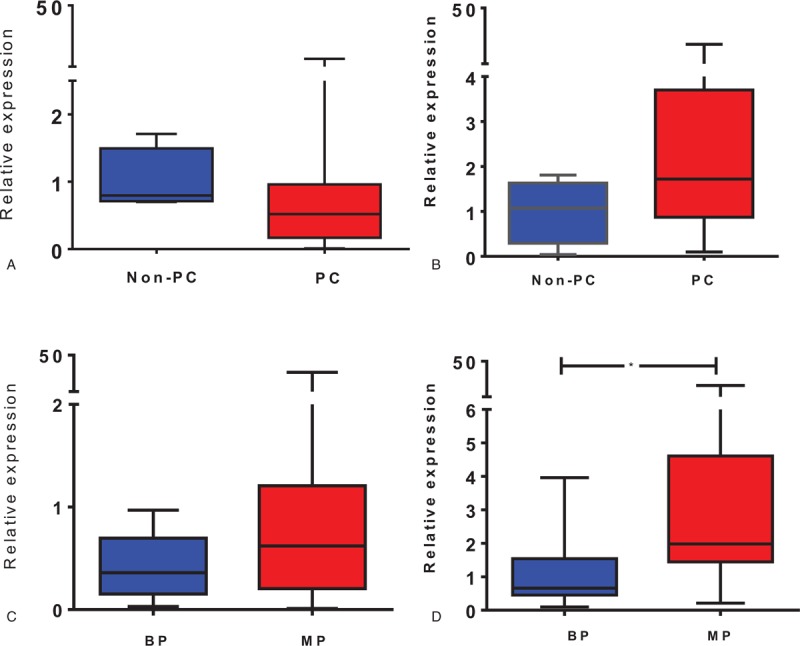
Transcript expression of PDX1 and MSX2 in tissue biopsies were evaluated in pancreatic cancer (PC) and non-PC subjects (A, B), and in PC patients diagnosed with benign pathology (BP) and malignant pathology (MP) (C, D). The plots represent the median and percentile (25–75%) for comparisons between the indicated groups for PDX1 (A, C) and MSX2 (B, D). Data were evaluated using the nonparametric t test and the Mann–Whitney post-hoc test. ∗P < .05 versus BP.
When this comparison was performed with the BP and MP groups, we observed a significant difference in MSX2 transcript expression [0.66 (0.45–1.54) and 1.98 (1.44–4.61), respectively, P = .012; Fig. 1D]. The same comparison for PDX1 revealed that this transcript was also increased in the MP group compared with the BP group [0.62 (0.20–1.20) and 0.36 (0.15–0.65), respectively, P = .23; Fig. 1C]. In order to determine whether any of these mRNA expression differences remained evident when data from the BP group were removed, we compared data from the non-PC and MP groups. In this analysis, we observed that the MSX2 transcript was upregulated in the MP group, while PDX1 gene expression did not differ between the 2 groups of patients (Supplementary Figure 1A and B).
3.4. Circulating blood expression of MSX2 and PDX1
The analysis showed that both transcripts were significantly elevated in the PC group compared with the non-PC group [MSX2, 2.05 (1.66–4.60) vs 0.83 (0.49–1.60), P = .006; PDX1, 2.59 (1.28–10.12) vs 1.02 (0.81–1.17), P = .036; Fig. 2A, B]. The comparison between MP and BP groups revealed that PDX1 expression was increased in the MP group [2.74 (1.35–11.08) vs 1.53 (-2.06 to 5.64)], but not significantly (P = .23; Fig. 2C). MSX2 expression was similar in both groups [2.02 (1.58–3.57) vs 2.25 (0.44–5.62), P = .92; Fig. 2D]. In contrast to the tissue biopsy findings, both MSX2 [2.02 (1.58–3.57) vs 0.83 (0.49–1.60), P = .012] and PDX1 [2.74 (1.35–11.08) vs 1.02 (0.81–1.17), P = .021] transcripts were significantly higher in the blood samples of the MP than in the non-PC group (Supplementary Figure 1C and D).
Figure 2.
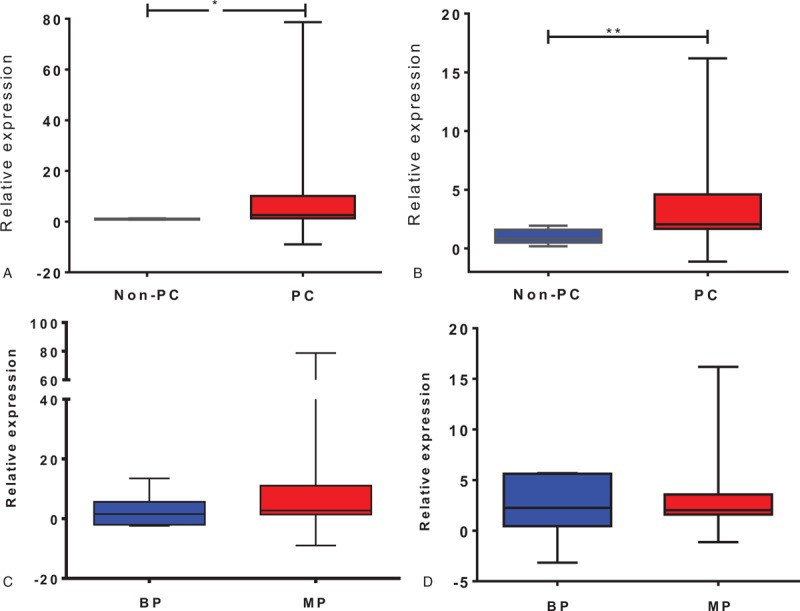
Transcript expression of PDX1 and MSX2 in circulating blood samples were evaluated in pancreatic cancer (PC) and non-PC subjects (A, B), and in PC patients diagnosed with benign pathology (BP) and malignant pathology (MP) (C, D). The plots represent the median and percentile (25–75%) for comparisons between the indicated groups for PDX1 (A, C) and MSX2 (B, D). Data were evaluated using the nonparametric t test and the Mann–Whitney post-hoc test; ∗P < .05, †P < .01.
3.5. Correlation analysis between laboratory parameters and gene expression data
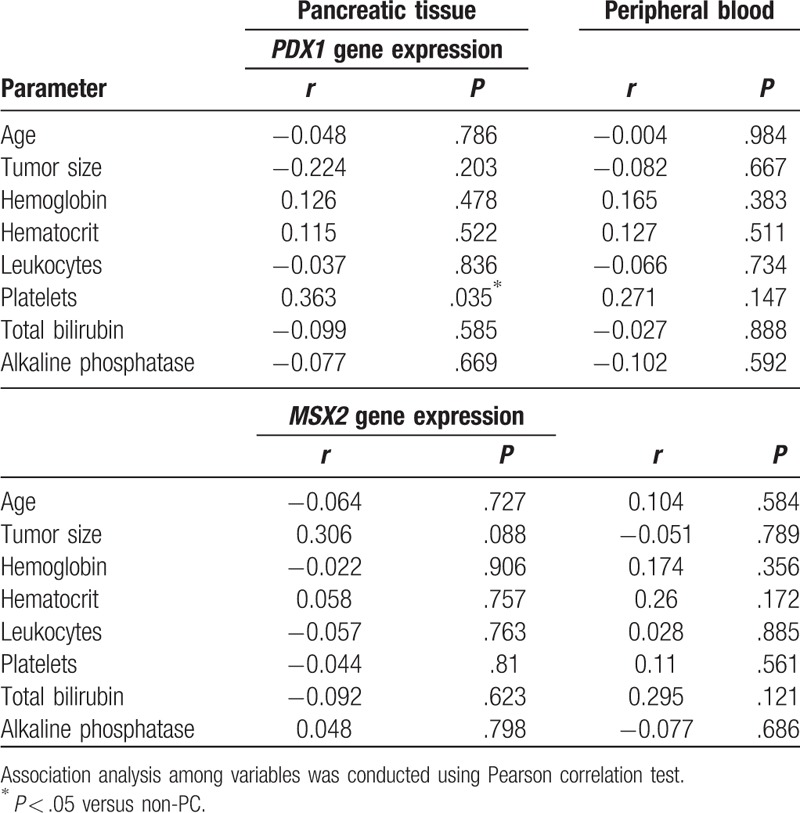
We performed a correlation analysis between laboratory findings and PDX1 or MSX2 mRNA expression in both tissue and blood samples. Data are presented in Table 2, respectively. We observed no significant associations between the tested parameters.
Table 2.
Correlation between PDX1 and MSX2 gene expression in pancreatic tissue and serum, and routine laboratory parameters in patients with pancreatic cancer.
3.6. Diagnostic utility of PDX1 or MSX2 gene expression for pancreatic cancer
Receiver operating characteristic curves were generated to determine whether the gene expression data could be used to diagnose PC in our group of patients. The AUC for gene expression in blood samples was 0.800 [95% confidence interval (95% CI) 0.660–0.940), P = .034] for PDX1 (Fig. 3A) and 0.827 (95% CI 0.686–0.967, P = .021] for MSX2 (Figure 3B).
Figure 3.
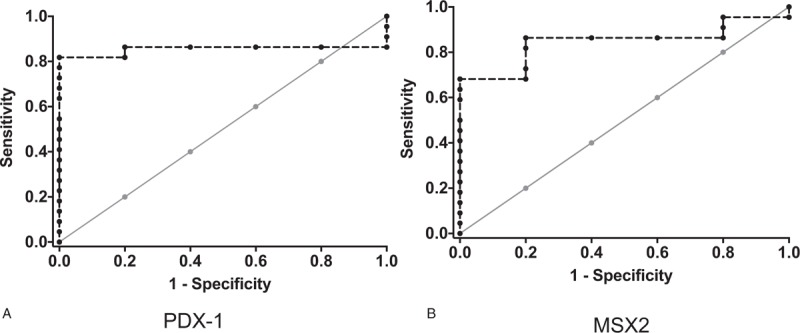
Receiver operator characteristic (ROC) curves for discriminating between nonpancreatic cancer (PC) and PC groups based on PDX1 (A) or MSX2 (B) transcript expression in circulating blood (dotted interrupted lines).
The sensitivity and specificity values for using the blood PDX1 transcript level to discriminate between the non-PC and PC groups were both 80%, with a small cut-off value of a 1.05-fold change. The PPV and NPV for PDX1 gene expression in blood were 96% and 60%, respectively, with an accuracy of 80%, while the sensitivity and specificity of blood MSX2 gene expression were 86% and 80%, respectively, with a cut-off value of a 1.36-fold change. The PPV and NPV for MSX2 gene expression were 96% and 50%, respectively, with an accuracy of 86%. The odds ratio (OR) for PC in patients whose MSX2 gene expression levels were >1.36-fold change was 26 (95% CI 2.28–2.95, P = .006). Similarly, the OR for PC in patients with PDX1 gene expression >1.05-fold change was 16 (95% CI 1.5–1.70, P = .017).
4. Discussion
According to our data, MSX2 and PDX1 transcript levels in circulating blood samples were higher in patients with malignant pancreatic lesions than in controls (non-PC patients).
The use of biomarkers for the diagnosis of biliopancreatic diseases, including PC, has been previously described.[22–24] Bartsch et al[25] showed that the circulating levels of LCN2 and TIMP1 transcripts could be useful for the early diagnosis of PC. Here, we report that the abundance of MSX2 and PDX1 transcripts are good serum biomarkers for discriminating between non-PC and PC patients. Our results indicate that both genes are significantly upregulated in the peripheral blood samples of patients with PC. We also found that the transcript abundance of PDX1 and MSX2 was positively correlated between peripheral blood and tissue gene expression. To our knowledge, no previous reports have suggested the use of PDX1 as a biomarker in nondiagnosed PC patients. Moreover, as PDX1 transcript expression has not been estimated in healthy patients, our data extended the analysis by using blood samples from healthy participants in order to gain an insight into the correlation between tissue expression and that observed in peripheral blood.
Marzioni et al[26] reported a significant increase in PDX1 transcript expression in 54 PC biopsies. However, our findings are in contrast to those of Marzioni et al[26] in terms of tissue PDX1 expression, as we observed diminished expression of this transcript in our biopsies. Differences between the studies could arise due to the method used to normalize and analyze the raw PCR data. While Marzioni et al[26] used the expression of the MIA.PaCa-2 pancreatic cell line as the basal expression, we used tissue and circulating blood samples from non-PC subjects as calibrators. Data from a study by Igarashi et al[27] using cholangiocarcinoma samples reported similar PDX1 expression to that of PC samples, including the values reported in our study.
Although we did not observe elevated PDX1 transcript levels in PC biopsies when compared with non-PC samples, these data are consistent with the dual role of PDX1, likely undergoing a transition from a tumor-suppressive to oncogenic gene, promoting the carcinogenesis-associated EMT process.[18] Moreover, our findings are in line with the notion that PDX1 expression is downregulated in order for epithelial cells to undergo EMT and acquire metastatic properties.[18] In contrast, Koizumi et al[28] reported that survival of PC patient was longer when PDX1 expression was directly downregulated in pancreatic tissue, while Park et al[29] found no differences in the survival rate between low and high PDX1 protein expression in situ in a series of paraffin-embedded samples derived from PC patients.
On the contrary, we observed increased levels of PDX1 transcript in malignant compared with the nonmalignant tissue and blood samples, which strongly suggests that PDX1 expression might effectively be a more specific indicator for differentiating between these 2 conditions (Figs. 1 and 2 and Supplemental Figure 1).
Our findings also showed that MSX2 was upregulated in MP biopsies when compared with their respective controls (Fig. 1D). The opposite was true when this transcript was evaluated in the peripheral blood, where PC was significantly different when compared with non-PC samples, while BP and MP were not different. Our results are similar to those reported by Satoh et al,[30] who reported a diagnostic accuracy of 79.3% for the expression of MSX2 in patients with suspected PDAC. Satoh et al[31] suggested that MSX2 expression is related to the differentiation process for carcinoma cells rather than carcinogenesis, because experimentally induced MSX2 overexpression results in an aggressive PC phenotype. The increased expression of MSX2 in our biopsies could also be related to the metastatic phenotype and EMT process observed in previous studies.[32,33]
Despite the differences among studies, they all conclude that MSX2 expression is increased in PC at the tissue level, and MSX2 could be a useful potential biomarker in PC diagnosis when associated with histological or clinical data. An important difference to consider, however, is that while brushing pancreatic stenosis or a surgical procedure were the chosen methods for specimen recovery in these studies, all samples used in our study were obtained by EUS-FNA. Indeed, EUS-FNA is the most frequently used tissue sampling method for histological diagnosis in PC. The total mass of tissue obtained by EUS-FNA is larger than brushing, which is an important factor to consider in terms of gene expression quantitation.
Together, these data suggest that PDX1 and MSX2 are differentially and consistently expressed in peripheral PC blood samples, meaning that these gene products could potentially be used as biomarkers for PC. In support of this notion, our ROC analysis of PDX1 and MSX2 expression demonstrated an ability to distinguish between the healthy and PC groups. Our data indicate that the sensitivity and specificity for PDX1 were both 80%, and the ROC curve analysis indicates that the sensitivity and specificity for MSX2 were 86% and 80%, respectively. The PPV and NPV were estimated for both transcripts. We found equal values for PPV (96%), but the NPVs for PDX1 and MSX2 were 60% and 50%, respectively. These results indicate that PDX1 expression seems to be more reliable for discriminating between PC and healthy patients. Furthermore, MSX2 has also been found to be elevated in PDA.[30,31] To our knowledge, the present study is the first to report both MSX2 and PDX1 expression levels in tissue and peripheral blood, providing an additional tool for a more complete approach for the diagnosis of patients with suspected PC.
In conclusion, the pancreatic gene expression of MSX2 in tissue samples obtained by EUS-FNA, as well as blood MSX2 and PDX1 expression levels, are higher in patients with PC.
Author contributions
Conceptualization: Francisco Valdovinos-Andraca, Félix Ignacio Téllez-Ávila.
Data curation: Carlos Pérez-Monter, Isabel Medina-Vera.
Formal analysis: Carlos Pérez-Monter, Gilberto Duarte-Medrano, Iván Lopez-Méndez.
Investigation: Carlos Pérez-Monter, Gilberto Duarte-Medrano, Félix Ignacio Téllez-Ávila, Francisco Valdovinos-Andraca.
Funding: Félix Ignacio Téllez-Ávila.
Methodology: Gilberto Duarte-Medrano, Iván Lopez-Méndez, Rodrigo Cruz-Martínez, Carlos Pérez-Monter, Isabel Medina-Vera.
Resources: Carlos Pérez-Monter, Félix Ignacio Téllez-Ávila, Miguel Ángel Ramírez-Luna.
Manuscript writing: Gilberto Duarte-Medrano, Carlos Pérez-Monter, Félix Ignacio Téllez-Ávila.
Carlos Pérez-Monter orcid: 0000-0001-5613-0697.
Supplementary Material
Footnotes
Abbreviations: BP = benign pathology, cDNA = complementary deoxyribonucleic acid, Cp = crossing point, EMT = epithelial-to-mesenchymal transition, EUS = endoscopic ultrasound, EUS-FNA = fine needle aspiration endoscopic ultrasound, INR = pro-thrombin time, MP = malignant pathology, MSX2 = Msh-homeobox 2, PC = pancreatic cancer, PDA = pancreatic ductal adenocarcinoma, PDX1 = Insulin-promoting factor 1, qRT-PCR = quantitative real-time polymerase chain reaction, ROC = receiver-operating characteristic.
GDM and ILM contributed equally to this work.
This work was supported by Secretaría de Salud and National Institute of Medical Sciences Salvador Zubirán.
The authors declare no conflict of interest.
Supplemental Digital Content is available for this article.
References
- [1].Ilic M, Ilic I. Epidemiology of pancreatic cancer. World J Gastroenterol 2016;22:9694–705. [DOI] [PMC free article] [PubMed] [Google Scholar]
- [2].Hidalgo M. Pancreatic cancer. N Engl J Med 2010;362:1605–17. [DOI] [PubMed] [Google Scholar]
- [3].Cheema AR, O’Reilly EM. Management of metastatic pancreatic adenocarcinoma. Surg Clin North Am 2016;96:1391–414. [DOI] [PubMed] [Google Scholar]
- [4].Rahib L, Smith BD, Aizenberg R, et al. Projecting cancer incidence and deaths to 2030: the unexpected burden of thyroid, liver, and pancreas cancers in the United States. Cancer Res 2014;74:2913–21. [DOI] [PubMed] [Google Scholar]
- [5].Ferlay J, Soerjomataram I, Dikshit R, et al. Cancer incidence and mortality worldwide: sources, methods and major patterns in GLOBOCAN 2012. Int J Cancer 2015;136:E359–86. [DOI] [PubMed] [Google Scholar]
- [6].Guitron-Cantu A, Adalid-Martinez R, Segura-Lopez F. [Epidemiology of bilio-pancreatic cancer in Specialty Hospital UMAE N degrees 71 IMSS in Torreon, Coahuil]. Rev Gastroenterol Mex 2011;76:287–94. [PubMed] [Google Scholar]
- [7].Robles-Diaz G, Fastag D. [Cancer of the pancreas. Epidemiology and risk factors]. Rev Gastroenterol Mex 2007;72suppl 2:154–9. [PubMed] [Google Scholar]
- [8].Contreras B, Platt J. [Epidemiology of digestive system cancer in the State of Sonora]. Rev Gastroenterol Mex 1995;60:175. [PubMed] [Google Scholar]
- [9].Salek C, Benesova L, Zavoral M, et al. Evaluation of clinical relevance of examining K-ras, p16 and p53 mutations along with allelic losses at 9p and 18q in EUS-guided fine needle aspiration samples of patients with chronic pancreatitis and pancreatic cancer. World J Gastroenterol 2007;13:3714–20. [DOI] [PMC free article] [PubMed] [Google Scholar]
- [10].Brody JR, Costantino CL, Potoczek M, et al. Adenosquamous carcinoma of the pancreas harbors KRAS2, DPC4 and TP53 molecular alterations similar to pancreatic ductal adenocarcinoma. Mod Pathol 2009;22:651–9. [DOI] [PubMed] [Google Scholar]
- [11].Kipp BR, Fritcher EG, Clayton AC, et al. Comparison of KRAS mutation analysis and FISH for detecting pancreatobiliary tract cancer in cytology specimens collected during endoscopic retrograde cholangiopancreatography. J Mol Diagn 2010;12:780–6. [DOI] [PMC free article] [PubMed] [Google Scholar]
- [12].Dranoff G. Cytokines in cancer pathogenesis and cancer therapy. Nat Rev Cancer 2004;4:11–22. [DOI] [PubMed] [Google Scholar]
- [13].Hruban R.H. (2014). Pancreatic Cancer. World Cancer Report 2014. B.W.S. and C.P. Wild. Lyon CEDEX 08 France. International Agency for Research on Cancer: 413–421. [Google Scholar]
- [14].Bhat K, Wang F, Ma Q, et al. Advances in biomarker research for pancreatic cancer. Curr Pharm Des 2012;18:2439–51. [DOI] [PMC free article] [PubMed] [Google Scholar]
- [15].Downward J. Targeting RAS signalling pathways in cancer therapy. Nat Rev Cancer 2003;3:11–22. [DOI] [PubMed] [Google Scholar]
- [16].Maitra A, Kern SE, Hruban RH. Molecular pathogenesis of pancreatic cancer. Best Pract Res Clin Gastroenterol 2006;20:211–26. [DOI] [PubMed] [Google Scholar]
- [17].Morris JP, Wang SC, Hebrok M. KRAS, Hedgehog, Wnt and the twisted developmental biology of pancreatic ductal adenocarcinoma. Nat Rev Cancer 2010;10:683–95. [DOI] [PMC free article] [PubMed] [Google Scholar]
- [18].Roy N, Takeuchi KK, Ruggeri JM, et al. PDX1 dynamically regulates pancreatic ductal adenocarcinoma initiation and maintenance. Genes Dev 2016;30:2669–83. [DOI] [PMC free article] [PubMed] [Google Scholar]
- [19].Suzuki M, Tanaka M, Iwase T, et al. Over-expression of HOX-8, the human homologue of the mouse Hox-8 homeobox gene, in human tumors. Biochem Biophys Res Commun 1993;194:187–93. [DOI] [PubMed] [Google Scholar]
- [20].Hamada S, Satoh K, Hirota M, et al. Bone morphogenetic protein 4 induces epithelial-mesenchymal transition through MSX2 induction on pancreatic cancer cell line. J Cell Physiol 2007;213:768–74. [DOI] [PubMed] [Google Scholar]
- [21].Livak KJ, Schmittgen TD. Analysis of relative gene expression data using real-time quantitative PCR and the 2 (-Delta Delta C (T)) Method. Methods 2001;25:402–8. [DOI] [PubMed] [Google Scholar]
- [22].Rozenblum E, Schutte M, Goggins M, et al. Tumor-suppressive pathways in pancreatic carcinoma. Cancer Res 1997;57:1731–4. [PubMed] [Google Scholar]
- [23].van Heek NT, Meeker AK, Kern SE, et al. Telomere shortening is nearly universal in pancreatic intraepithelial neoplasia. Am J Pathol 2002;161:1541–7. [DOI] [PMC free article] [PubMed] [Google Scholar]
- [24].Taghavi SA, Majd SK, Sianati M, et al. Prevalence of IgG-4-associated cholangiopathy based on serum IgG-4 levels in patients with primary sclerosing cholangitis and its relationship with inflammatory bowel disease. Turk J Gastroenterol 2016;27:547–52. [DOI] [PubMed] [Google Scholar]
- [25].Bartsch DK, Gercke N, Strauch K, et al. The combination of MiRNA-196b, LCN2, and TIMP1 is a potential set of circulating biomarkers for screening individuals at risk for familial pancreatic cancer. J Clin Med 2018;7:pii: E295. [DOI] [PMC free article] [PubMed] [Google Scholar]
- [26].Marzioni M, Germani U, Agostinelli L, et al. PDX-1 mRNA expression in endoscopic ultrasound-guided fine needle cytoaspirate: perspectives in the diagnosis of pancreatic cancer. Dig Liver Dis 2015;47:138–43. [DOI] [PubMed] [Google Scholar]
- [27].Igarashi S, Matsubara T, Harada K, et al. Bile duct expression of pancreatic and duodenal homeobox 1 in perihilar cholangiocarcinogenesis. Histopathology 2012;61:266–76. [DOI] [PubMed] [Google Scholar]
- [28].Koizumi M, Doi R, Toyoda E, et al. Increased PDX-1 expression is associated with outcome in patients with pancreatic cancer. Surgery 2003;134:260–6. [DOI] [PubMed] [Google Scholar]
- [29].Park JY, Hong SM, Klimstra DS, et al. Pdx1 expression in pancreatic precursor lesions and neoplasms. Appl Immunohistochem Mol Morphol 2011;19:444–9. [DOI] [PMC free article] [PubMed] [Google Scholar]
- [30].Satoh K, Hamada S, Kanno A, et al. Evaluation of MSX2 mRNA in brush cytology specimens distinguished pancreatic carcinoma from chronic pancreatitis. Cancer Sci 2011;102:157–61. [DOI] [PubMed] [Google Scholar]
- [31].Satoh K, Hamada S, Kanno A, et al. Expression of MSX2 predicts malignancy of branch duct intraductal papillary mucinous neoplasm of the pancreas. J Gastroenterol 2010;45:763–70. [DOI] [PubMed] [Google Scholar]
- [32].Satoh K, Hamada S, Kimura K, et al. Up-regulation of MSX2 enhances the malignant phenotype and is associated with twist 1 expression in human pancreatic cancer cells. Am J Pathol 2008;172:926–39. [DOI] [PMC free article] [PubMed] [Google Scholar]
- [33].di Bari MG, Ginsburg E, Plant J, et al. Msx2 induces epithelial-mesenchymal transition in mouse mammary epithelial cells through upregulation of Cripto-1. J Cell Physiol 2009;219:659–66. [DOI] [PMC free article] [PubMed] [Google Scholar]
Associated Data
This section collects any data citations, data availability statements, or supplementary materials included in this article.


