Abstract
Photosynthetic light response (PLR) curves of leaves are usually fitted by non-rectangular hyperbola (NRH) equation, and those fitted NRH parameters may change with leaf aging. The objectives of this study were 1) to reveal the response of NRH parameters of rice leaves, light-saturated net photosynthetic rate (Pnmax), quantum yield of assimilation (φ), dark respiration rate (Rd) and convexity of the curve (k), to leaf age; and 2) to improve the performance of NRH equation in simulating the PLR curves for leaves at various ages. The PLR for rice leaves at ages of 3–53 days were measured, and the general NRH equation was developed by incorporating the relationship between NRH parameters and leaf age into the NRH equation. The results showed that the NRH parameters of Pnmax, φ and Rd increased rapidly to maximum at approximately 10 days and then declined linearly toward the age of 53 days. However, the value of k was not sensitive to leaf age. The general NRH equation can be used to simulate leaf PLR continuously along with leaf aging.
Subject terms: Light responses, C3 photosynthesis
Introduction
Leaf photosynthetic light response (PLR) is the fundamental for understanding photosynthetic process driven by photon energy1–3, and for modelling net primary productivity or net ecosystem exchange4,5. Numerous mathematical functions have been used to describe the PLR curves, such as Michaelis-Menten, Mitscherlich, hyperbolic tangent, rectangular hyperbola and non-rectangular hyperbola (NRH) equations6.
Leaf photosynthetic characteristics were influenced by various leaf traits, including leaf nitrogen content, leaf chlorophyll content, specific leaf mass and leaf position4,7–13. Consequently, leaf PLR curves, as well as parameters in the PLR equations, varied greatly among leaves or varieties14–16. Incorporating those influential factors into PLR equations was important for either understanding the plant PLR or modeling plant photosynthesis at different spatial scales17,18. Some of those factors have been incorporated into different PLR equations. Leaf nitrogen content and specific leaf mass for herbaceous and woody angiosperms were found highly correlated with PLR parameters, and the interspecific PLR curves were established by linking the PLR parameters of both Mitscherlich and Michaelis–Menten functions to leaf nitrogen content and specific leaf mass3,14, which were tested to be accurate in depicting PLR curves among species and individual plants. SPAD value (a reliable indicator of leaf chlorophyll content)19–21 was incorporated into the NRH equation to build a general PLR equation, which can be used to describe PLR curves of rice leaves with different SPAD values22. Those researches provide marvelous cases for improving the performance of PLR equation among species, varieties, plants and leaves, which is enlightening for future research.
Furthermore, leaf age was also an important factor affecting leaf photosynthetic traits, owing to changes in both leaf traits23–25 and biomass sink-source relation26–28 along with leaf aging from leaf appearance to senescence. The declining tendency in net photosynthetic rates (Pn) was observed over a wide variety of species with leaf aging from full leaf expansion to senescence11,29,30. For rice, measured light-saturated Pn reached the maximum at fully developed stage and then declined gradually as leaves senesced31, or declined from the top (young leaves) to the basal (old leaves) within rice canopy7,32. Thus, it was well known that Pn varied among leaves at various ages, yet there was no results discussing the changes in PLR parameters during leaf development. As a result, almost all models ignored the variation of leaf age within the canopy, and treated all leaves with the same PLR parameters calibrated based on leaf scale measurement in calculating Pn at canopy scale1.
Insight into the effect of leaf age on photosynthetic traits will provide basic information for either modelling leaf photosynthesis continuously along with leaf aging, or upscaling leaf photosynthesis to canopy scale by considering the variation of leaf age within canopy. To reveal the impact of leaf age on rice PLR curves and their parameters, the NRH equation was established first for each specific leaf based on PLR data collected from rice leaves at various ages. Subsequently a general NRH equation, capable of simulating PLR curves for leaves at various ages, was constructed by considering the impact of leaf age.
Results and Discussion
Leaf SPAD values with leaf aging
Leaf SPAD value was considered as the indicator of leaf chlorophyll level, and highly related to leaf photosynthetic traits. Rice leaf SPAD readings varied in three stages with leaf aging, initial development, fully functional and senescence periods (Fig. 1). The initial development period lasted for approximately two weeks since leaf emergence. During this period, rice SPAD values increased rapidly. Then, SPAD readings were high and relatively constant in the full functional period for about 30 days. Finally, in leaf senescence stage, SPAD values decreased gradually. Similar results were reported on rice in East China by Yang et al.20.
Figure 1.
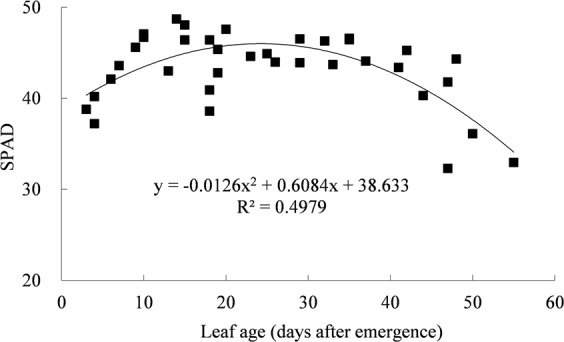
Rice leaf SPAD varied along with leaf aging.
Measured photosynthetic light response for leaves at various ages
These 37 independent PLR curves were categorized into 11 groups with five days as steps, by putting PLR curves with leaf age ±2 days around together. The Pn initially increased fast with the increase in photosynthetic photon flux density (PPFD), then slowly up to the maximum Pn (Fig. 2). Leaf PLR curves were quite different to each other among leaves at various ages. The difference in Pn among leaves was small when the PPFD was low, and more remarkable with increasing PPFD. The maximum Pn was slightly higher for the group at 10 days old (about 3~4 days after full expansion) than that at 5 days old, and then decreased gradually with increasing leaf age. The highest maximum Pn was approximately 34.89 μmol m−2 s−1 for leaf at 10 days old, it was 3.4 times that for leaf at 55 days old. The similar pattern of PLR curves was reported on cotton by Echer et al.33, who showed little effect of leaf age on Pn under low PPFD condition, and light-specific Pn was higher at 15-d and 30-d-old compared with 45-d and 60-d-old leaves.
Figure 2.
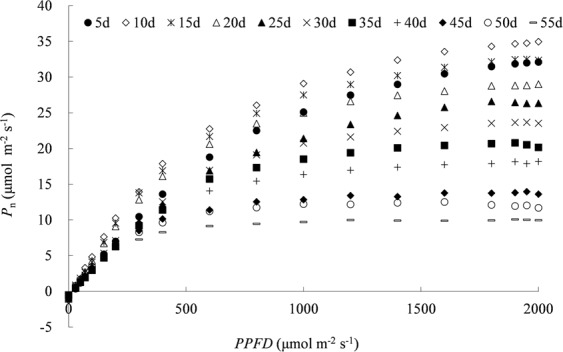
Measured response of net photosynthetic rate (Pn) for rice leaves at various ages to photosynthetic photon flux density (PPFD) (Pn is the average photosynthetic rate for leaf age groups at n day, numbers “n d” in legend indicates the nominal leaf age for each leaf age group with ±2 days span).
Photosynthetic light response parameters
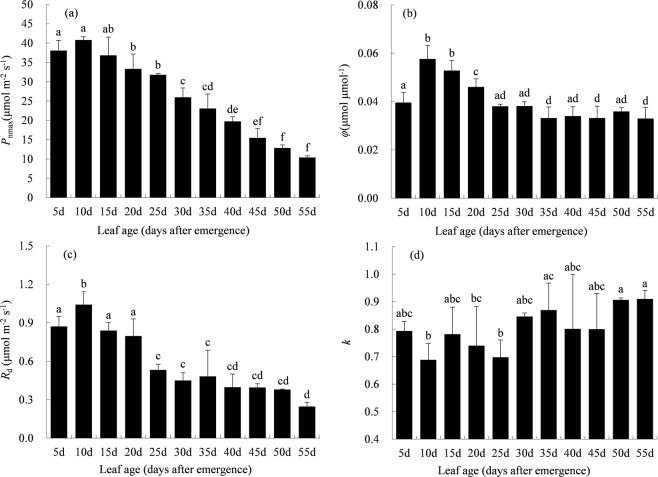
For each of these 37 PLR curves, the NRH equation was fitted separately. The NRH equation performed well in modeling the PLR curves of individual rice leaves. The coefficient of determination (R2) and Nash-Sutcliffe coefficient (NS) were very high (range from 0.9892 to 0.9997 and from 0.9844 to 0.9997), and errors were very low (average absolute error (AE) and root mean square error (RMSE) range from 0.139 to 0.768 μmol m−2 s−1 and from 0.091 to 0.709 μmol m−2 s−1). Among leaf age groups, the parameters of Pnmax, φ and Rd initially increased, reached the maximum for group at 10 days old, then decreased subsequently. The maximum of Pnmax, φ and Rd were 40.6 μmol m−2 s−1, 0.0561 μmol μmol −1 and 1.06 μmol m−2 s−1, respectively. Yet, no clear tendency was found in the parameter of k along with leaf age (Fig. 3).
Figure 3.
Parameters of (a) light-saturated net photosynthetic rate (Pnmax), (b) quantum yield of assimilation (φ), (c) dark respiration rate (Rd), and (d) convexity of the curve (k) for leaves at different age groups (different letters mean significant difference at p < 0.05 level with the least significant difference test).
Correlations between parameters in non-rectangular hyperbola and leaf Age
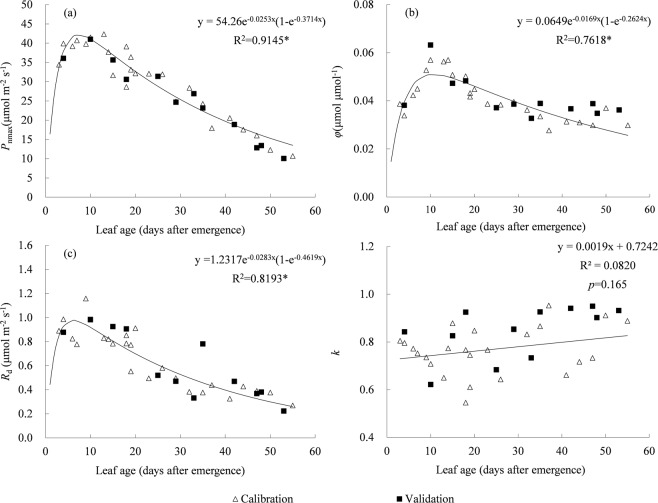
To describe the relationships between NRH parameters and leaf age, scatter plots and regressions between NRH parameters for each individual leaf and its leaf age, based on 25 independent PLR curves (calibration data), were shown in Fig. 4. The Pnmax, φ, Rd and k were found varying in a wide range of 10.07–42.38 μmol m−2 s−1, 0.0277–0.0570 μmol μmol−1, 0.27–1.16 μmol m−2 s−1 and 0.5460–0.9529, respectively. The parameters of Pnmax, φ and Rd were highly correlated with leaf age. The Pnmax varied in two distinct phases, it increased rapidly to a maximum around 10 days after leaf emergence, and then declined linearly to about 10 μmol m−2 s−1 at 53 days old (Fig. 4a). The φ and Rd varied in the same pattern with Pnmax (Fig. 4b,c). The parameters of Pnmax, φ and Rd could be fitted using a positive skew equation with respect to leaf age. For parameter of k, it increased linearly with leaf age (Fig. 4d), but the linear relationship was insignificant (p = 0.165). Intuitively, the validation data (the other 12 independent PLR data) matched these curves very well (Fig. 4).
Figure 4.
Regressions of (a) light-saturated net photosynthetic rate (Pnmax), (b) quantum yield of assimilation (φ), (c) dark respiration rate (Rd), and (d) convexity of the curve (k) with leaf age. (asterisk means significant relationship at p < 0.001 confidence level with F-test).
Similarly, the Pnmax for cotton got the maximum at 10–15 days after leaf unfolding and then declined linearly with leaf aging34. Stirling et al.35 also reported Pnmax for maize varied in a similar pattern along with thermal time (effective temperature accumulated along with time). Meanwhile, the results were quite different for parameters of φ and k. The φ varied independently to thermal time for maize35, yet it varied in a positive skew pattern for cotton34 and rice (in the current result). For parameter of k, it was found varied independently to leaf age of rice, yet it was reported varied downward parabolically for maize35.
Generally, leaf photosynthesis was highly related to leaf chlorophyll contents22. For rice, leaf SPAD increased rapidly to the maximum since leaf emergence, and kept constant at the high level for a long time during 10–40 days after leaf emergence (Fig. 1). While the variation of Pnmax did not match leaf SPAD very well, the Pnmax got the maximum and then declined although the leaf SPAD was still high (Fig. 4a). It implied that leaf traits other than chlorophyll content, including leaf structural features (thickness, mesophyll cell) and functional traits (transpiration rate, mesophyll conductance, stomatal conductance), were also highly correlated with crop photosynthetic capacity36,37, and changed with leaf age28,38. During leaf expansion period, the pigment contents increased, photosynthetic enzymes were formed, and their activities increased sharply together with the efficiencies of radiant energy utilization, electron transport chain and photophosphorylation. As a result, the Pnmax increased. But in senescing period, Pnmax decreased due to the decrease in stomatal conductance, chlorophyll content, enzyme activities, etc39. It indicated that leaf age might be more important than leaf chlorophyll level in determining temporal variation of leaf photosynthetic capacity.
General NRH model considering effect of leaf age
As illustrated in Fig. 4, Pnmax, φ and Rd varied following the positive skew patterns with respect to leaf age. Equations (1–3) were used to describe the trends of Pnmax, φ and Rd for leaves at various ages. Then a general NRH model was constructed by incorporating the Eqs. (1–3) into the NRH equation (Eq. (4) in Methods).
| 1 |
| 2 |
| 3 |
where A is leaf age; the parameters of Pnopt, φopt, and Rdopt represent the optimal Pnmax, φ, Rd; and d1, d 2, d 3, d4, d5, d6 are coefficients. The parameters and coefficients were determined by nonlinear least-square fitting based on calibration data in Fig. 4a–c. The parameters of Pnopt, φnopt and Rdopt were calibrated as 54.26 μmol m−2 s−1, 0.0649 μmol μmol−1 and 1.2317 μmol m−2 s−1, and the coefficients of d1, d2, d3, d4, d5, d6 were determined as 0.0253, 0.3714, 0.0169, 0.2624, 0.0283 and 0.4619, respectively. The value of k was averaged as 0.7685 (Fig. 4d).
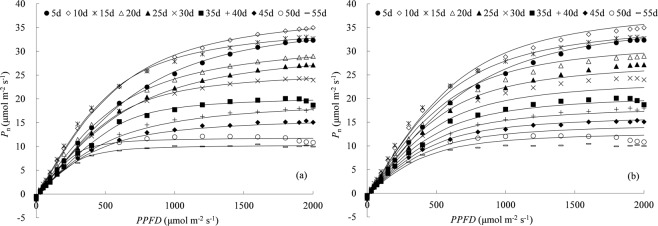
Both the NRH and general NRH equations were used to predict PLR curves over the entire range of leaf age based on each of those 25 PLR curves (calibration data) as shown in Fig. 5 and Table 1. The results indicated that the general NRH equation performed slightly inferior to the NRH equation. The average RMSE and AE were 0.902 and 0.886 μmol m−2 s−1 for Pn calculated by the general NRH equation, higher than the errors by the NRH equation (0.338 and 0.324 μmol m−2 s−1 averagely). The fitted results showed that the general NRH equation described Pn well for leaves younger than 20 days old, whereas slightly underestimated Pn for about 25–40 days old leaves and overestimated Pn for leaves older than 45 days old. Generally, good agreement was obtained between estimated and observed Pn, and the general NRH equation could describe all individual PLR curves, with the R2 and NS ranging from 0.928 to 0.999 and from 0.873 to 0.998.
Figure 5.
Net photosynthetic rates (Pn) calculated by (a) the non-rectangular hyperbola (NRH) and (b) the general NRH equation for calibration data. Lines represent the modelled Pn, symbols are the observed Pn (“n d” in legend is the nominal leaf age for each leaf age group with ±2 days span).
Table 1.
Performance of the non-rectangular hyperbola (NRH) and general NRH equations in predicting photosynthetic light response (PLR).
| Leaf age /d | Calibration data | Validation data | |||||||||||||
|---|---|---|---|---|---|---|---|---|---|---|---|---|---|---|---|
| NRH equation | General NRH equation | General NRH equation | |||||||||||||
| k | R2 | NS | RMSE | AE | k | R2 | NS | RMSE | AE | k | R2 | NS | RMSE | AE | |
| μmol m−2 s−1 | μmol m−2 s−1 | μmol m−2 s−1 | |||||||||||||
| 3~7 | 0.998 | 0.999 | 0.999 | 0.360 | 0.287 | 1.016 | 0.990 | 0.988 | 1.295 | 1.040 | 0.996 | 1.000 | 1.000 | 0.239 | 0.203 |
| 8~12 | 0.999 | 0.999 | 0.999 | 0.383 | 0.293 | 1.016 | 0.995 | 0.994 | 0.996 | 0.779 | 1.004 | 0.994 | 0.994 | 1.046 | 0.847 |
| 13~17 | 0.997 | 0.998 | 0.998 | 0.511 | 0.401 | 0.983 | 0.989 | 0.987 | 1.415 | 1.168 | 1.012 | 0.999 | 0.999 | 0.424 | 0.351 |
| 18~22 | 0.994 | 0.998 | 0.998 | 0.379 | 0.370 | 1.026 | 0.982 | 0.975 | 1.066 | 1.093 | 0.993 | 0.989 | 0.988 | 1.251 | 1.026 |
| 23~27 | 0.987 | 0.999 | 0.998 | 0.227 | 0.385 | 0.975 | 0.996 | 0.994 | 0.409 | 0.607 | 1.011 | 0.992 | 0.992 | 0.881 | 0.621 |
| 28~32 | 0.999 | 0.999 | 0.999 | 0.309 | 0.228 | 0.918 | 0.980 | 0.965 | 1.494 | 1.122 | 1.000 | 0.999 | 0.999 | 0.249 | 0.194 |
| 33~37 | 0.998 | 0.995 | 0.994 | 0.551 | 0.365 | 0.968 | 0.967 | 0.967 | 1.424 | 1.070 | 0.937 | 0.986 | 0.975 | 1.025 | 0.906 |
| 38~42 | 0.978 | 0.999 | 0.997 | 0.123 | 0.314 | 0.975 | 0.999 | 0.997 | 0.123 | 0.286 | 0.881 | 0.986 | 0.937 | 1.784 | 1.534 |
| 43~47 | 0.972 | 0.999 | 0.996 | 0.156 | 0.321 | 1.010 | 0.998 | 0.998 | 0.271 | 0.222 | 1.072 | 0.919 | 0.853 | 1.772 | 1.553 |
| 48~52 | 0.995 | 0.989 | 0.989 | 0.458 | 0.399 | 1.069 | 0.928 | 0.873 | 0.123 | 1.278 | 1.057 | 0.963 | 0.936 | 0.189 | 1.062 |
| 53~57 | 0.997 | 0.995 | 0.995 | 0.261 | 0.196 | 1.116 | 0.959 | 0.880 | 1.310 | 1.086 | 1.157 | 0.889 | 0.657 | 2.050 | 1.803 |
| Average | 0.992 | 0.997 | 0.997 | 0.338 | 0.324 | 1.007 | 0.980 | 0.965 | 0.902 | 0.886 | 1.011 | 0.974 | 0.939 | 0.992 | 0.918 |
k, R2, NS, RMSE and AE denote slope of linear regression, coefficients of determination, Nash-Sutcliffe coefficient, root mean square error and average absolute error of net photosynthetic rates calculated based on the NRH and general NRH equations.
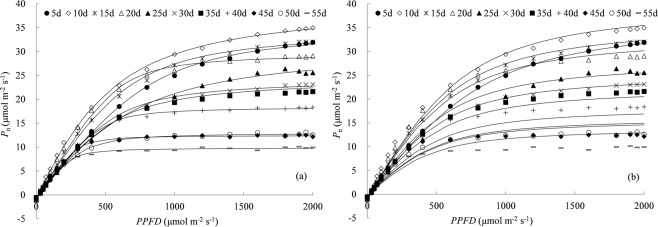
The other 12 PLR curves were calculated for validating the general NRH equation (Fig. 6 and Table 1). The average RMSE and AE were 0.992 and 0.918 μmol m−2 s−1 for validation of the general NRH equation, were similar to those for calibration data. The general NRH equation was capable enough of accounting the effect of leaf age on leaf photosynthesis trait, and could provide an easy way for simulating the PLR for all leaves at various ages with one set of parameters (as listed in Fig. 7). That offers a novel tool to understand variation of rice leaf photosynthetic traits along with leaf aging. Connecting the general NRH model with canopy light distribution40, will offer a mechanism-based method to upscale leaf photosynthesis to canopy scale. The general NRH model also provides a tool for simulating leaf photosynthesis continuously along with leaf aging by integrating it with leaf development model.
Figure 6.
Net photosynthetic rates (Pn) calculated by (a) the non-rectangular hyperbola (NRH) and (b) the general NRH equation for validation data. Lines represent the modelled Pn, symbols are the observed Pn (“n d” in legend is the nominal leaf age for each leaf age group with ±2 days span).
Figure 7.
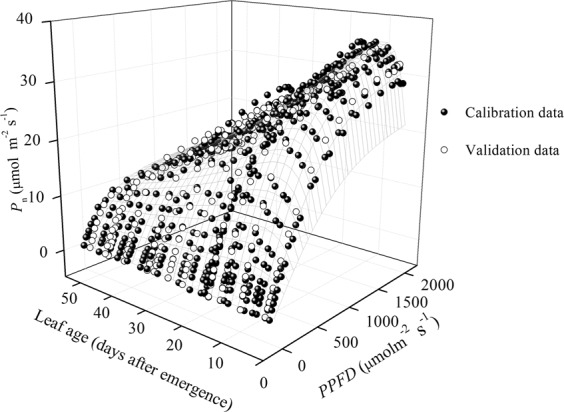
Net photosynthetic rates (Pn) estimated by the general non-rectangular hyperbola (NRH) equation for rice leaves at various ages under different photosynthetic photon flux density (PPFD) conditions.
Conclusions
Leaf age accounted for significant variation in response of net photosynthesis rates (Pn) to light intensity. The parameters of light-saturated net photosynthetic rate (Pnmax), quantum yield of assimilation (φ) and dark respiration rate (Rd) in the non-rectangular hyperbola (NRH) equation were highly correlated with leaf age, whereas convexity of curve (k) was not. The parameters of Pnmax, φ and Rd initially increased rapidly to a maximum around 10 days after leaf emergence, and then declined linearly with leaf age. The general NRH, which incorporated the quantitative correlations of leaf age with the parameters of Pnmax, φ and Rd into the NRH equation, could provide a mechanistic method for simulating the photosynthetic light response curve for all leaves at various ages with one set of parameters, which will be useful for upscaling leaf photosynthesis model to canopy scale mechanically or simulating leaf photosynthesis continuously along with leaf aging.
Methods
Data collection
Three latest emerged leaves of rice (variety of Japonica Rice NJ46) were tagged at two-day intervals for different plants in jointing and booting stage for leaf age measurement, and leaf age was termed as the days after emergence. Thirty-seven PLR curves from 37 individual plants were obtained from 1st August to 15th September by a photosynthesis system (LI-6800; LI-COR, Lincoln, NE, USA) equipped with a red/blue LED light source (LI6800-02B) at 19 PPFD levels (namely 2000, 1950, 1900, 1800, 1600, 1400, 1200, 1000, 800, 600, 400, 300, 200, 150, 100, 70, 50, 30 and 0 μmol m−2 s−1), at leaf temperature of 30 °C, relative humidity of 70%, and CO2 concentration of 400 μmol mol−1. Simultaneously, leaf SPAD values were measured using the SPAD-502 (Konica Minolta, Japan).
Non-rectangular hyperbola and its general equation
The NRH equation was fitted using a least square regression for every specific PLR curve41
| 4 |
where Pnmax is light-saturated net photosynthetic rate; I is photosynthetic photon flux density; φ is quantum yield of assimilation, which defines the initial slope for the photosynthesis-incident light curve; k is the convexity of the curve; Rd is dark respiration rate. The parameters φ and Rd were calculated using linear regression analysis (Pn to PPFD < 200 μmol m−2 s−1), then Pnmax and k were derived empirically by fitting Eq. (4) to light response data (Pn to PPFD of 0–2000 μmol m−2 s−1)42.
Eq. (4) was first fitted separately for 37 independent PLR curves, resulting in 37 sets of coefficients of the NRH equation. The curves and coefficients were evaluated at various leaf age ranges (five-day interval). Subsequently the correlation of the parameters in the PLR equation with respect to leaf age was constructed using the 25 PLR curves (calibration data) (see Eqs. (1–3)), and were incorporated into the NRH equation to build a general NRH equation. Furthermore, the general NRH equation was validated by the other 12 independent PLR curves (validation data), which were selected randomly with a wide coverage of leaf age out of the 37 curves.
Statistical analysis
The one-way ANOVA with the least significant difference test was used to assess the differences in photosynthetic parameters with a significance level (p) of 0.05. Furthermore, the performance of the NRH and general NRH equations were evaluated by the average absolute error (AE), root mean squared error (RMSE), coefficient of determination (R2) and Nash-Sutcliffe coefficient (NS) (Eqs (5–8)).
| 5 |
| 6 |
| 7 |
| 8 |
where Pncal,i and are the Pn calculated by the NRH or general NRH equation for leaves at i days old and the corresponding average value, Pnobs,i and are the observed Pn for leaves at i days old and the corresponding average value, n is the total number of Pn data.
Supplementary information
Acknowledgements
This work was supported by the National Key Technology R&D Program (2016YFC0400103); the Fundamental Research Funds for the Central Universities (2018B40614, 2018B00414); the Natural Science Foundation of Jiangsu Province (BK20180506).
Author Contributions
J.Z.X. conceived and designed the experiments, Q.W. and X.Y.L. performed the experiments, Y.P.L. and S.H.Y. analyzed the data and wrote the paper, L.X.L. edited the paper, and J.Z.X. and Z.M.Q. revised the manuscript. All authors reviewed the manuscript.
Data Availability
All data generated during and analyzed during this study are included in this published article (and its Supplementary Information Files).
Competing Interests
The authors declare no competing interests.
Footnotes
Publisher’s note: Springer Nature remains neutral with regard to jurisdictional claims in published maps and institutional affiliations.
Supplementary information
Supplementary information accompanies this paper at 10.1038/s41598-019-46248-y.
References
- 1.Farquhar GD, Caemmerers S, Berry A. A biochemical model of photosynthetic CO2 assimilation in leaves of C3 species. Planta. 1980;149:78–90. doi: 10.1007/BF00386231. [DOI] [PubMed] [Google Scholar]
- 2.Sharp RE, Matthews MA, Boyer JS. Kok effect and the quantum yield of photosynthesis: light partially inhibits dark respiration. Plant Physiol. 1984;75:95–101. doi: 10.1104/pp.75.1.95. [DOI] [PMC free article] [PubMed] [Google Scholar]
- 3.Lachapelle PP, Shipley B. Interspecific prediction of photosynthetic light response curves using specific leaf mass and leaf nitrogen content: effects of differences in soil fertility and growth irradiance. Ann. Bot. 2012;109:1149–1157. doi: 10.1093/aob/mcs032. [DOI] [PMC free article] [PubMed] [Google Scholar]
- 4.Qian T, Elings A, Dieleman JA, Gort G, Marcelis LFM. Estimation of photosynthesis parameters for a modified Farquhar-von Caemmerer-Berry model using simultaneous estimation method and nonlinear mixed effects model. Environ. Exp. Bot. 2012;82:66–73. doi: 10.1016/j.envexpbot.2012.03.014. [DOI] [Google Scholar]
- 5.Flanagan LB, Sharp EJ, Gamon JA. Application of the photosynthetic light-use efficiency model in a northern Great Plains grassland. Remote Sens. Environ. 2015;168:239–251. doi: 10.1016/j.rse.2015.07.013. [DOI] [Google Scholar]
- 6.Lobo FdeA, et al. Fitting net photosynthetic light-response curves with Microsoft Excel - a critical look at the models. Photosynthetica. 2013;51:445–456. doi: 10.1007/s11099-013-0045-y. [DOI] [Google Scholar]
- 7.Murchie EH, Hubbart S, Chen YZ, Peng SB, Horton P. Acclimation of Rice Photosynthesis to Irradiance under Field Conditions. Plant Physiol. 2002;130:1999–2010. doi: 10.1104/pp.011098. [DOI] [PMC free article] [PubMed] [Google Scholar]
- 8.Matsuda R, Ohashi-Kaneko K, Fujiwara K, Goto E, Kurata K. Photosynthetic characteristics of rice leaves grown under red light with or without supplemental blue light. Plant Cell Physiol. 2004;45:1870–1874. doi: 10.1093/pcp/pch203. [DOI] [PubMed] [Google Scholar]
- 9.Kitajima K, Mulkey SS, Wright SJ. Seasonal Leaf Phenotypes in the Canopy of a Tropical Dry Forest: Photosynthetic Characteristics and Associated Traits. Oecologia. 1997;109:490–498. doi: 10.1007/s004420050109. [DOI] [PubMed] [Google Scholar]
- 10.Pettersen RI, Torre S, Gislerod HR. Effects of leaf aging and light duration on photosynthetic characteristics in a cucumber canopy. Sci. Hortic. 2010;125:82–87. doi: 10.1016/j.scienta.2010.02.016. [DOI] [Google Scholar]
- 11.Peri PL, Arena M, Martínez Pastur G, Lencinas MV. Photosynthetic response to different light intensities, water status and leaf age of two Berberis, species (Berberidaceae) of Patagonian steppe, Argentina. J. Arid. Environ. 2011;75:1218–1222. doi: 10.1016/j.jaridenv.2011.06.003. [DOI] [Google Scholar]
- 12.Keenan TF, Niinemets Ü. Global leaf trait estimates biased due to plasticity in the shade. Nat. Plants. 2016;3:16201. doi: 10.1038/nplants.2016.201. [DOI] [PubMed] [Google Scholar]
- 13.Zheng SX, Shangguan ZP. Spatial Patterns of Photosynthetic Characteristics and Leaf Physical Traits of Plants in the Loess Plateau of China. Plant Ecol. 2007;191:279–293. doi: 10.1007/s11258-006-9242-0. [DOI] [Google Scholar]
- 14.Marino G, Aqil M, Shipley B. The leaf economics spectrum and the prediction of photosynthetic light-response curves. Funct. Ecol. 2010;24:263–272. doi: 10.1111/j.1365-2435.2009.01630.x. [DOI] [Google Scholar]
- 15.Ambavaram MMR, et al. Coordinated regulation of photosynthesis in rice increases yield and tolerance to environmental stress. Nature. 2014;5:93–93. doi: 10.1038/ncomms6302. [DOI] [PMC free article] [PubMed] [Google Scholar]
- 16.Sun JL, Ye M, Peng SB, Li Y. Nitrogen can improve the rapid response of photosynthesis to changing irradiance in rice (Oryza sativa L.) plants. Sci. Rep. 2016;6:31305. doi: 10.1038/srep31305. [DOI] [PMC free article] [PubMed] [Google Scholar]
- 17.Kull O, Kruijt B. Leaf photosynthetic light response: A mechanistic model for scaling photosynthesis to leaves and canopies. Funct. Ecol. 2010;12:767–777. doi: 10.1046/j.1365-2435.1998.00257.x. [DOI] [Google Scholar]
- 18.Hasegawa T, et al. Causes of variation among rice models in yield response to CO2 examined with Free-Air CO2 Enrichment and growth chamber experiments. Sci. Rep. 2017;7:14858. doi: 10.1038/s41598-017-13582-y. [DOI] [PMC free article] [PubMed] [Google Scholar]
- 19.Xiong D, et al. SPAD-based leaf nitrogen estimation is impacted by environmental factors and crop leaf characteristics. Sci. Rep. 2015;5:13389. doi: 10.1038/srep13389. [DOI] [PMC free article] [PubMed] [Google Scholar]
- 20.Yang H, et al. Effects of nitrogen application rate and leaf age on the distribution pattern of leaf SPAD readings in the rice canopy. PloS One. 2014;9:88421. doi: 10.1371/journal.pone.0088421. [DOI] [PMC free article] [PubMed] [Google Scholar]
- 21.Uddling J, Gelang-Alfredsson J, Piikki K, Pleijel H. Evaluating the relationship between leaf chlorophyll concentration and SPAD-502 chlorophyll meter readings. Photosynth. Res. 2007;91:37–46. doi: 10.1007/s11120-006-9077-5. [DOI] [PubMed] [Google Scholar]
- 22.Xu JZ, Yu YM, Peng SZ, Yang SH, Liao LX. A modified nonrectangular hyperbola equation for photosynthetic light-response curves of leaves with different nitrogen status. Photosynthetica. 2014;52:117–123. doi: 10.1007/s11099-014-0011-3. [DOI] [Google Scholar]
- 23.Legner N, Fleck S, Leuschner C. Within-canopy variation in photosynthetic capacity, SLA and foliar N in temperate broad-leaved trees with contrasting shade tolerance. Trees-Struct. Funct. 2014;28:263–280. doi: 10.1007/s00468-013-0947-0. [DOI] [Google Scholar]
- 24.Scoffoni C, et al. Hydraulic basis for the evolution of photosynthetic productivity. Nat. Plants. 2016;2:16072. doi: 10.1038/nplants.2016.72. [DOI] [PubMed] [Google Scholar]
- 25.Hirooka Y, Homma K, Shiraiwa T. Parameterization of the vertical distribution of leaf area index (LAI) in rice (Oryza sativa L.) using a plant canopy analyzer. Sci. Rep. 2018;8:6387. doi: 10.1038/s41598-018-24369-0. [DOI] [PMC free article] [PubMed] [Google Scholar]
- 26.Kitajima K, Mulkey SS, Wright SJ. Decline of Photosynthetic Capacity with Leaf Age in Relation to Leaf Longevities for Five Tropical Canopy Tree Species. Am. J. Bot. 1997;84:702–708. doi: 10.2307/2445906. [DOI] [PubMed] [Google Scholar]
- 27.Kitajima K, Mulkey SS, Samaniego M, Wright SJ. Decline of photosynthetic capacity with leaf age and position in two tropical pioneer tree species. Am. J. Bot. 2002;89:1925–1932. doi: 10.3732/ajb.89.12.1925. [DOI] [PubMed] [Google Scholar]
- 28.Xie SX, Luo XS. Effect of leaf position and age on anatomical structure, photosynthesis, stomatal conductance and transpiration of Asian pear. Bot. Bull. Acad. Sinica. 2003;44:297–303. [Google Scholar]
- 29.Warren CR. Why does photosynthesis decrease with needle age in Pinus pinaster? Trees-Struct. Funct. 2006;20:157–164. doi: 10.1007/s00468-005-0021-7. [DOI] [Google Scholar]
- 30.Rajaona AM, Brueck H, Asch F. Leaf Gas Exchange Characteristics of Jatropha as Affected by Nitrogen Supply, Leaf Age and Atmospheric Vapour Pressure Deficit. J. Agron. Crop Sci. 2013;199:144–153. doi: 10.1111/jac.12000. [DOI] [Google Scholar]
- 31.Wang D, et al. Relationship between Rubisco activase isoform levels and photosynthetic rate in different leaf positions of rice plant. Photosynthetica. 2009;47:621–629. doi: 10.1007/s11099-009-0089-1. [DOI] [Google Scholar]
- 32.Jin SH, et al. Characteristic of gas exchange and chlorophyll fluorscence in different position leaves at booting stage in rice plants. Rice Sci. 2004;11:283–289. [Google Scholar]
- 33.Echer FR, Rosolem CA. Cotton leaf gas exchange responses to irradiance and leaf aging. Biol. Plant. 2015;59:366–372. doi: 10.1007/s10535-015-0484-3. [DOI] [Google Scholar]
- 34.Raja Reddy K, Kakani VG, Zhao D, Mohammed AR, Gao W. Cotton responses to ultraviolet-B radiation: experimentation and algorithm development. Agric. For. Meteorol. 2003;120:249–265. doi: 10.1016/j.agrformet.2003.08.029. [DOI] [Google Scholar]
- 35.Stirling CM, Aguilera C, Baker NR, Long SP. Changes in the photosynthetic light response curve during leaf development of field grown maize with implications for modeling canopy photosynthesis. Photosynth. Res. 1994;42:217–225. doi: 10.1007/BF00018264. [DOI] [PubMed] [Google Scholar]
- 36.Giuliani R, et al. Coordination of Leaf Photosynthesis, Transpiration, and Structural Traits in Rice and Wild Relatives (Genus Oryza) Plant Physiol. 2013;162:1632–1651. doi: 10.1104/pp.113.217497. [DOI] [PMC free article] [PubMed] [Google Scholar]
- 37.Retta M, et al. Impact of anatomical traits of maize (Zea mays L.) leaf as affected by nitrogen supply and leaf age on bundle sheath conductance. Plant Sci. 2016;252:205–214. doi: 10.1016/j.plantsci.2016.07.013. [DOI] [PubMed] [Google Scholar]
- 38.Pantin F, Simonneau T, Muller B. Coming of leaf age: control of growth by hydraulics and metabolics during leaf ontogeny. New Phytol. 2012;196:349–366. doi: 10.1111/j.1469-8137.2012.04273.x. [DOI] [PubMed] [Google Scholar]
- 39.Shirke PA. Leaf Photosynthesis, Dark Respiration and Fluorescence as Influenced by Leaf Age in an Evergreen Tree, Prosopis Juliflora. Photosynthetica. 2001;39:305–311. doi: 10.1023/A:1013761410734. [DOI] [Google Scholar]
- 40.Retkute R, Townsend AJ, Murchie EH, Jensen OE, Preston SP. Three-dimensional plant architecture and sunlit-shaded patterns: a stochastic model of light dynamics in canopies. Ann. Bot. 2018;122:291–302. doi: 10.1093/aob/mcy067. [DOI] [PMC free article] [PubMed] [Google Scholar]
- 41.von Caemmerer, S. Biochemical models of leaf photosynthesis. CSIRO Publishing, Collingwood, Australia (2000).
- 42.Gomes FP, Oliva MA, Mielke MS, de Almeida AAF, Leite HG. Photosynthetic irradiance-response in leaves of dwarf coconut palm (Cocos nucifera L. ‘nana’, Arecaceae): Comparison of three models. Sci. Hortic. 2006;109:101–105. doi: 10.1016/j.scienta.2006.02.030. [DOI] [Google Scholar]
Associated Data
This section collects any data citations, data availability statements, or supplementary materials included in this article.
Supplementary Materials
Data Availability Statement
All data generated during and analyzed during this study are included in this published article (and its Supplementary Information Files).


