

Abstract
Background:
Influenza results in up to 500,000 deaths annually. Seasonal influenza vaccines have an estimated 60% effectiveness, but provide little or no protection against novel subtypes, and may be less protective in high-risk groups. Neuraminidase inhibitors are recommended for the treatment of severe influenza infection, but are not proven to reduce mortality in severe disease. Preclinical models of severe influenza infection that closely correlate to human disease are needed to assess efficacy of new vaccines and therapeutics.
Methods:
We developed a nonhuman primate model of influenza and bacterial co-infection that re-capitulates severe pneumonia in humans. Animals were infected with influenza A virus via intra-bronchial or small-particle aerosol inoculation, methicillin-resistant Staphylococcus aureus, or co-infected with influenza and methicillin-resistant S. aureus combined. We assessed the severity of disease in animals over the course of our study using tools available to evaluate critically ill human patients including high-resolution computed tomography imaging of the lungs, arterial blood gas analyses, and bronchoalveolar lavage.
Results:
Using an intra-bronchial route of inoculation we successfully induced severe pneumonia following influenza infection alone and following influenza and bacterial co-infection. Peak illness was observed at day 6 post-influenza infection, manifested by bilateral pulmonary infiltrates and hypoxemia. The timing of radiographic and physiologic manifestations of disease in our model closely match those observed in severe human influenza infection.
Discussion:
This was the first nonhuman primate study of influenza and bacterial co-infection where high-resolution computed tomography scanning of the lungs was used to quantitatively assess pneumonia over the course of illness and where hypoxemia was correlated with pneumonia severity. With additional validation this model may serve as a pathway for regulatory approval of vaccines and therapeutics for the prevention and treatment of severe influenza pneumonia.
Keywords: Influenza, Co-infection, Pneumonia, Vaccines, Therapies
1. Introduction
An estimated 5–10% of adults and 20–30% of children are infected with influenza globally each year. Severe illness occurs predominantly in high-risk groups (the very young, elderly, and those with premorbid conditions) affecting an estimated 3–5 million people resulting in an estimated 250,000–500,000 deaths annually (World Health Organization, 2015). The 1918 influenza pandemic caused an estimated 50 million deaths worldwide, disproportionately affecting young adults (World Health Organization, 2015). Zoonotic avian influenza (e.g., H5N1 and H7N9) causes infrequent although highly lethal human infections and poses risk for a severe pandemic (Su et al., 2015).
Seasonal influenza vaccines have an estimated 60% effectiveness, but provide little or no protection against novel influenza subtypes, and may be less protective in high-risk groups. Neuraminidase inhibitors (NAIs) are recommended for the treatment of severe influenza infection, but are not proven to reduce mortality in severe disease. Recent meta-analysis of observational data suggest early initiation of NAl therapy, within 5-days of symptom onset, is associated with reduced mortality (Muthuri et al., 2014). However, patients with severe influenza infection typically present to the hospital after 5-days of symptoms and experience high case-fatality (Rice et al., 2012).
New vaccines and therapies are needed to prevent and treat severe influenza illness. Efficacy of interventions must be assessed accounting for the impact of bacterial co-infection that commonly contributes to mortality (Morens et al., 2008). Clinical trials of influenza vaccine or therapeutic efficacy do not typically evaluate severe disease as a clinical endpoint, largely due to the expense required to adequately power such studies. Highly pathogenic strains of influenza and severe disease cannot be assessed in human challenge experiments for obvious ethical reasons. Preclinical models of severe influenza infection that closely correlate with the natural history of disease in humans are needed to assess efficacy of vaccines and therapeutics. Showing benefit of interventions in permissive small animals (mice and ferrets) that are genetically and phenotypically distinct from humans may not adequately translate to benefit in humans.
Nonhuman primates are naturally, and may be experimentally, infected with human influenza viruses (Davis et al., 2015). Seasonal influenza infection in most nonhuman primate species results in mild or subclinical illness, reflective of self-limited disease observed in otherwise healthy humans. inoculation of influenza into the lower airways of nonhuman primates induces more severe disease than upper airway inoculation or exposure via small particle aerosol (Davis et al., 2015). Bacterial infection following intra-tracheal influenza infection has been evaluated in four nonhuman primate studies since 1954 (Berendt, 1974; Berendt et al., 1975; Kobayashi et al., 2013; Miyake et al., 2010). In three of the four studies co-infection resulted in more severe bronchopneumonia than viral infection alone.
We sought to develop a nonhuman primate model of influenza and bacterial co-infection that recapitulates severe disease in humans. Severe influenza infection in humans is typically manifested by bilateral bronchopneumonia resulting in hypoxemia. Animals were infected with influenza inoculated directly into bilateral main-stem bronchi, to maximize lower respiratory tract disease. Decades of experimental observations show that intra-nasal inoculation induces only mild illness in both otherwise healthy nonhuman primate and human subjects. Co-infected animals were inoculated with bacteria into the lower airways at four days post-influenza infection. The timing of co-infection in our study closely approximates estimated timing of co-infection in human cases of severe influenza infection (Rice et al., 2012). Influenza A/Swine/lowa/31 (Sw31) was selected as a surrogate for the 1918 pandemic influenza virus in this study based on close genetic homology and similar pathogenesis in mice and ferrets (Memoli et al., 2009). Methicillin-resistant Staphylococcus aureus (MRSA) was selected as a clinically relevant bacterial co-pathogen.
We also evaluated the role of aerosolized influenza with and without bacterial co-infection in this study. Few historical data exist to inform the impact of aerosolized influenza on the development of severe pneumonia in the setting of bacterial co-infection. We sought to fill this knowledge gap. We assessed the severity of disease in animals over the course of our study using tools available to evaluate critically ill human patients. These included high-resolution computed tomography (CT) imaging of the lungs, arterial blood gas analyses, and bronchoalveolar lavage (BAL).
2. Methods
2.1. Inoculations
Eighteen male juvenile rhesus macaques (4–8 kg) of Indian origin without detectable pre-existing influenza A antibody titers were randomly assigned to one of six study groups (see Table 1, Supplementary Table 1). Staff that assigned animals to groups were blinded to the intervention (i.e., pathogen and inoculation route) designated for that group. Viral stocks of Influenza A/Swine/lowa/31 (Sw31) were grown in Madin–Darby canine kidney (MDCK) cells, harvested, purified on a sucrose cushion, and stored at −80 °C. Viral titers were assessed by plaque assay technique (Qi et al., 2009). MRSA (strain USA300) was grown in tryptic soy broth (TSB) from frozen glycerol stocks until mid-log phase growth was achieved. The desired number of bacteria were pelleted, washed, and diluted in 4 mL of sterile saline immediately prior to inoculation. Bacterial titers were confirmed by serial dilution of samples on TSB agar plates Table 1.
Table 1.
Back-titration results for influenza and bacterial challenge inoculum.
| Experimental group | Delivered inoculum (mean ± standard deviation) | |
|---|---|---|
| Sw31 (PFU/animal) | MRSA (CFU/animal) | |
| 1: Saline | X | X |
| 2: MRSA | X | 1.20 × 10⁹ ± 4.00 × 10⁸ |
| 3: Sw31 IB | 2.06 × 10⁶ ± 1.30 × 10⁶ | X |
| 4: Sw31 IB + MRSA | 2.11 × 10⁶ ±3.15 × 10⁵ | 1.33 × 10⁹ ± 3.8 × 10⁸ |
| 5: Sw31 aero | 6.15 × 10⁶ ± 4.86 × 10⁵ | X |
| 6: Sw31 aero + MRSA | 6.21 × 10⁶ ± 3.85 ×10⁶ | 8.88 × 10⁸ ± 1.25 × 10⁸ |
Intra-bronchial (IB) inoculations were performed under ketamine anesthesia using a pediatric bronchoscope advanced into the airway of seated upright animals (see experimental timeline, Fig. 1). A target IB viral inoculum of 5 × 10⁶ plaque forming units (pfu) was diluted in 4 mL of saline and administered in equal proportions into the right and left main stem bronchus. A target IB bacterial inoculum of 1 × 10⁹ colony forming units (cfu) was similarly administered. A target aerosol viral inoculum of 5 × 10⁶ pfu was administered as previously described (Johnson et al., 2015). All animal procedures were approved by the National Institute of Allergy and Infectious Diseases (NIAID) Division of Clinical Research Animal Care and Use Committee, and adhered to National Institutes of Health (NIH) policies. The experiments were carried out at the NIAID Integrated Research Facility, an AAALAC and AALAS accredited facility.
Fig. 1. Study timeline and viral RNA copy number in bronchoalveolar lavage.

A) Inoculation schedule. B) Viral RNA copy number in bronchoalveolar lavage from influenza inoculated groups. Data are represented as box plots showing median values (bar) and range (box). Comparison between groups was assessed by two-way ANOVA and significance testing by Tukey’s test, *p < 0.05.
2.2. Procedures
Physical exams, vital sign measurements, and venous and arterial blood draws were performed every other day and BALs were performed every fourth day under ketamine anesthesia. Arterial blood was collected by puncture of the femoral artery under direct ultrasound guidance at atmospheric pressure and samples were immediately loaded onto the iSTAT® (Abbott laboratories) for bedside blood gas analysis. BALs were performed by advancing a sterile pediatric bronchoscope into the right lower lobe of an upright animal, instilling four 10 mL aliquots (40 mL total) of sterile saline into the distal lung segment, and aspirating BAL fluid into a sterile trap.
2.3. Laboratory testing
Complete blood counts (CBC) with differentials and comprehensive blood chemistries were performed on venous blood samples collected in ethylenediaminetetraacetic acid (EDTA)-coated blood tubes using a Sysmex XT2000V™ (Sysmex America, IL USA) and the Piccolo Xpress® (Abbott laboratories).
Quantitative real-time PCR (RT-PCR) was used to determine the viral copy numbers in BAL samples from all groups. Total RNA was extracted from 100 μL aliquots of BAL using standard TRIzol chloroform extraction. Reverse transcription of total RNA was performed with primers specific for swine H1N1 HA sequence using the Superscript III first-strand cDNA synthesis kit (Invitrogen, Carlsbad, CA). TaqMan primers and probes were designed using Primer Express 3.0 software (Applied Biosystems, Foster City, CA) and generated the following primers and probe: Swine-691F, 5′ CAGGAGGTTCACTCCAGAAATAG 3′; Swine-787R, 5′ GTGTCTCCGGGTTCTAGTAATG 3′; Probe, 5′ FAM-AGGTCAGGCAGGGAGGATGAACTA-TAMRA 3′. RT-PCR was performed on an Applied Biosystems QuantStudio 6 Flex Real-Time PCR System and each sample was run in duplicate with TaqMan 2X PCR Universal Master Mix (Applied Biosystems) and a 25 μL total reaction volume. Quantification of viral copy number was accomplished by comparison of RT-PCR results to an established external standard of viral copy number.
Cells from BAL were pelleted by centrifugation and re-suspended in 100 μl phosphate buffered saline (PBS) + 2% fetal bovine serum (FBS). Cell aliquots were exposed to a myeloid or lymphoid antibody panel. The myeloid panel contained markers for CD14, Live/Dead Fixable Yellow dead cell stain (Thermo Fisher Scientific, MA, USA), CD3, CD45, HLA-DR, CD11c (BD Biosciences, CA, USA), CD20 (eBioscience Inc. CA, USA), CD66abce (Miltenyi Biotech Inc. CA, USA), and CD163 (Biolegend, CA, USA). The lymphoid panel contained markers for CD3, CD8, CD20, CD16 (BD Biosciences, CA, USA), CD4 (Biolegend, CA, USA), CD14, Live/Dead Fixable Yellow dead cell stain (Thermo Fisher Scientific, MA, USA) and CD 159(NKG2a) (Beckman Coulter, CA, USA). Samples were then fixed and permeabilized using BD Cytofix/Cytoperm solution (BD Biosciences CA, USA) and analyzed on the BD LSR II Fortessa Flow Cytometer. Data were analyzed using FlowJo Software (FlowJo LLC, OR, USA). All cells were gated first as live cells (viability dye negative) and CD45+ and then analyzed further. Myeloid cells were gated by forward and side scatter and monocytes were defined as CD3−CD20−HLA–DR+CD163+. CD3−CD20−CD163− cells were separated by CD66abce+ (neutrophils) or CD11c+ (dendritic cells). Lymphoid cells were gated by forward and side scatter and CD14−. B cells were defined as CD3−CD20+ and NK cells were defined as CD3−NKG2a+. T cells were defined as CD20− and CD4+CD8− or CD4−CD8+. Percentage of each cell type was determined based on all live CD45+ cells.
2.4. High-resolution computed tomography scanning
Animal were intubated, deeply sedated with propofol, and mechanically ventilated on an assist-control volume-cycled ventilator mode. A standard breath-hold maneuver normalizing tidal volume to 8 cc/kg actual body weight was performed immediately prior to CT imaging of lungs using a Philips Gemini 16 slice PET/CT scanner. Lung hyper-intensity and percent change from baseline over time was determined using previously published methods (Solomon et al., 2014).
2.5. Pathology
Detailed necropsies were performed on all animals following euthanasia. Tissues were collected from major organs including multiple lung lobes, preserved in 10% normal-buffered formalin, embedded in paraffin, and 5-μm sections applied to positively charged slides for hematoxylin and eosin staining. Lung lobes were sampled for a qualitative assessment of histopathology. Both “affected” and “unaffected” regions, based upon gross pathologic evaluation, were sampled.
2.6. Statistical analysis
GraphPad Prism 6 was used for all statistical analysis including mean and standard error of the mean (SEM) calculations. Two-way ANOVA was used to detect differences in dependent variables between groups on multiple study days. Tukey’s test was used to assess for significant differences between means with p < 0.05, p < 0.01, p < 0.001, or p < 0.0001.
3. Results
3.1. Influenza and MRSA infection induced mild clinical or subclinical illness
Animals were inoculated with Sw31 or saline on day 0 and MRSA or saline on day +4 (Fig. 1). Viral and bacterial inoculation doses were confirmed by back-titration (Table 1). Group 3 (Sw31 IB) animals had the highest peak viral RNA in lung-lining fluid at day +2 that significantly declined by day +6 (Fig. 1). MRSA was cultured from lung-lining fluid of all 3 animals from Group 4 (Sw31 IB + MRSA) on day +6 but not at later time-points and not from animals in other MRSA-infected groups (Groups 2 and 6).
Clinical scoring to quantify disease severity and early euthanasia criteria are summarized in Supplementary Tables 2 and 3. Animals in groups 3 (Sw31 IB), 4 (Sw31 IB + MRSA), and 6 (Sw31 aero + MRSA) developed self-limited fever to greater >39.7 °C. One animal each from Groups 3 and 4 developed mild cough on day +6 and +7 and two animals from Group 4 developed mild depressed activity on day +6. Less than 5% weight loss was observed in all animals. No clinically significant abnormalities were observed in CBC with differentials or serum chemistries.
3.2. CT imagining of lungs characterized timing and extent of influenza or MRSA pneumonia
Radiographic evidence of pneumonia with focal or multifocal infiltrates was observed in all infected animals in Groups 2 (MRSA), 3 (Sw31 IB), 4 (Sw31 IB + MRSA), and 6 (Sw31 aero + MRSA) but not in animals from Groups 1 (saline IB) or 5 (Sw31 aero) (Fig. 2A). No statistically significant difference was observed in density of radiographic infiltrates on day +2, as measured by percent change in lung hyper-intensity (PCLH) between groups (Fig. 2B). On day +6, PCLH was significantly increased in Group 4 animals (Sw31 IB + MRSA) relative to animals in all other groups, and in group 3 (Sw31 IB) and 6 (Sw31 aero + MRSA) animals relative to animals in Groups 1 (saline) and 5 (Sw31 aero) (Fig. 2B). On day +10, PCLH was significantly increased in Group 4 animals (SW31 IB + MRSA) relative to animals in Groups 1 (saline), 2 (MRSA), and 5 (Sw31 aero) (Fig. 2B). No statistically significant differences in PCLH were observed between groups on day +14 (Fig. 2B).
Fig. 2. High resolution computed tomography imaging of lungs; percent change in lung hyper-intensity over time; and animals that met clinical criteria for acute lung injury.

A) Representative sagittal lung images of animals from each group over time. B) Percent change in lung hyper-intensity for all animals in each group over time. Bar graphs represent group means and SEMs. Comparison between groups was assessed by two-way ANOVA and significance testing by Tukey’s test, *p < 0.05, **p < 0.01, and ****p < 0.0001. C) Animals (individuals dots) that met clinical criteria acute lung injury including arterial partial pressure of oxygen to fraction of inspired oxygen (P:F) ratio < 300 (below dotted line) and bilateral radiographic infiltrates.
3.3. IB influenza with or without MRSA co-infection induced acute lung injury by clinical criteria
The clinical criteria for acute lung injury (ALI) include an arterial partial pressure of oxygen to fraction of inspired oxygen (P: F) ratio <300 in the setting of bilateral pulmonary infiltrates (Bernard et al., 1994). Three animals from Group 3 (Sw31 IB) and two animals from Group 4 (Sw31 IB + MRSA) met clinical criteria for ALI on day +6 (Fig. 2C). Clinical criteria for ALI were not met on other study days or in other groups. Timing of ALI in animals from Groups 3 and 4 correlated with timing of peak radiographic infiltrates (Fig. 2B and C).
3.4. Cellular immune responses in BAL were distinct between groups
Animals from Group 1 (saline) had no significant changes in the number or distribution of immune cell populations in BAL (Figs. 3 and 4 A–G) over the course of the study. Group 2 (MRSA) animals had significant elevations of NK cells (CD14−CD3−NKG2A+), dendritic cells (CD3−CD20−CD163−CD66−HLA-DR+/−CD11c+), neutrophils (CD3−CD20−CD163−CD11c−CD66+), monocytes (CD3−CD20−HLA-DR+CD163+), and B-cells (CD14−CD3−CD20+) (Fig. 4A, C, D, E, and G) on day +6 and all cell populations returned to baseline by day +10. Group 3 (Sw31 IB) animals showed significant elevation of neutrophils on day +6 (Fig. 4D) and cytotoxic T-cells (CD14−CD20− CD3+CD4−CD8+) and dendritic cells on day +14 (Fig. 4 B and C). Group 4 (Sw31 IB + MRSA) animals had significant elevations of neutrophils, monocytes, and B-cells on day +6 (Fig. 4D, E, and G) and significant elevations of cytotoxic T-cells and dendritic cells on day +10 (Fig. 4B and C). CD4+ T-cell populations (CD14−CD20− CD3+CD8−CD4+) were significantly elevated on day +6 and +10 (Fig. 4F). Group 5 (SW31 aero) animals had significant elevation in NK cells on day +6 (Fig. 4A). Group 6 (Sw31 aero + MRSA) animals had significant elevations of NK cells on days +2, +6, and +10 (Fig. 4A); of neutrophils on days +2 and +6 (Fig. 4D); of monocytes on days +6 and +10 (Fig. 4E); of B-cells on day +6 (Fig. 4G); and of cytotoxic T-cells, dendritic cells, and CD4+ T-cells on day +10 (Fig. 4B, C, and F).
Fig. 3. Total CD45+ cells in bronchoalveolar lavage by group over time.
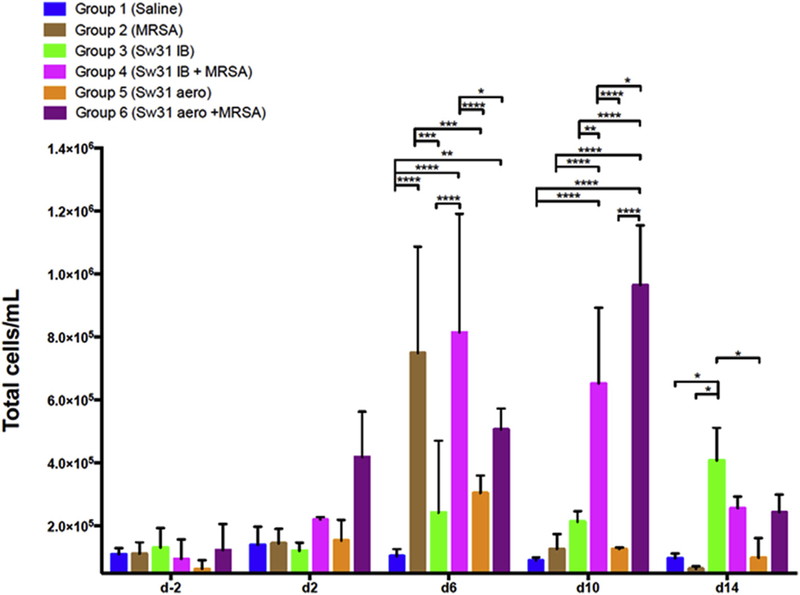
Bar graphs represent group means and SEMs. Comparison between groups was assessed by two-way ANOVA and significance testing by Tukey’s test, *p < 0.05, **p < 0.01, ***p < 0.001, and ****p < 0.0001.
Fig. 4. Immunophenotypes of CD45+ cells from bronchoalveolar lavage by group overtime.

A) NK cells; B) Cytotoxic T-cells; C) Dendritic cells; D) Neutrophils; E) Monocytes; F) CD4+ cells; G) B-cells. Bar graphs represent group means and SEMs. Comparison between groups was assessed by two-way ANOVA and significance testing by Tukey’s test, *p < 0.05, **p < 0.01, ***p < 0.001, and ****p < 0.0001.
3.5. Pneumonia and pathologic lung injury were most severe following IB influenza and MRSA co-infection
Histopathologic examination was performed on tissues sampled on day +14. Group 1 (saline) animals had no abnormal histopathology in the respiratory epithelium of the trachea, main-stem bronchi (Fig. 5A), bronchioles (Fig. 5B), or lung parenchyma (Fig. 5C). Group 2 (MRSA) animals had focal chronic bronchiolitis (Fig. 5D), often with reparative changes (Fig. 5E), and very rarely with bacteria morphologically consistent with Staphylococcus associated with small amounts of necrotic luminal debris (Fig. 5F; arrow). Group 3 (Sw31 IB) animals had few foci of acute exudative DAD (Fig. 5G; left half) characterized by prominent alveolar edema and vascular congestion (Fig. 5H), surrounded by multifocal areas of proliferative organizing DAD (Fig. 5G; right half) characterized by interstitial fibrosis (Fig. 5I; arrow) and type II alveolar cell hyperplasia (Fig. 5J; arrow). Multifocal chronic bronchiolitis was also observed (Fig. 5K; arrow) with several foci of bronchiolitis obliterans (Fig. 5L, arrow). Group 4 (Sw31 IB + MRSA) animals had extensive pathology with widespread consolidation in most lung lobes. Organizing pneumonia with extensive organizing DAD (Fig. 6A–C), with multifocal bronchiolitis obliterans (Fig. 6A–C arrows), chronic bronchiolitis with transmural infiltrates of inflammatory cells and loss of epithelial cell integrity (Fig. 6D) were observed. The key features of the areas of organizing DAD included interstitial fibrosis (Fig. 6E; arrows) and type II alveolar cell hyperplasia (Fig. 6F; arrow). Group 5 (Sw31 aerosol) (Fig. 6G–I) and 6 (Sw31 aero + MRSA) (Fig. 6J–L) animals had similar histopathology features with multifocal areas of interstitial inflammatory infiltrates producing an interstitial pneumonia pattern (Fig. 6G and J) with multifocal areas of chronic bronchiolitis often with prominent submucosal lymphoid nodules (Fig. 6H & KL; arrows). Areas with organizing DAD features were noted (Fig. 6I) with interstitial fibrosis and type II hyperplasia (Fig. 6L) but were much less prominent than observed in groups 3 and 4.
Fig. 5. Day +14 histopathology of lungs from Sw31 and/or MRSA infected animals (Groups 1 to 3).

A–C) Group 1 saline: No significant histopathological changes were noted in the tracheobronchial tree (A & B) or in the lung parenchyma (C); D–F) Group 2 MRSA: sections demonstrated foci of chronic bronchiolitis (D) with evidence of repair (E), and rare, foci of luminal bacteria (F, arrow); G–L) Group 3 Sw31 IB: sections showed multifocal areas of acute DAD (G) with alveolar edema and capillary congestion (H) admixed with multifocal areas of organizing DAD with interstitial fibrosis (I, arrow) and type II alveolar hyperplasia (J, arrow), focal chronic bronchiolitis (K, arrow), and focal bronchiolitis obliterans (L, arrow). Original magnifications are as follows: (A) 20×, (B) 100×, (C) 20×, (D) 400×), (E) 100×, (F) 400×, (G) 40×, (H) 200×, (I) 200×, (J) 400×, (K) 40×, (L) 100×.
Fig. 6. Day +14 histopathology of lungs from Sw31 and/or MRSA infected animals (Groups 4 to 6).

A–F) Group 4 Sw31 IB + MRSA: multifocal areas of organizing pneumonia (A–C) with acute DAD with alveolar edema and capillary congestion admixed focal chronic bronchiolitis (D) and bronchiolitis obliterans (A–C, arrows), with multifocal areas of organizing DAD with interstitial fibrosis (E, arrows) and type II alveolar hyperplasia (F, arrow); G–I) Group 5 Sw31 aero: multifocal areas of interstitial pneumonia (G), focal chronic bronchiolitis with prominent submucosal lymphoid nodules (H, arrow), and multifocal areas of organizing DAD (I); J–L) Group 6 Sw31 aero + MRSA: multifocal areas of interstitial pneumonia (J), focal chronic bronchiolitis with prominent submucosal lymphoid nodules (K, arrow), and multifocal areas of organizing DAD, with interstitial fibrosis and type II aveolar hyperplasia (L). Original magnifications are as follows: (A) 40×, (B) 40×, (C) 40×, (D) 100×), (E) 200×, (F) 400×, (G) 40×, (H) 40×, (I) 200×, (J) 40×, (K) 40×, (L) 200×.
4. Discussion
We developed a model of severe pneumonia following influenza and bacterial co-infection in nonhuman primates. This was the first nonhuman primate study of influenza and bacterial co-infection where high-resolution CT scanning of the lungs was used to quantitatively assess pneumonia over the course of illness and where hypoxemia was correlated with pneumonia severity. This was also the first nonhuman primate study of influenza and bacterial co-infection where immune cell responses in BAL were serially evaluated in animals over the course of illness. Using an IB route of inoculation we successfully induced severe pneumonia following influenza infection alone and following influenza and bacterial co-infection. Peak illness was observed at day 6 post-influenza infection, manifested by bilateral pulmonary infiltrates and hypoxemia. The timing of radiographic and physiologic manifestations of disease in our model closely match those observed in severe human influenza infection (Chertow, 2012).
We observed that influenza and bacterial co-infection resulted in more severe lung histopathology than influenza infection alone. This same observation has been made in three of four prior nonhuman primate studies of influenza and bacterial co-infection where influenza was inoculated into the lower airways (Berendt, 1974; Berendt et al., 1975; Kobayashi et al., 2013; Miyake et al., 2010). In the most recent study by Kobayashi et al., no difference in lung histopathology was observed following influenza infection alone versus influenza and bacterial co-infection (Kobayashi et al., 2013). However, the MRSA inoculating dose employed by these authors was 1 × 10⁶ CFU, 3 logs lower than the dose used in our study and lung histopathology was assessed at day 9 post-influenza infection, likely past the peak of illness.
Pneumonia in our model did not progress to refractory hypoxic respiratory failure or death. We postulate that the underlying normal health status of the animals protected them from more severe disease, similar to most healthy humans infected with influenza. A recent influenza A challenge study in humans showed that a dose of 107 tissue culture infectious dose 50 was needed to induce mild illness in 69% of individuals (Memoli et al., 2015). These data suggest that high-dose influenza A exposure is likely needed to induce more than mild illness in healthy hosts. Despite this, development of pneumonia was reproducible in our model. Severity of influenza pneumonia is dependent upon the viral and bacterial strain used, pathogen dose, and route of infection. We selected Sw31 because it is well characterized in mice and ferrets to cause severe pneumonia, and is genetically similar to 1918 influenza, that causes severe pneumonia in nonhuman primates (Kobasa et al., 2007). Viral dose of 5 × 10⁶ pfu was selected as the highest dose that could be reasonably achieved and matched across routes of delivery. MRSA was selected given its high prevalence among adult and pediatric patients with severe influenza infection (Rice et al., 2012; Randolph et al., 2011). While MRSA is known to induce pneumonia in nonhuman primates, Panton-Valentine leukocidin (PVL) does not appear to significantly contribute to pathogenesis (Olsen et al., 2010). While PVL is known to be a S. aureus virulence molecule in vitro, its contribution to pneumonia pathogenesis in humans remains controversial. While the route of infection we studied does not mirror natural infection, our intention was not to evaluate the natural history of mild influenza infection. This can be best accomplished in human challenge experiments or natural history studies. Our intention was to model severe influenza pneumonia as observed in humans.
To expand the relevance of our findings and establish the utility of this model for assessing efficacy of vaccines and therapies for the prevention and treatment of severe influenza pneumonia, additional experiments are needed. Future studies should assess reproducibility of our findings with other relevant seasonal and high-path avian influenza strains with pandemic potential. Streptococcus pneumonia, another clinically relevant bacterial co-pathogen, should also be evaluated. Dose response studies are also needed. Quantitative assessment of lung histopathology correlated to CT findings at peak illness (day 6) will also strengthen the validity of this model. Interestingly aerosolized influenza alone induced only subclinical disease despite presence of interstitial pneumonia on lung histopathology. This was made only moderately worse with bacterial co-infection. Some variation in delivered inoculum was observed, primarily across routes of delivery. This is likely attributable to methodological differences required to deliver virus IB versus aerosol. Also, the design of the aerosol chamber, where not all inoculum is delivered into the airway, likely resulted in a dose reduction in the influenza aerosol groups. However, diffuse interstitial pneumonia observed on histopathology in these groups, and robust immune response in BAL suggest that aerosol exposure to influenza results in a distinct and more mild clinic-pathological phenotype.
Nonhuman primate models of influenza infection will not and should not replace mice and ferret studies for the preclinical assessment of influenza vaccines and therapies. Relevant small animal models will always be needed for initial higher throughput evaluation of interventions. However, nonhuman primate models provide an important adjunct for validating findings in small animal models and may more closely predict vaccine and therapeutic efficacy for severe disease in humans. Lung immune cell responses in nonhuman primates likely correlate better to those of humans than those of more genetically distant animals. Characterization of lung immune cell responses in nonhuman primates following influenza infection may facilitate discovery of improved correlates of influenza immunity in humans, needed for better vaccine design. Additionally, characterization of lung immune responses contributing to progression and resolution of lung injury may lead to discovery of novel therapeutic targets within the host to improve severe pneumonia outcomes.
In summary, we report a nonhuman primate model of IB influenza and MRSA co-infection that induced severe pneumonia similar to that observed in humans. With additional validation this model may serve as a pathway for regulatory approval of vaccines and therapeutics for the prevention and treatment of severe influenza pneumonia. This will be particularly useful for high-path avian influenza strains with pandemic potential that cause sporadic infections and are thus not easily amenable to large clinical trials of vaccine and therapeutic efficacy.
Supplementary Material
Acknowledgments
The Intramural Research Program of NIAID, NIH supported this work. We are grateful to Lisa E. Hensley, Russell Byrum, Dan Ragland, Dawn Traynor, Catherine Jett and the entire IRF team for their contributions to these studies. The content of this publication does not necessarily reflect the views or policies of the US Department of Health and Human Services (DHHS) or of the institutions and companies affiliated with the authors. This work was funded in part through Battelle Memorial Institute’s prime contract with NIAID under Contract no. HHSN272200700016I. J.K.B. and K.B.J. performed this work as employees of Battelle Memorial Institute. Subcontractors to Battelle Memorial Institute who performed this work are: M.G.L., an employee of Lovelace Respiratory Research Institute; and P.S., an employee of MEDRelief.
Footnotes
Appendix A. Supplementary data
Supplementary data related to this article can be found at http://dx.doi.org/10.1016/j.antiviral.2016.02.013.
References
- Berendt RF, 1974. Simian model for the evaluation of immunity to influenza. Infect. Immun. 9,101–105. [DOI] [PMC free article] [PubMed] [Google Scholar]
- Berendt RF, Long GG, Walker JS, 1975. Influenza alone and in sequence with pneumonia due to Streptococcus pneumoniae in the squirrel monkey. J. Infect. Dis. 132, 689–693. [DOI] [PubMed] [Google Scholar]
- Bernard GR, Artigas A, Brigham KL, Carlet J, Falke K, Hudson L, Lamy M, LeGall JR, Morris A, Spragg R, 1994. Report of the American-European consensus conference on ARDS: definitions, mechanisms, relevant outcomes and clinical trial coordination. The Consensus Committee Intensive Care Med. 20, 225–232. [DOI] [PubMed] [Google Scholar]
- Chertow DS, 2012. Contribution of bacterial coinfection to severe influenza infection. Crit. Care Med. 40, 1664–1665. [DOI] [PubMed] [Google Scholar]
- Davis AS, Taubenberger JK, Bray M, 2015. The use of nonhuman primates in research on seasonal, pandemic and avian influenza, 1893–2014. Antivir. Res. 117, 75–98. [DOI] [PMC free article] [PubMed] [Google Scholar]
- Johnson RF, Hammoud DA, Lackemeyer MG, Yellayi S, Solomon J, Bohannon JK, Janosko KB, Jett C, Cooper K, Blaney JE, Jahrling PB, 2015. Small particle aerosol inoculation of cowpox Brighton Red in rhesus monkeys results in a severe respiratory disease. Virology 481,124–135. [DOI] [PMC free article] [PubMed] [Google Scholar]
- Kobasa D, Jones SM, Shinya K, Kash JC, Copps J, Ebihara H, Hatta Y, Kim JH, Halfmann P, Hatta M, Feldmann F, Alimonti JB, Fernando L, Li Y, Katze MG, Feldmann H, Kawaoka Y, 2007. Aberrant innate immune response in lethal infection of macaques with the 1918 influenza virus. Nature 445, 319–323. [DOI] [PubMed] [Google Scholar]
- Kobayashi SD, Olsen RJ, LaCasse RA, Safronetz D, Ashraf M, Porter AR, Braughton KR, Feldmann F, Clifton DR, Kash JC, Bailey JR, Gardner DJ, Otto M, Brining DL, Kreiswirth BN, Taubenberger JK, Parnell MJ, Feldmann H, Musser JM, DeLeo FR, 2013. Seasonal H3N2 influenza A virus fails to enhance Staphylococcus aureus co-infection in a non-human primate respiratory tract infection model. Virulence 4, 707–715. [DOI] [PMC free article] [PubMed] [Google Scholar]
- Memoli MJ, Tumpey TM, Jagger BW, Dugan VG, Sheng ZM, Qi L, Kash JC, Taubenberger JK, 2009. An early ‘classical’ swine H1N1 influenza virus shows similar pathogenicity to the 1918 pandemic virus in ferrets and mice. Virology 393, 338–345. [DOI] [PMC free article] [PubMed] [Google Scholar]
- Memoli MJ, Czajkowski L, Reed S, Athota R, Bristol T, Proudfoot K, Fargis S, Stein M, Dunfee RL, Shaw PA, Davey RT, Taubenberger JK, 2015. Validation of the wild-type influenza A human challenge model H1N1pdMIST: an A(H1N1)pdm09 dose-finding investigational new drug study. Clin. Infect. Dis. 60, 693–702. [DOI] [PMC free article] [PubMed] [Google Scholar]
- Miyake T, Soda K, Itoh Y, Sakoda Y, Ishigaki H, Nagata T, Ishida H, Nakayama M, Ozaki H, Tsuchiya H, Torii R, Kida H, Ogasawara K, 2010. Amelioration of pneumonia with Streptococcus pneumoniae infection by inoculation with a vaccine against highly pathogenic avian influenza virus in a non-human primate mixed infection model. J. Med. Primatol. 39, 58–70. [DOI] [PubMed] [Google Scholar]
- Morens DM, Taubenberger JK, Fauci AS, 2008. Predominant role of bacterial pneumonia as a cause of death in pandemic influenza: implications for pandemic influenza preparedness. J. Infect. Dis. 198, 962–970. [DOI] [PMC free article] [PubMed] [Google Scholar]
- Muthuri SG, Venkatesan S, Myles PR, Leonardi-Bee J, Al Khuwaitir TS, Al Mamun A, Anovadiya AP, Azziz-Baumgartner E, Baez C, Bassetti M, Beovic B, Bertisch B, Bonmarin I, Booy R, Borja-Aburto VH, Burgmann H, Cao B, Carratala J, Denholm JT, Dominguez SR, Duarte PA, Dubnov-Raz G, Echavarria M, Fanella S, Gao Z, Gerardin P, Giannella M, Gubbels S, Herberg J, Iglesias AL, Hoger PH, Hu X, Islam QT, Jimenez MF, Kandeel A, Keijzers G, Khalili H, Knight M, Kudo K, Kusznierz G, Kuzman I, Kwan AM, Amine IL, Langenegger E, Lankarani KB, Leo YS, Linko R, Liu P, Madanat F, Mayo-Montero E, McGeer A, Memish Z, Metan G, Mickiene A, Mikic D, Mohn KG, Moradi A, Nymadawa P, Oliva ME, Ozkan M, Parekh D, Paul M, Polack FP, Rath BA, Rodriguez AH, Sarrouf EB, Seale AC, Sertogullarindan B, Siqueira MM, Skret-Magierlo J, Stephan F, Talarek E, Tang JW, To KK, Torres A, Torun SH, Tran D, Uyeki TM, Van Zwol A, Vaudry W, Vidmar T, Yokota RT, Zarogoulidis P, Investigators PC, Nguyen-Van-Tam JS, 2014. Effectiveness of neuraminidase inhibitors in reducing mortality in patients admitted to hospital with influenza A H1N1pdm09 virus infection: a meta-analysis of individual participant data. Lancet Respir. Med. 2, 395–404. [DOI] [PMC free article] [PubMed] [Google Scholar]
- Olsen RJ, Kobayashi SD, Ayeras AA, Ashraf M, Graves SF, Ragasa W, Humbird T, Greaver JL, Cantu C, Swain JL, Jenkins L, Blasdel T, Cagle PT, Gardner DJ, DeLeo FR, Musser JM, 2010. Lack of a major role of Staphylococcus aureus Panton-Valentine leukocidin in lower respiratory tract infection in nonhuman primates. Am. J. Pathol. 176, 1346–1354. [DOI] [PMC free article] [PubMed] [Google Scholar]
- Qi L, Kash JC, Dugan VG, Wang R, Jin G, Cunningham RE, Taubenberger JK, 2009. Role of sialic acid binding specificity of the 1918 influenza virus hemagglutinin protein in virulence and pathogenesis for mice. J. Virol. 83, 3754–3761. [DOI] [PMC free article] [PubMed] [Google Scholar]
- Randolph AG, Vaughn F, Sullivan R, Rubinson L, Thompson BT, Yoon G, Smoot E, Rice TW, Loftis LL, Helfaer M, Doctor A, Paden M, Flori H,Babbitt C, Graciano AL, Gedeit R, Sanders RC, Giuliano JS, Zimmerman J, Uyeki TM, Pediatric Acute Lung I, Sepsis Investigator’s N, the National Heart L, Blood Institute ACTN, 2011. Critically ill children during the 2009–2010 influenza pandemic in the United States. Pediatrics 128, e1450–1458. [DOI] [PMC free article] [PubMed] [Google Scholar]
- Rice TW, Rubinson L, Uyeki TM, Vaughn FL,John BB, Miller RR 3rd, Higgs E, Randolph AG, Smoot BE, Thompson BT, Network NA, 2012. Critical illness from 2009 pandemic influenza A virus and bacterial coinfection in the United States. Crit. Care Med. 40,1487–1498. [DOI] [PMC free article] [PubMed] [Google Scholar]
- Solomon J, Johnson RF, Douglas D, Hammoud D, 2014. New image analysis technique for quantitative longitudinal assessment of lung pathology on CT in infected rhesus macaques. In: 27th International Symposium on Computer-based Medical Systems (CBMS), 2014 IEEE, pp. 169–172. [Google Scholar]
- Su S, Bi Y, Wong G, Gray GC, Gao GF, Li S, 2015. Epidemiology, evolution, and recent outbreaks of avian influenza virus in China. J. Virol. 89, 8671–8676. [DOI] [PMC free article] [PubMed] [Google Scholar]
- World Health Organization, 2015, November 25. Influenza, Seasonal. Retrieved from. http://www.who.int/mediacentre/factsheets/fs211/en/.
Further reading
- Taubenberger JK, Morens DM, 2006. 1918 influenza: the mother of all pandemics. Emerg. Infect. Dis. 12, 15–22. [DOI] [PMC free article] [PubMed] [Google Scholar]
Associated Data
This section collects any data citations, data availability statements, or supplementary materials included in this article.