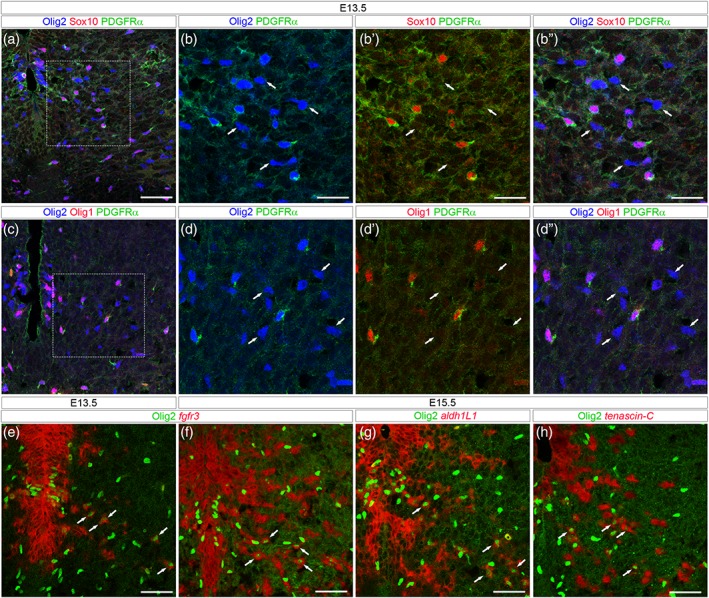
Figure 3.

Olig2+/Sox10_ cells express AP but not OPC markers. All images show transverse spinal cord sections. (a–d″) Combined detection of Olig2 (blue), PDGFRα (green) and Sox10 (a, b–b″, red) or Olig1 (c, d–d″, red) viewed on E13.5 hemi‐ventral spinal cord. b–b″ and d–d″ show higher magnification of the area framed in a and c, respectively. Arrows point to Olig2+ cells that are not stained with the OPC markers. (e–h) Combined detection of Olig2 (green) and mRNAs (red) encoding for fgfr3 (e, f), aldh1L1 (g) and tenascin‐C (h) viewed on E13.5 (e) and E15.5 (f–h) hemi‐ventral spinal cords. Note, in all panels, the presence of Olig2+ cells stained with mRNA probes (arrows). Scale bars = 50 μm in a, c, e–h and 25 μm in b–b″, d–d″ [Color figure can be viewed at wileyonlinelibrary.com]
