

Abstract
Background
Post‐radiotherapy locally recurrent prostate cancer (PCa) patients are candidates for focal salvage treatment. Multiparametric MRI (mp‐MRI) is attractive for tumor localization. However, radiotherapy‐induced tissue changes complicate image interpretation. To develop focal salvage strategies, accurate tumor localization and distinction from benign tissue is necessary.
Purpose
To quantitatively characterize radio‐recurrent tumor and benign radiation‐induced changes using mp‐MRI, and investigate which sequences optimize the distinction between tumor and benign surroundings.
Study Type
Prospective case–control.
Subjects
Thirty‐three patients with biochemical failure after external‐beam radiotherapy (cases), 35 patients without post‐radiotherapy recurrent disease (controls), and 13 patients with primary PCa (untreated).
Field Strength/Sequences
3T; quantitative mp‐MRI: T2‐mapping, ADC, and Ktrans and kep maps.
Assessment
Quantitative image‐analysis of prostatic regions, within and between cases, controls, and untreated patients.
Statistical Tests
Within‐groups: nonparametric Friedman analysis of variance with post‐hoc Wilcoxon signed‐rank tests; between‐groups: Mann–Whitney tests. All with Bonferroni corrections. Generalized linear mixed modeling to ascertain the contribution of each map and location to tumor likelihood.
Results
Benign imaging values were comparable between cases and controls (P = 0.15 for ADC in the central gland up to 0.91 for kep in the peripheral zone), both with similarly high peri‐urethral Ktrans and kep values (min−1) (median [range]: Ktrans = 0.22 [0.14–0.43] and 0.22 [0.14–0.36], P = 0.60, kep = 0.43 [0.24–0.57] and 0.48 [0.32–0.67], P = 0.05). After radiotherapy, benign central gland values were significantly decreased for all maps (P ≤ 0.001) as well as T2, Ktrans, and kep of benign peripheral zone (all with P ≤ 0.002). All imaging maps distinguished recurrent tumor from benign peripheral zone, but only ADC, Ktrans, and kep were able to distinguish it from benign central gland. Recurrent tumor and peri‐urethral Ktrans values were not significantly different (P = 0.81), but kep values were (P < 0.001). Combining all quantitative maps and voxel location resulted in an optimal distinction between tumor and benign voxels.
Data Conclusion
Mp‐MRI can distinguish recurrent tumor from benign tissue.
Level of Evidence: 2
Technical Efficacy Stage: 2
J. Magn. Reson. Imaging 2019;50:269–278.
ONE OF THE MAIN treatment options for localized prostate cancer (PCa) is external‐beam radiotherapy (EBRT). Depending on the risk group, 5‐year disease‐free survival varies from 67–80% for PCa patients who are treated with whole‐gland radiotherapy (RT) to 78 Gy.1 A small but significant proportion of patients failing the primary treatment will harbor locally recurrent disease only,2, 3 for which focal treatment strategies, targeting the tumor region while sparing the surrounding uncompromised tissue, might offer a curative treatment option. To this end, multiparametric magnetic resonance imaging (mp‐MRI) with both anatomical and functional properties is attractive for locoregional evaluation of recurrent PCa and for tumor boundary definition. However, RT‐induced tissue changes pose a challenge to MRI interpretation. T2‐weighted (T2w) MRI is the reference anatomical sequence; however, it has limited performance in this setting, as tumor conspicuity is decreased and zonal anatomy is often lost.4 The use of functional sequences such as 1.5T MR spectroscopy5 as well as diffusion‐weighted imaging (DWI) and dynamic contrast‐enhanced (DCE)‐MRI6, 7, 8 were found to surpass T2w‐MRI in the detection of recurrent disease.
To successfully develop focal salvage strategies for recurrent PCa, an accurate detection and localization of the tumor as well as distinction from radiation‐affected benign tissue is necessary.
The objectives of this study were to: 1) investigate RT‐induced tissue changes and how these impacted the distinction of recurrent tumor from surrounding benign tissue; and 2) use quantitative sequences to characterize both benign tissue and recurrent PCa after RT, and investigate which sequences resulted in optimal tumor localization.
Materials and Methods
Patient Recruitment and Matching
This prospective single‐institution study was approved by the Institutional Review Board and took place between December 2015 and July 2018. All patients signed informed consent prior to participation in the study.
An overview of the study design can be seen in Fig. 1.
Figure 1.
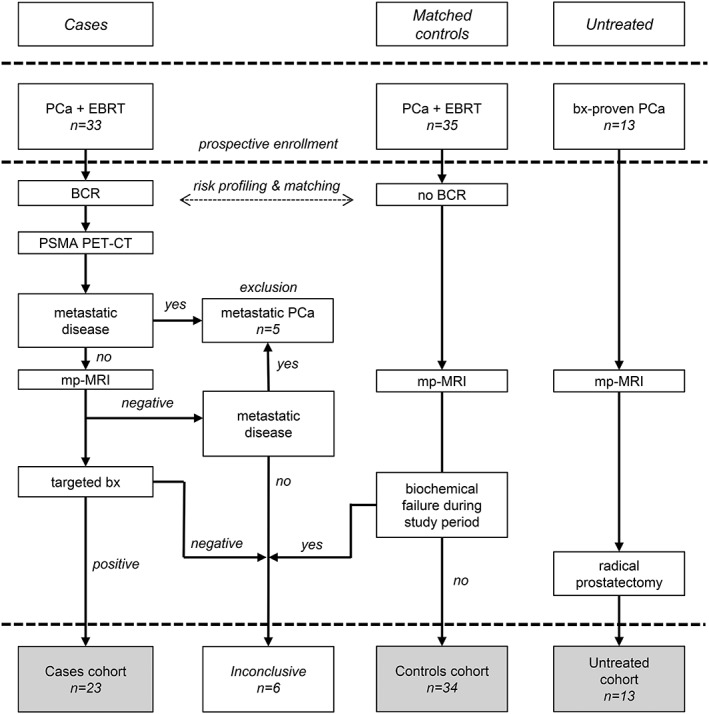
Study design with an overview of the three analyzed cohorts. BCR, biochemical recurrence; bx, biopsy; EBRT, external‐beam radiation therapy.
CASES (PATIENTS WITH RECURRENT PCA)
Patients with a biochemical recurrence according to the Phoenix definition9 were enrolled in the study. Patients could only be included more than 24 months after completion of EBRT and if they qualified for salvage treatment. A 68Ga‐PSMA‐PET (prostate‐specific membrane antigen / positron emission tomography) scan was acquired to exclude metastatic disease. Exclusion criteria were hormonal therapy in the past year, the use of anticoagulants that could not be stopped temporarily to acquire biopsies, contraindications for an MRI exam, and other treatments for cancer in the pelvis. Patients received an mp‐MRI. When a tumor‐suspected region was identified, an MR‐fused ultrasound‐guided biopsy was performed targeting this region. If no tumor‐suspected region could be identified, either only prostate‐specific antigen (PSA) follow‐up would be continued, or a standard systematic biopsy could be performed. This decision was made by the treating physician. Patients with positive imaging and biopsy findings for locally recurrent PCa constituted the cohort of case patients.
An inconclusive diagnosis was given to patients for whom a local or metastatic recurrence could not be detected on MRI, or the biopsies were negative, or both. These patients were analyzed further but separately from the cohort of cases.
CONTROLS (PATIENTS WITHOUT RECURRENT PCA)
Matched controls (patients without evidence of recurrent disease) were recruited and received an mp‐MRI scan. The matching criteria were: time since primary RT (years), use of hormonal therapy, and the risk group of the primary tumor. Risk stratification was based on the definition proposed by the European Association for Medical Oncology (ESMO) in 2010,10 incorporating changes suggested in the review by Rodrigues et al11 on the importance of the amount of high‐grade cancer, differentiating between Gleason 3 + 4 and 4 + 3. Risk stratification was defined as: low‐risk: T1‐T2a, Gleason ≤6 and PSA ≤10 ng/ml; intermediate‐risk: T2b‐T2c, Gleason = 7 (3 + 4) and PSA ≤20 ng/ml, not otherwise low‐or high‐risk; high‐risk: T3‐T4 or Gleason ≥7 (4 + 3) or PSA >20. The exclusion criteria were identical to those applied for the cases.
If a patient developed a biochemical recurrence during the study period, he was moved to the inconclusive cohort.
UNTREATED (PATIENTS AT PRIMARY DIAGNOSIS)
A previously reported cohort of 13 primary PCa patients,12, 13 scanned prior to treatment with an mp‐MRI protocol, was used as reference. As part of the study, these patients underwent two mp‐MRI scanning sessions. Following the second MRI examination, the patients were treated with a radical prostatectomy. This cohort is referred to as the untreated cohort.
MRI Protocol
All patients were scanned with a 3T Achieva dStream (A) or Ingenia (B) scanner (Philips Healthcare, Best, The Netherlands). Twenty patients were scanned in system A with a 6‐channel cardiac coil and 48 were scanned in system B with a 16‐channel anterior and 12‐channel posterior coil. With the exception of four patients (three scanned in system A), all were scanned with the use of an endorectal coil.
The mp‐MRI protocol consisted of an axial, sagittal, and coronal T2w turbo spin echo; a 3D gradient echo T1‐weighted (T1w); a balanced steady‐state free‐precession (bSSFP); an axial multiecho spin echo k‐t‐T2 sequence,12 with 12 echoes acquired at a spacing of 16 msec, starting at 32 msec; a transversal DWI and a DCE sequence. DWI was acquired using a single‐shot spin‐echo echo‐planar imaging sequence with diffusion encoding b‐values ranging from 0 to 800 s/mm2. DCE was acquired with a 3D T1w spoiled gradient echo sequence at a temporal resolution of 2.6 seconds over 5 minutes, before, during, and after intravenous administration of 15 ml of Dotarem (0.5 mM Dotarem, Guerbet, Roissy, France). The contrast agent was administered using a power injector (MedRad, Warrendale, PA), followed by a 30‐ml saline flush at a flow rate of 3 ml/s. Further sequence specific details can be found in the Supplementary Materials 1.
Apparent diffusion coefficient (ADC) maps were derived from the DWI sequence using b = 200 and 800 s/mm2. The standard Tofts model14 was used to calculate the pharmacokinetic maps Ktrans and kep. This was done using a T1 map generated based on the variable flip angle method,15 using flip angle = 3°, 6°, 10°, 20°, and 30°, to convert signal intensity into concentration, and an arterial input function (AIF) with parameters derived from an in‐house study population. T2 maps were created by converting the signal to the logarithmic scale and performing a weighted linear fit.
All sequence‐derived functional maps were generated using MatLab R2017b (MathWorks, Natick, MA).
Visual inspection was used to assess possible displacements between the functional sequences (and respective quantitative maps) and the T2w‐MRI scans. Rigid registration based on mutual information was used whenever necessary to correct for these displacements. All images were resampled to the T2w grid.
Region of Interest (ROI) Segmentation
The prostate, the peripheral zone (PZ), the central gland (CG), and the region surrounding the urethra—peri‐urethral tissue (PU)—were delineated. The PU region was delineated using both the sagittal and transversal T2w images. The tumor‐suspected regions were delineated by a radiologist (14 years of experience) based on the MRI, PET, and biopsy report information. As the Prostate Imaging Reporting and Data System 2 (PI‐RADS v2)16 is not applicable to recurrent prostate cancer, tumor was defined as a region with low signal intensity (SI) on T2w‐MRI, high SI in the b = 800 DWI scan, low SI on the ADC map, and increased enhancement in the Ktrans and kep maps. For the untreated cohort, tumor delineations were originally performed on the histopathology and propagated to imaging. Figure 2 illustrates the ROIs as delineated for a case patient.
Figure 2.
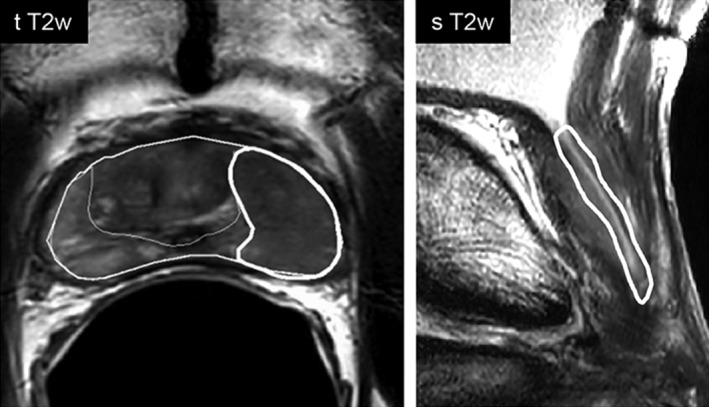
Illustration of the delineated ROIs. In the left image the eroded prostate contour, the peripheral zone, and the tumor can be seen delineated on the transversal T2w image. On the right, the peri‐urethral contour is presented overlaid on the sagittal T2w scan.
The bSSFP sequence was used to identify and exclude from further analysis the implanted fiducial markers. Prostate delineations were eroded in all directions by 1 mm to ensure that only prostate tissue was analyzed.
ROI analysis was performed using Python 3 (Python Software Foundation, Delaware).
Statistics
A t‐test for continuous variables (PSA) and a chi‐square test for categorical variables (Gleason and TNM stage) were used to compare the clinical characteristics of the cohorts.
Normality was checked using the Shapiro–Wilk test. In a case of nonnormality, a nonparametric Friedman's analysis of variance (ANOVA) for dependent groups was used to compare the different regions within the groups (untreated, cases, and controls). If significant, the differences were further evaluated using a post‐hoc Wilcoxon signed‐rank test. To compare the same region between groups, a Mann–Whitney test was used. To correct for multiple testing, a Bonferroni correction was applied to the significance level of α = 0.05.
Univariate and multivariate generalized linear mixed‐effect modeling (GLMM) was applied to assess the predictive value of imaging on the voxelwise likelihood of tumor. Only case patients were used in this analysis. Voxels were grouped into benign (resulting from a combination of unaffected PZ and CG) and tumor (based on the radiologist delineations). To obtain the likelihood of tumor on a voxel level, fixed and random effects were included. The quantitative imaging maps and voxel anatomical location (PZ or CG) were accounted as predictive variables and therefore included as fixed effects. Random effects accounted for spatial clustering by incorporating voxel location within the prostate (the relative distance in x, y, and z from the prostate center of mass) and patient identifiers. When the association between model parameters and tumor probability was nonlinear, the parameters were grouped in quartiles and regression coefficients were estimated for each group considering the first quartile as reference. The model fit was assessed using the Bayesian Information Criterion (BIC) (a decrease of 10 points reflects an improved fit) and by evaluating the residual random error. Statistics were performed with the Statistical Package for Social Sciences, v. 22.0 (SPSS, Chicago, IL). Analysis was performed in R17 using the lme4 package.18
Results
Patient Characteristics
In total, 33 case patients and 35 controls were prospectively included in the study. Adjuvant hormonal therapy was given for a maximum period of 3 years to 82% of the cases and to 94% of the controls upon treatment of the primary PCa. However, none of the patients received hormonal therapy within 1 year prior to the MRI exam.
CASES (PATIENTS WITH RECURRENT PCA)
Ten of the 33 included patients had either regional metastases without evidence of intraprostatic recurrence (n = 5) or an inconclusive diagnosis (n = 5). Twenty‐three patients remained that fitted all the inclusion criteria for cases. For 3 of the 23 case patients, the first biopsy was negative and a repeated navigated biopsy confirmed the MRI suspected tumor location.
In 2 out of 23 patients the k‐t‐T2 sequence was not acquired and for another the ADC map was not used due to poor image quality.
For the 23 cases a total of 27 suspected tumor foci were delineated, with an average tumor volume of 1.37 cm3. From these, four were located in CG. The median time to recurrence for the 23 cases was 7 years since primary EBRT treatment.
CONTROLS (PATIENTS WITHOUT RECURRENT PCA)
One patient was initially recruited as a control but had a biochemical failure during the study period. This patient was moved to the inconclusive cohort. The remaining 34 matched controls (patients without evidence of locally recurrent PCa) had a median time of 6 years since the EBRT treatment.
UNTREATED (PATIENTS AT PRIMARY DIAGNOSIS)
The 13 untreated patients had a median time of 20 (range, 5–65) days between the MRI and prostatectomy. None of these patients received hormonal therapy before imaging. For one patient, the small dimensions of the histopathological tumor resulted in a subvoxel tumor ROI in MRI. For this patient only benign tissue was analyzed.
Table 1 describes the patient characteristics for cases, controls, and untreated patients. For the untreated patients, the characteristics reported in the table are based on the biopsy report and clinical TNM stage.
Table 1.
Patient Characteristics
| Cases | Controls | Untreated | ||
|---|---|---|---|---|
| Primary tumor | Recurrence | Primary tumor | Primary tumor | |
| TNM stagea | ||||
| T1 | — | — | 5 | 5 |
| T2 | 11 | 13 | 6 | 7 |
| T3 | 11 | 4 | 23 | 1 |
| T4 | 1 | — | — | — |
| Gleason scoreb | ||||
| ≤ 6 | 4 | — | 6 | 7 |
| 7 | 12 | — | 12 | 6 |
| ≥ 8 | 6 | — | 16 | — |
| PSA (ng/ml) c | ||||
| ≤ 10 | 10 | 22 | 11 | 12 |
| 10 < PSA ≤ 20 | 6 | 1 | 14 | 1 |
| ≥ 20 | 6 | — | 8 | — |
Recurrent tumors were not assigned a Gleason score as radiation induced atypia can be a confounder for pathological interpretation.
In six case patients TNM stage of recurrent tumor was not reported.
For one case patient only the Anderson score (=2) was available.
In one case and one control PSA of primary tumor could not be retrieved.
The clinical characteristics of the cohorts were compared. TNM stage was grouped in two (T1+T2 and T3+T4) and the Gleason score in three groups (Gleason ≤6, 7, ≥8). Cases and controls had comparable clinical characteristics (PSA: P = 0.789; TNM stage: P = 0.393; Gleason score: P = 0.271). Both case and control patients had significantly higher‐risk primary PCa when compared with the untreated patients (PSA: P = 0.008 and P = 0.003; TNM stage: P = 0.004 and P < 0.001; Gleason score: P = 0.03 and P = 0.004 for cases and controls, respectively).
Figure 3 illustrates the values of T2, ADC, Ktrans, and kep for untreated, controls, and case patients. Median imaging values for the three cohorts are presented in Table 2.
Figure 3.
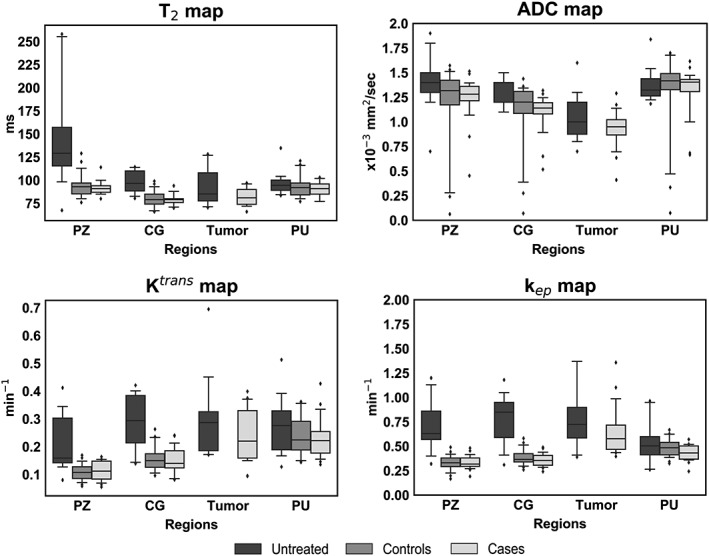
Boxplots with median values for all regions, imaging modalities, and the three cohorts of patients: untreated, controls (nonrecurrent), and cases (recurrent). Edges of the boxes are the first (25th) and third (75th) quartiles, and whiskers represent the 5th and 95th percentile. PZ, peripheral zone; CG, central gland; PU, peri‐urethral tissue.
Table 2.
Quantitative Imaging Values for the Three Cohorts in the Different Prostatic Regions. Median of all individual patient's median values, with the minimum and maximum presented in parentheses
| PZ | CG | Tumor | PU | ||
|---|---|---|---|---|---|
| T2 (msec) | Untreated | 129 (67–258) | 97 (81–114) | 85 (70–128) | 94 (84–135) |
| Controls | 93 (76–129) | 79 (66–99) | — | 92 (77–121) | |
| Cases | 91 (80–114) | 79 (70–94) | 81 (66–97) | 91 (77–103) | |
| ADC (x10−3 mm2/sec) | Untreated | 1.40 (0.70–1.90) | 1.20 (1.10–1.50) | 1.00 (0.70–1.60) | 1.32 (1.20–1.80) |
| Controls | 1.32 (0.06–1.57) | 1.20 (0.07–1.44) | — | 1.41 (0.07–1.70) | |
| Cases | 1.28 (0.45–1.51) | 1.14 (0.52–1.32) | 0.95 (0.41–1.29) | 1.40 (0.67–1.62) | |
| Ktrans(min−1) | Untreated | 0.16 (0.08–0.41) | 0.29 (0.14–0.42) | 0.29 (0.17–0.70) | 0.28 (0.13–0.51) |
| Controls | 0.11 (0.06–0.17) | 0.15 (0.10–0.26) | — | 0.22 (0.14–0.36) | |
| Cases | 0.11 (0.05–0.16) | 0.14 (0.08–0.24) | 0.22 (0.09–0.40) | 0.22 (0.14–0.43) | |
| kep(min−1) | Untreated | 0.63 (0.32–1.20) | 0.85 (0.31–1.18) | 0.73 (0.39–3.89) | 0.50 (0.26–0.96) |
| Controls | 0.33 (0.17–0.49) | 0.37 (0.26–0.58) | — | 0.48 (0.32–0.67) | |
| Cases | 0.32 (0.19–0.48) | 0.36 (0.24–0.49) | 0.58 (0.40–1.36) | 0.43 (0.24–0.57) |
Characteristics of Irradiated Benign Tissue
Figure 4 illustrates the quantitative maps and suspected tumor regions for a representative case (Fig. 4a) and control (Fig. 4b) patient.
Figure 4.
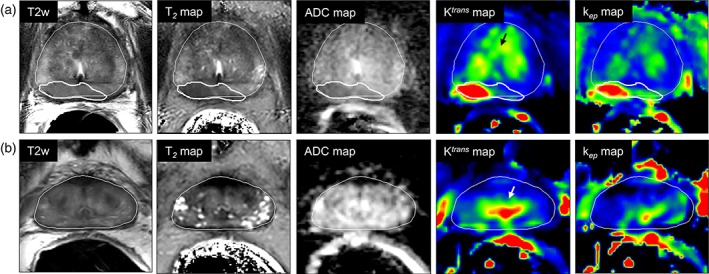
Representative example of a case (a) patient with recurrence and a control (b) without recurrent disease, with all anatomical and functional maps. Thin and thick white lines represent prostate and tumor delineations, respectively. Black and white arrows in the Ktrans maps point to the increased enhancement in the peri‐urethral tissue, present in both cases and controls.
The values for benign PZ and CG were comparable between cases and controls (P = 0.15 for ADC in the CG up to 0.91 for the kep in the PZ). Values in the PU were also similar between the groups (with the lowest P = 0.05 for kep >0.05/3). Both cases and controls presented with PU enhancement.
For controls, significant differences were found between PZ and CG and between CG and PU (P < 0.001 for all comparisons between imaging values and regions).
The values obtained for the PZ, CG, and PU in the inconclusive cohort were not significantly different from those of the cases (with the lowest P = 0.03 for T2 in the PZ >0.05/3) or controls (with the lowest P = 0.04 for T2 in the CG >0.05/3). The quantitative imaging values for this specific cohort are presented in the Supplementary Materials 2.
Radiation‐Induced Changes
To investigate radiation‐induced tissue changes, the values from the untreated patients were used as a population reference against which the values of the cases were compared.
The different prostate regions were more homogeneous after RT and the range of values was in general smaller than before treatment. With the exception of ADC (for which P = 0.03 > 0.05/4), T2, Ktrans, and kep values in the PZ were significantly lower (T2, kep P < 0.001, and Ktrans P = 0.002) after RT. The CG imaging values were for all maps significantly lower after RT (all with P ≤ 0.001). In the PU, despite the higher Ktrans values seen before treatment, the imaging values for all maps remained comparable before and after treatment (P = 0.19 for T2 up to P = 0.56 for ADC).
Similar characteristics were seen for all maps for recurrent and primary tumors (P = 0.17 for kep up to P = 0.22 for ADC).
Tumor Localization
To compare recurrent tumor with the remaining irradiated benign gland, the cohort of case patients was assessed. With all imaging maps, median tumor values were significantly different from benign tissue within the PZ (P < 0.001 for all imaging modalities). No differences were seen between the T2 values of suspected tumor and benign CG tissue (P = 0.08). However, values of ADC, Ktrans, and kep from suspected tumor regions were significantly different (all with P < 0.001) from those of the CG. When compared with the surrounding benign tissue, heightened Ktrans and kep values were seen in the PU. The PU Ktrans values were comparable with those of suspected tumor (P = 0.81), but with kep a significant distinction (P < 0.001) could be made between the two regions. The PZ and CG ROIs were significantly different for all maps except kep (P = 0.05 > 0.05/6).
Using the GLMM, we observed that univariately all MRI parameters were significantly associated with tumor likelihood (P < 0.001). Location within the gland was also significantly associated with tumor likelihood. The association between T2 and tumor probability was nonlinear, and therefore this parameter was grouped in quartiles with univariate regression coefficients β = 0 (reference group), 0.19, –0.59, and –1.83. The regression coefficients were for ADC: β = –5.06, Ktrans: β = 17.27, kep: β = 8.42 and location: β = –0.64. The multivariate model combining all mp‐MRI parameters and location obtained the best fit and was the most predictive for tumor likelihood (BIC of 392,212, P < 0.001). The values for the regression coefficients and standard errors are presented in Table 3. A reconstructed probability map for a case patient is presented in Fig. 5.
Table 3.
Model Parameters Obtained When Combining T2 Map, ADC, Ktrans, and kep Imaging Values to Predict Tumor at the Voxelwise Level
| Fixed effects (MRI) | Regression coefficients (β) | Std. Error | P |
|---|---|---|---|
| T2 map reference group (24 – 73 msec) | 0 | — | — |
| T2 map 2nd quartile (74 – 83 msec) | 0.08 | 0.01 | <0.001 |
| T2 map 3rd quartile (84 – 97 msec) | –0.40 | 0.01 | <0.001 |
| T2 map 4th quartile (98 – 1188 msec) | –1.50 | 0.02 | <0.001 |
| ADC | –2.86 | 0.02 | <0.001 |
| Ktrans | 6.52 | 0.09 | <0.001 |
| kep | 4.85 | 0.04 | <0.001 |
| Location | –0.98 | 0.01 | <0.001 |
| Intercept (β0) | –5.55 | 0.46 | <0.001 |
| Random effects | Variance (σ2) | ||
| Patients | 1.41 | ||
| Distance CMx | 0.67 | ||
| Distance CMy | 8.50 | ||
| Distance CMz | 13.30 | ||
| Residuals (ε0) | Median | First quartile | Third quartile |
| –0.07 | −0.13 | −0.03 |
Imaging values and location are included as fixed effects; patient and spatial coordinates as random effects.
Figure 5.
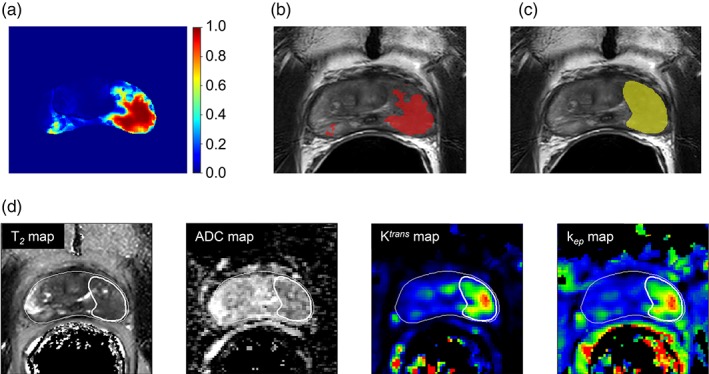
A reconstructed probability map based on the generalized linear mixed model (a). In red, overlaid on the T2w scan (b), is the same probability map thresholded at 0.5 and in (c), in yellow, the original tumor delineation. The anatomical and functional maps are presented in (d), together with the prostate and tumor delineations in white.
Discussion
In this study mp‐MRI was used to quantitatively describe and distinguish benign prostate tissue from recurrent PCa after RT. The use of two patient cohorts, with and without recurrent PCa, allowed us to show that tumor unaffected areas were similar in both groups. Compared with the pretreatment setting, and with the exception of ADC in the PZ, all other imaging values (T2, Ktrans, and kep) were lower, but also more homogeneous between the PZ and CG. This is in agreement with literature describing the loss of zonal distinction in the post‐RT setting.4 Still, significant differences between the imaging values of PZ and CG were seen in both recurrent and nonrecurrent patients. As in primary disease, recurrent tumor occurred predominantly in the PZ. This is not surprising, as recurrence usually happens at the site of primary PCa.19 For all maps, values of recurrent tumor were not significantly different from those of primary PCa.
With all imaging maps, we found that the PZ was significantly different from recurrent tumor, illustrating that all quantitative maps seem to have the potential to distinguish tumor in this region. However, tumor detection in the CG is challenging using solely the T2 map, as the values for benign CG and tumor are not significantly different. This distinction is possible when evaluating ADC, Ktrans, and kep. The PI‐RADS v216 is the standard radiological guideline for the diagnosis of primary PCa. These guidelines do not apply to the detection of suspected recurrent PCa following treatment. Yet, in the absence of further guidance, PI‐RADS v2 is often used as a starting point for image assessment. The guideline describes T2w as the dominant mp‐MRI sequence for the diagnosis of primary PCa in the transition zone. Our results suggest that this sequence is of less relevance compared with the other mp‐MRI sequences when diagnosing recurrent PCa in this region. The results also suggest that DCE‐MRI has an important role in the diagnosis of recurrent disease. In nonirradiated prostate tissue, the presence of benign prostatic hyperplasia (BPH) in the central gland is an important imaging confounder for the use of DCE‐MRI in this region. In a previous study, pathology slides from salvage prostatectomy specimens of recurrent PCa patients after RT were registered to mp‐MRI acquired prior to the surgery. In the analyzed pathology, no BPH could be found.20 This suggests that BPH vanishes after RT. The enhancement in the peri‐urethral area remains and needs to be considered. It has been hypothesized that the fibrotic changes observed in irradiated prostates,21 and the decreased microvasculature associated with atrophic tissue, enhance the neovascularity of recurrent tumor relative to the remainder benign atrophic tissue.22
With overall median values below 100 msec, T2 is decreased for the prostate as a whole after RT. Measured T2 values (msec) were in agreement with a previous study observing the effects of RT in prostate tissue23 (at week 8 of the RT treatment, mean ± SD: PZ = 89 ± 13, CG = 76 ± 5, tumor = 75 ± 9) and they provide evidence that the PZ and CG values do not increase after these 8 weeks.
The ADC values (in 10−3 mm2/sec) obtained for recurrent tumor were similar to those reported in other studies (mean ± SD: 1.0 ± 0.1 and 0.98 ± 0.23).24, 25 Tumor values in the untreated cohort were also comparable to those previously described (tumor PZ, mean ± SD: 1.08 ± 0.39).26 Values for benign prostate tissue in our case and control cohorts were slightly lower than those reported by others (mean ± SD: 1.6 ± 0.2 and 1.60 ± 0.21; ×10−3mm2/sec).24, 25 We note that these studies did not distinguish PZ from CG and reported values for a composite of both regions. In our untreated cohort, benign prostate tissue showed slightly lower values than those seen by Sato et al (mean ± SD: 1.80 ± 0.41 for PZ and 1.58 ± 0.37 for the transition zone).26
In controls, the PU region exhibited high Ktrans and kep values without signs of malignancy. Similar high values were found in cases and this enhancement strongly overlapped with tumor values, which might represent a confounder for tumor detection in the CG. Yet with kep significant differences were seen between tumor and PU, suggesting that this could be a relevant parameter when assessing the CG. This effect has been previously described in the recurrent setting,6, 27 potentially as a result of remaining BPH or peri‐urethral vasculature. Donati et al28 found no additional benefit of DCE when complementing T2w and DWI, which could have been the result of benign CG enhancement.
The GLMM analysis revealed that tumor distinction was optimized with the use of mp‐MRI, highlighting the importance of using a combination of anatomical and functional sequences when identifying and localizing tumor for salvage treatment strategies. Our study did not include spectroscopic data. Nonetheless, spectroscopic data has been suggested as a valuable tool for recurrent tumor distinction.24
Quantitative tissue characterization enables a more straightforward comparison between subjects, studies, and centers. It also conveys important information to adapt the scanning protocols to better image this study population. As an example, for patients with suspected recurrence the sampling echo times for T2 mapping should be shortened, as T2 decay is expected to be shorter compared with untreated patients.
We aimed to circumvent the limitations of a 2D standard transrectal ultrasound (TRUS)‐guided systematic biopsy by using a 3D MRI‐TRUS fusion approach to target the tumor‐suspected region. With this technique's improved spatial information, it has been described that fewer cores were necessary to detect more clinically significant cancer,29 often leading to reclassification of primary tumors in higher‐risk categories.30 Nonetheless, for a subset of our patients, cancer was only confirmed with repeated biopsy. Even when navigated, the biopsy procedure is limited by possible coregistration errors and in delivering the biopsy needle to the intended point.31 Tumor delineations performed using 1.5T T2w were shown to underestimate the true tumor volume when compared with prostatectomy samples.19 As a result, the detection rates of MRI‐TRUS fusion biopsies might also be affected by errors in defining the lesion to target.
Our study has several limitations. First, it was a single hospital study with a limited number of patients. The controls were recruited to match the characteristics of cases as best as possible, and no significant differences were seen between their clinical parameters. However, our cohort of cases and controls had significantly higher‐risk primary PCa when compared with the untreated patients. Thus, the reported imaging differences for benign tissue could theoretically arise from baseline imaging dissimilarities. No significant imaging differences were seen between the tumors in the untreated and recurrent cohorts.
Ideally, using salvage prostatectomy specimens as the standard of reference would be preferred to accurately identify cancer location, but this procedure is only sporadically performed. Thus, patients with an inconclusive diagnosis were analyzed separately to avoid a potential bias. The diagnosis of recurrent disease is in practice made with a combination of mp‐MRI and PSMA‐PET findings. In this study we opted to individually investigate the properties of MRI which, due to its higher spatial resolution, is better suited for the purpose of tumor localization. A combination of both modalities can certainly help better select patients suitable for salvage treatment. Lastly, our GLMM was not tested in an independent cohort. Thus, further validation is required to establish applicability to other populations. The model is also potentially reflecting delineation practices.
In conclusion, tumor unaffected areas were similar between recurrent and nonrecurrent patients, and generally with lower and more homogeneous values than before RT. The PU region presents with increased enhancement in the pharmacokinetic maps for both cases and controls. Analysis of mp‐MRI, with the quantitative maps T2, ADC, Ktrans, and kep together with location information resulted in optimal distinction between tumor and benign voxels. The ability to accurately localize tumor and distinguish it from benign tissue with the use of mp‐MRI will help in the design of focal salvage treatment strategies for locally recurrent PCa.
Supporting information
Supplementary Table 1 – Sequence specific parameters.
Supplementary Table 2 – Median of all patient's median values for each region and imaging sequence for the inconclusive cohort. Minimum and maximum values are presented between brackets.
Acknowledgments
Contract grant sponsor: Dutch Cancer Society; Contract grant number: NKI 2013–5937 and project 10088.
The authors thank Susanne van der Sanden, Manon Verwijs, Corinne Tillier, Barry Doodeman, Gerbert Vrijenhoek, and Tineke Vijlbrief‐Bosman for help with patient inclusion. We also thank Katarzyna Jozwiak for providing valuable statistical advice.
References
- 1. Michalski J, Winter K, Roach M, et al. Clinical outcome of patients treated with 3D conformal radiation therapy (3D‐CRT) for prostate cancer on RTOG 9406. Int J Radiat Oncol Biol Phys 2012;83:363–370. [DOI] [PMC free article] [PubMed] [Google Scholar]
- 2. Hruby G, Eade T, Kneebone A, et al. Delineating biochemical failure with 68Ga‐PSMA‐PET following definitive external beam radiation treatment for prostate cancer. Radiother Oncol 2017;122:99–102. [DOI] [PubMed] [Google Scholar]
- 3. Bolla M, Tienhoven G, Warde P, Dubois JB, Mirimanoff RO, Storme G. External irradiation with or without long‐term androgen suppression for prostate cancer with high metastatic risk: 10‐year results of an EORTC randomised study. Lancet Oncol 2010;11:1066–1073. [DOI] [PubMed] [Google Scholar]
- 4. Vargas HA, Wassberg C, Akin O, Hricak H. MR imaging of treated prostate cancer. Radiology 2012;262:26–42. [DOI] [PMC free article] [PubMed] [Google Scholar]
- 5. Pucar D, Shukla‐Dave A, Hricak H, et al. Prostate cancer: Correlation of MR imaging and MR spectroscopy with pathologic findings after radiation therapy‐initial experience. Radiology 2005;236:545–553. [DOI] [PMC free article] [PubMed] [Google Scholar]
- 6. Rouviere O, Valette O, Grivolat S, et al. Recurrent prostate cancer after external beam radiotherapy: Value of contrast‐enhanced dynamic MRI in localizing intraprostatic tumor‐correlation with biopsy findings. Urology 2004;63:922–927. [DOI] [PubMed] [Google Scholar]
- 7. Haider MA, Chung P, Sweet J, et al. Dynamic contrast‐enhanced magnetic resonance imaging for localization of recurrent prostate cancer after external beam radiotherapy. Int J Radiat Oncol Biol Phys 2008;70:425–430. [DOI] [PubMed] [Google Scholar]
- 8. Akin O, Gultekin DH, Vargas HA, et al. Incremental value of diffusion weighted and dynamic contrast enhanced MRI in the detection of locally recurrent prostate cancer after radiation treatment: Preliminary results. Eur Radiol 2011;21:1970–1978. [DOI] [PMC free article] [PubMed] [Google Scholar]
- 9. Abramowitz MC, Li T, Buyyounouski MK, et al. The Phoenix definition of biochemical failure predicts for overall survival in patients with prostate cancer. Cancer 2008;112:55–60. [DOI] [PubMed] [Google Scholar]
- 10. Horwich A, Parker C, Bangma C, Kataja V. Prostate cancer: ESMO Clinical Practice Guidelines for diagnosis, treatment and follow‐up. Ann Oncol 2010;21(Suppl 5):129–133. [DOI] [PubMed] [Google Scholar]
- 11. Rodrigues G, Warde P, Pickles T, et al. Pre‐treatment risk stratification of prostate cancer patients: A critical review. Can Urol Assoc J 2012;6:121–127. [DOI] [PMC free article] [PubMed] [Google Scholar]
- 12. van Houdt PJ, Agarwal HK, van Buuren LD, et al. Performance of a fast and high‐resolution multi‐echo spin‐echo sequence for prostate T2 mapping across multiple systems. Magn Reson Med 2017;79:1586–1594. [DOI] [PMC free article] [PubMed] [Google Scholar]
- 13. van Schie MA, Steenbergen P, Dinh CV, et al. Repeatability of dose painting by numbers treatment planning in prostate cancer radiotherapy based on multiparametric magnetic resonance imaging. Phys Med Biol 2017;62:5575–5588. [DOI] [PubMed] [Google Scholar]
- 14. Murase K, Yamazaki Y, Miyazaki S. Deconvolution analysis of dynamic contrast‐enhanced data based on singular value decomposition optimized by generalized cross validation. Magn Reson Med Sci 2004;3:165–175. [DOI] [PubMed] [Google Scholar]
- 15. Schabel MC, Morrell GR. Uncertainty in T1 mapping using the variable flip angle method with two flip angles. Phys Med Biol 2009;54:N1–8. [DOI] [PubMed] [Google Scholar]
- 16. Weinreb JC, Barentsz JO, Choyke PL, et al. PI‐RADS Prostate Imaging — Reporting and Data System: 2015, Version 2. Eur Urol 2016;69:16–40. [DOI] [PMC free article] [PubMed] [Google Scholar]
- 17. Team RDC . R: A Language and Environment for Statistical Computing. Vienna, Austria: R Foundation for Statistical Computing; 2014. [Google Scholar]
- 18. Bates D, Mächler M, Bolker B, Walker S. Fitting linear mixed‐effects models using lme4. J Stat Software; Vol 1, 2015. [Google Scholar]
- 19. Pucar D, Hricak H, Shukla‐Dave A, et al. Clinically significant prostate cancer local recurrence after radiation therapy occurs at the site of primary tumor: Magnetic resonance imaging and step‐section pathology evidence. Int J Radiat Oncol Biol Phys 2007;69:62–69. [DOI] [PubMed] [Google Scholar]
- 20. Dinis Fernandes C, Ghobadi G, van der Poel H, et al. Quantitative 3‐T multi‐parametric MRI and step‐section pathology of recurrent prostate cancer patients after radiation therapy. Eur Radiol 2018; doi: 10.1007/s00330‐018‐5819‐y [Epub ahead of print]. [DOI] [PMC free article] [PubMed] [Google Scholar]
- 21. Sheaff MT, Baithun SI. Effects of radiation on the normal prostate gland. Histopathology 1997;30:341–348. [DOI] [PubMed] [Google Scholar]
- 22. Oppenheimer DC, Weinberg EP, Hollenberg GM, Meyers SP. Multiparametric magnetic resonance imaging of recurrent prostate cancer. J Clin Imaging Sci 2016;6:18. [DOI] [PMC free article] [PubMed] [Google Scholar]
- 23. Foltz WD, Wu A, Chung P, et al. Changes in apparent diffusion coefficient and T2 relaxation during radiotherapy for prostate cancer. J Magn Reson Imaging 2013;37:909–916. [DOI] [PubMed] [Google Scholar]
- 24. Westphalen AC, Reed GD, Vinh PP, Sotto C, Vigneron DB, Kurhanewicz J. Multiparametric 3T endorectal MRI after external beam radiation therapy for prostate cancer. J Magn Reson Imaging 2012;36:430–437. [DOI] [PMC free article] [PubMed] [Google Scholar]
- 25. Kim CK, Park BK, Lee HM. Prediction of locally recurrent prostate cancer after radiation therapy: Incremental value of 3T diffusion‐weighted MRI. J Magn Reson Imaging 2009;29:391–397. [DOI] [PubMed] [Google Scholar]
- 26. Sato C, Naganawa S, Nakamura T, et al. Differentiation of noncancerous tissue and cancer lesions by apparent diffusion coefficient values in transition and peripheral zones of the prostate. J Magn Reson Imaging 2005;21:258–262. [DOI] [PubMed] [Google Scholar]
- 27. Moman MR, van den Berg CAT, Boeken Kruger AE, et al. Focal salvage guided by T2‐weighted and dynamic contrast‐enhanced magnetic resonance imaging for prostate cancer recurrences. Int J Radiat Oncol Biol Phys 2010;76:741–746. [DOI] [PubMed] [Google Scholar]
- 28. Donati OF, Vargas HA, Gultekin DH, et al. Multiparametric prostate MR imaging with T2‐weighted, diffusion‐weighted, and dynamic contrast‐enhanced sequences: Are all pulse sequences necessary to detect locally recurrent prostate cancer after radiation therapy? Radiology 2013;268:440–450. [DOI] [PMC free article] [PubMed] [Google Scholar]
- 29. Valerio M, Donaldson I, Emberton M, et al. Detection of clinically significant prostate cancer using magnetic resonance imaging‐ultrasound fusion targeted biopsy: A systematic review. Eur Urol 2015;68:8–19. [DOI] [PubMed] [Google Scholar]
- 30. Dix DB, McDonald AM, Gordetsky JB, Nix JW, Thomas JV, Rais‐Bahrami S. How would MRI‐targeted prostate biopsy alter radiation therapy approaches in treating prostate cancer? Urology 2018. [Epub ahead of print]. [DOI] [PMC free article] [PubMed] [Google Scholar]
- 31. Martin PR, Cool DW, Fenster A, Ward AD. A comparison of prostate tumor targeting strategies using magnetic resonance imaging‐targeted, transrectal ultrasound‐guided fusion biopsy. Med Phys 2018;45:1018–1028. [DOI] [PubMed] [Google Scholar]
Associated Data
This section collects any data citations, data availability statements, or supplementary materials included in this article.
Supplementary Materials
Supplementary Table 1 – Sequence specific parameters.
Supplementary Table 2 – Median of all patient's median values for each region and imaging sequence for the inconclusive cohort. Minimum and maximum values are presented between brackets.