

Abstract
Neutrophil gelatinase‐associated lipocalin (NGAL), also known as Lipocalin 2, is an antimicrobial protein, encoded by the gene LCN2, strongly upregulated in inflammatory bowel disease (IBD) and a promising biomarker for IBD. Here we demonstrate that NGAL is highly expressed in all parts of pyloric metaplasia, also known as the ulcer‐associated cell lineage (UACL), a metaplastic cell lineage suggested to play a role in wound healing in Crohn's disease (CD). We further show NGAL expression in regenerative intestinal crypts and in undifferentiated patient‐derived colonoids. This indicates that NGAL is important in the tissue regeneration process. The remarkable overexpression of NGAL in UACL led us to explore the pathobiology of these cells by transcriptome‐wide RNA sequencing. This study is, to our knowledge, the first to characterize the UACL at this level. Biopsies with UACL and inflamed non‐UACL epithelium from the terminal ileum of CD patients and epithelium from healthy controls were laser capture microdissected for RNA sequencing. Among the 180 genes differentially expressed between UACL and control epithelium, the ten most‐upregulated genes specific for UACL were MUC5AC, PGC, MUC6, MUC5B, LCN2, POU2AF1, MUC1, SDC3, IGFBP5, and SLC7A5. PDX1 was among the most upregulated in both UACL and inflamed non‐UACL epithelium. Immunohistochemistry and iDisco 3D visualization was used to characterize UACL histo‐morphologically, and to validate protein expression of 11 selected differentially expressed genes. Among these genes, LCN2, NOTCH2, PHLDA1, IGFBP5, SDC3, BPIFB1, and RCN1 have previously not been linked to UACL. Gene expression results were analyzed for functional implications using MetaCore, showing that differentially expressed genes are enriched for genes involved in cell migration and motility, and for biomarkers of gastrointestinal neoplasia. These results support a role for UACL as part of the reepithelialization process during and after destructive intestinal inflammation. © 2019 The Authors. The Journal of Pathology published by John Wiley & Sons Ltd on behalf of Pathological Society of Great Britain and Ireland.
Keywords: NGAL, IBD, CD, UACL, pyloric metaplasia, wound healing, regeneration
Introduction
The glycoprotein neutrophil gelatinase‐associated lipocalin (NGAL) (also known as lipocalin 2 or siderocalin) has attracted interest due to its antimicrobial properties and expression in various cancer types and in inflammatory disorders. Nielsen et al 1 and our group 2 have found that the gene coding for NGAL, LCN2, is strongly upregulated in biopsies from patients with active ulcerative colitis (UC) and colitis in Crohn's disease (CD). We have shown that fecal NGAL is massively increased in active inflammatory bowel disease (IBD) with properties making it a promising biomarker 3.
We recently reported that NGAL/LCN2 was markedly upregulated also in small intestinal CD 4. In the healthy ileum, NGAL was expressed by Paneth cells and enteroendocrine cells, and the upregulation seen during inflammation was due to increased expression in epithelial cells. Notably, in contrast to the inflamed colonic epithelium where NGAL was evenly expressed, staining of the small intestinal epithelium showed a more patchy expression of NGAL.
In the present study we show that NGAL's patchy appearance is due to expression in epithelium known as the ulcer‐associated cell lineage (UACL). UACL can be found in the ulcer margins of patients with CD, and is believed to have a role in the wound healing process 5, 6, 7. The UACL is also known as pyloric metaplasia due to its morphological appearance and content of gastric mucins. It expresses proteins such as members of the trefoil factor family (TFF) known to confer a protective effect on the intestinal mucosa 8, and growth factors including TGFα and EGF 9. The cell lineage seems to develop from crypts adjacent to ulcerations, forming a complex of apparently disorganized structures before maturing and developing a stem cell niche providing cells migrating to the gut lumen 5. UACL is a common finding in ileal CD with prevalence of 22–87% 5, 10, 11, it is most often seen when examining inflamed, ulcerated mucosa. Similar crypts can be found in CD of the colon, adjacent to gastric‐ and duodenal ulcers, in cholecystitis and pancreatitis, and there are even reports of pyloric metaplasia in salpingitis and in the uterine cervix 12, 13.
In contrast to intestinal metaplasia in the esophagus and stomach, small intestinal UACL has not been related to an increased cancer risk. Recent reports have, however, pointed to an increased cancer risk also in small intestinal CD 14, 15 and one report suggested a connection between UACL and CD enteritis‐associated small bowel adenocarcinoma 16.
UACL is still not fully understood and the role of NGAL, other than as an antimicrobial peptide in an inflammatory gut environment, is far from clear. This study aimed therefore to study NGAL in the UACL, together with obtaining a molecular and histological characterization of UACL in the intestinal mucosa.
Methods
Patients and biopsies
Study subjects were recruited among patients with UC or CD coming to ileocolonoscopy or ileocecal resections at the Department of Gastroenterology or Department of Gastrointestinal Surgery, St Olav's University Hospital, Trondheim, Norway. Control subjects were patients with no known gastrointestinal disorders and with normal ileocolonoscopies. Biopsies were taken from colon, ileum or from neo‐terminal ileum in operated patients. An experienced pathologist classified the biopsies into normal, chronic or active inflammation. Biopsies with UACL were identified using sections stained with H&E or Alcian Blue (AB)/PAS (Merck, Darmstadt, Germany). All participants gave written informed consent, and the study was approved by the Regional Committee for Medical and Health Research Ethics, approval nos. 5.2007.910 and 2013/212/REKmidt.
Immunohistochemistry and in situ hybridization
Formalin‐fixed paraffin‐embedded (FFPE) biopsies were cut into 4 μm thick sections and mounted on glass slides. The following primary antibodies were used for immunohistochemistry (IHC): NGAL (Bioporto, Hellerup, Denmark), Muc2, Muc5AC, PGC, Lysozyme, Notch2, SDC3 (all Abcam, Cambridge, UK), Ki‐67, CgA, CK20 (all Dako, Glostrup, Denmark), RCN1, BPIFB1, FABP1 (Merck), IGFBP5 (R&D, Minneapolis, MN, USA) and PHLDA1 (Santa Cruz, Dallas, TX, USA). All catalog‐numbers, full names and dilutions are listed in supplementary material, Table S1. A primary antibody was applied for 1 h at room temperature or 4 °C overnight. The secondary layer was rabbit/mouse EnVision‐HRP (Dako) or anti‐Goat (1:150) with Vectastain ABC HRP kit (Vector Laboratories, Burlingame, CA, USA, cat. no. BA‐5000 and PK‐4000, respectively) and visualization was accomplished using DAB+ (Dako, cat. no. K5007) before counterstaining with hematoxylin. Omitting the primary antibody or matching‐isotype immunoglobulin was used as negative controls. Serial sections from at least eight biopsies from ileum with active CD and UACL, and six biopsies from controls were examined to verify gene expression results. For NGAL expression in colon, ten biopsies with inflamed CD or UC were examined, of which three contained UACL.
In situ hybridization (ISH) was performed using custom RNAscope probes (Advanced Cell Diagnostics, Hayward, CA, USA), according to the manufacturer's protocol. Negative (DAPB) and positive (UBC) control probes were included.
iDisco staining
Whole‐mount immunostaining for 3D visualization of small intestinal mucosa was done according to the iDISCO+ protocol 17. The protocol used is the version as of December 2016, available at the online resource https://idisco.info/, with n = 4 days. Tissue was stained using anti‐NGAL as primary‐, and Alexa Fluor 647‐tagged Goat anti‐mouse (1:2500, Thermo Fisher Scientific, Waltham, MA, USA, cat. no. A28181, RRID AB_2536165) as secondary antibody. Hoechst 33342 (1 μg/ml, Thermo Fisher Scientific, cat. no. 62249) was used as a counterstain. Further details of the clearing and staining procedure and of the confocal imaging can be found in supplementary material, Supplementary materials and methods.
Laser capture microdissection
Ileal biopsies from six patients with active CD with UACL and seven controls were used for microdissection and gene expression analysis. Clinical and demographic characteristics of the study subjects are given in supplementary material, Table S2. The FFPE biopsies were cut into 10 μm sections, mounted on glass slides and stained with AB‐PAS in order to identify UACL. The sections were treated in 100% ethanol and xylene in order to remove all traces of H2O. Sections were then air‐dried in a desiccator (30 min) before laser capture microdissection (LCM) (MMI CellCut on Olympus IX71, Eching, Germany). UACL glands, inflamed non‐UACL epithelium (crypts and villi) from the same biopsies and epithelium from controls were isolated. In sections with ample amounts of epithelium available, a maximum area of 500 000 μm2 (approx. 5000 cells) was isolated. For some sections, particularly for the UACL structures, significantly smaller areas could be isolated. Details of isolated area for each sample can be found in supplementary material, Table S3. Supplementary material, Figure S1 shows an example of the microdissection process. After LCM, the isolated cells were immediately transferred to buffer from the RNA extraction kit and stored at −80 °C.
RNA isolation, library preparation and sequencing
Total RNA was extracted from LCM material, using an RNeasy FFPE kit (Qiagen, Hilden, Germany, cat. no. 73504) according to the manufacturer's instructions. RNA integrity was assessed using an Agilent RNA 6000 Pico Kit on a 2100 Bioanalyzer instrument (Agilent Technologies, Santa Clara, CA, USA). The DV200 value (percentage of RNA fragments >200 nucleotides) was used as a measure of RNA quality. The mean DV200 values for the samples were 72.0 ± 12.6%. (details in Supplementary material, Table S3). RNA‐sequencing libraries are described in supplementary materials, Supplementary materials and methods.
Libraries were normalized and pooled before denaturation, final concentration of the library was 2.7 pm for clustering on NextSeq 500 high output flowcells. Single read sequencing was performed for 75 cycles on a NextSeq 500 instrument (Illumina Inc., San Diego, CA, USA), according to the manufacturer's instructions. Base calling was done by RTA 2.4.6. FASTQ files were generated using bcl2fastq2 Conversion Software v2.17 (Illumina Inc.).
For RNA‐sequencing analysis the gene abundance quantification was done with featureCounts 18 after alignment of the reads to the genome (GRCh38, release 7) using STAR v2.4.1b. Gene models were defined by protein‐coding genes in the Ensembl GTF file for the GRCh38 genome. Genes that did not meet the criterion of a gene count above three in more than five samples were filtered out. The matrix of filtered read counts were imported to R, normalized using trimmed mean of M‐values (TMM) and subsequently voom normalized 19. Differential expression was identified by linear models using the edgeR/limma packages and significance decided by Benjamini–Hochberg false discovery rate adjusted P values ≤0.05. RNA sequencing data were deposited in the Gene Expression Omnibus (GEO) repository and assigned the GEO accession number GSE126299.
Pathway analysis
Gene ontology (GO) processes of the genes in the UACL gene signature were analyzed using the MetaCore analysis suite (GeneGo Inc., http://www.genego.com). Genes over‐expressed with p < 0.1 in UACL versus controls, and not regulated in inflamed non‐UACL epithelium versus controls (p > 0.2), were entered into the analysis program. Very unspecific GO processes containing >1500 genes like e.g. ‘positive regulation of cellular process’ were excluded. Diseases (by biomarkers) were ranked after ‘MetaCore disease association analysis’.
Human colonoids
We used a protocol 20 based on that of Sato et al 21 to isolate intestinal crypts from colon pinch biopsies from three healthy subjects. After culturing in basement membrane matrix (Matrigel, Corning Life Sciences, Tewksbury, MA, USA; cat. no. 734‐1101) and medium containing factors critical for stem cell growth (e.g. Wnt3a, R‐Spondin and Noggin), the crypts reestablished themselves as three‐dimensional spheroids. For differentiation, the medium was changed 5–7 days after splitting, by diminishing Wnt3a concentration, removing nicotinamide and the MAPK inhibitor SB202190 and adding the pan‐Notch inhibitor DAPT to the medium. After 4 or 5 days of differentiation the matrigel was depolymerized by cell recovery solution (Corning, Corning, NY, USA, cat. no. 354253), and the colonoids centrifuged (500 × g). Five microliters of plasma and 1 μl thrombin solution was added to colonoid‐pellets and allowed to coagulate before formalin fixation for 48 h. The colonoids were then paraffinized, and after deparaffinization IHC and ISH was performed according to their respective protocols. IHC for the markers LGR5 (stem cells), FABP1 (absorptive cells), MUC2 (goblet cells), and CgA (enteroendocrine cells) was done to confirm successful differentiation with four known colonic cell types represented (data not shown).
Enzyme‐linked immunosorbent assay
NGAL levels in supernatant from colonoid culture were measured using human LCN2/NGAL ELISA (R&D Systems, Minneapolis, MN, USA, cat. no. DY1757), according to the manufacturer's protocol. Supernatant from each technical replicate was assayed in duplicate, after dilution 1:40 in PBS + 0.1%BSA.
Statistics
Statistical analysis was performed using the Prism 5 software program (GraphPad Software, San Diego, CA, USA). A Wilcoxon matched‐pairs signed rank test was used for the comparison of secreted NGAL from differentiated and undifferentiated colonoids from seven individual experiments, and a Kruskal–Wallis test for comparison of secreted NGAL after stimulation with various factors (based on results from three independent biological replicates). Significant values were defined as p < 0.05 (two‐sided) if not otherwise stated.
Results
NGAL is strongly expressed in UACL and regenerative colonic epithelium
The UACL differs in cellular composition from its early basal buds to the surface epithelium 22. We used IHC and ISH to explore NGAL's expression in the various parts of UACL in ileum and colon from patients with CD. NGAL was strongly expressed in UACL in all biopsies examined. Figure 1A–D shows positive staining for NGAL/LCN2 in all parts of UACL from the early buds to the ductular‐ and surface cells. Some single or confluent AB/PAS positive cells at the bottom of the crypts also strongly expressed NGAL and could be part of the early UACL‐process (Figure 1B). NGAL was expressed in both proliferating and nonproliferating parts of UACL as assessed by Ki‐67‐staining of serial sections (Figure 1C). Here we also observed positive staining for the stem cell marker LGR5 in a Ki‐67‐positive crypt bottom directly adjacent to UACL, while LGR5 was absent in the UACL. NGAL was strongly expressed in regenerative, branching crypts in active UC and CD in colon (Figure 1E).
Figure 1.
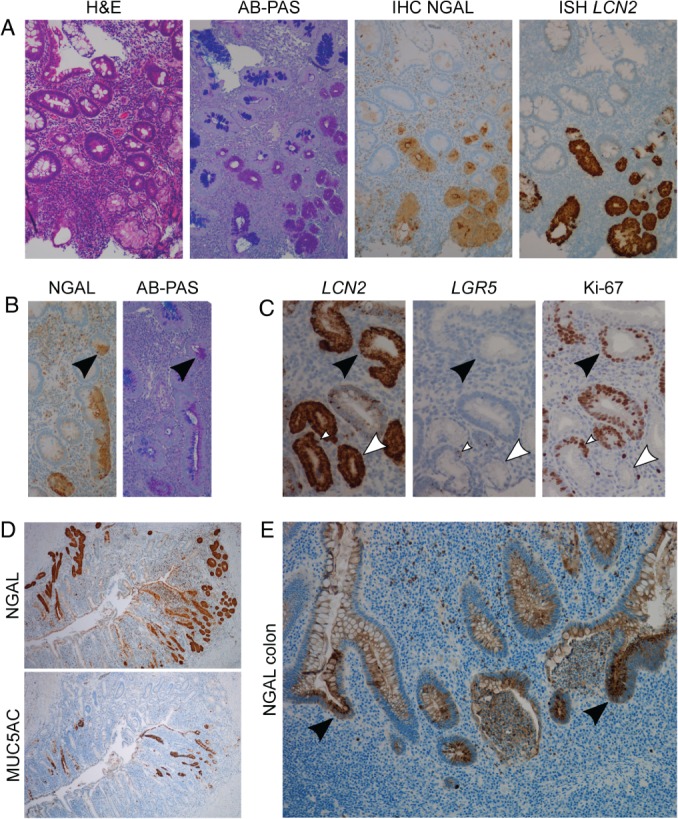
NGAL/LCN2 is expressed in all stages of small intestinal UACL and in colonic regenerative crypts. (A) Serial sections (from left to right) showing H&E, AB‐PAS, IHC for NGAL and ISH for LCN2 with positivity in UACL‐crypts. (B) IHC NGAL (left) and AB‐PAS (right) showing scattered NGAL and AB/PAS positive cells possibly part of the early formation of UACL buds. (C) Serial sections with ISH LCN2, ISH LGR5 and IHC Ki‐67 showing LCN2 in both proliferating (black arrows) and nonproliferating (white arrows) parts of the UACL. LGR5‐positive stem cell area in adjunction with UACL marked with white arrow‐head. (D) Serial sections with IHC for NGAL (top) and MUC5AC (bottom) showing NGAL expression in all parts of UACL, while MUC5AC was expressed mainly toward the lumen of the bowel. (E) IHC for NGAL in colonic non‐UACL inflamed epithelium with crypt abscesses and branching. NGAL expression is intense in the reactive and branching epithelium (arrows). NGAL is also expressed in granulocytes and in cell debris.
UACL shows a distinct gene expression signature compared to control epithelium
The prominent staining of NGAL in UACL led us to perform a transcriptome‐wide RNA sequencing of microdissected UACL. We found 180 genes to be differentially expressed (p < 0.05) between UACL and control epithelium (158 up‐/22 downregulated). Of these, 31 genes were also differentially expressed (p < 0.2) in inflamed non‐UACL epithelium compared to controls, among them DUOX2, CCL28, PDX1, and OLFM4. These were excluded in the enrichment analysis in order to identify genes specific for UACL. Excluded genes are listed in supplementary material, Table S4. A list of the 30 most‐upregulated genes specific for UACL is presented in Table 1. Gastric mucins MUC5AC, MUC6, and MUC5B as well as PGC (the gene coding for Gastricsin, also known as Pepsinogen C) were the most‐upregulated genes in UACL, confirming a gastric phenotype of UACL.
Table 1.
Top 30 protein‐coding genes significantly upregulated in UACL versus control epithelium and other genes of interest
| No. | Gene symbol | Gene name | Log FC | Adj. P value |
|---|---|---|---|---|
| 1 | MUC5AC | Mucin 5 AC, oligomeric mucus/gel‐forming | 15.51 | 0.0004 |
| 2 | PGC | Pepsinogen C | 14.48 | <0.0001 |
| 3 | MUC6 | Mucin 6, oligomeric mucus/gel‐forming | 12.60 | 0.01 |
| 4 | MUC5B | Mucin 5B, oligomeric mucus/gel‐forming | 12.08 | 0.0097 |
| 5 | LCN2 | Lipocalin 2 | 10.95 | 0.0016 |
| 6 | POU2AF1 | POU class 2 associating factor 1 | 10.32 | 0.0014 |
| 7 | MUC1 | Mucin 1, cell surface associated | 10.17 | <0.0001 |
| 8 | SDC3 | Syndecan 3 | 10.03 | 0.0008 |
| 9 | IGFBP5 | Insulin‐like growth factor binding protein 5 | 9.98 | 0.0009 |
| 10 | SLC7A5 | Solute carrier family 7 member 5 | 9.96 | 0.0037 |
| 11 | RCN1 | Reticulocalbin 1 | 9.35 | 0.0070 |
| 12 | PROM2 | Prominin 2 | 9.31 | 0.0027 |
| 13 | SOAT1 | Sterol O‐acetyltransferase 1 | 8.92 | 0.0070 |
| 14 | RAB11A | RAB11A, member RAS oncogene family | 8.81 | 0.0064 |
| 15 | COL18A1 | Collagen type XVIII alpha 1 chain | 8.54 | 0.0037 |
| 16 | GSPT1 | G1 to S phase transition 1 | 8.51 | 0.0142 |
| 17 | AURKB | Aurora kinase B | 8.46 | 0.0117 |
| 18 | MID1IP1 | MID1 interacting protein 1 | 8.41 | 0.0112 |
| 19 | LYZ | Lysozyme | 8.35 | 0.0003 |
| 20 | RBFOX2 | RNA binding protein fox‐1 homolog 2 | 8.35 | 0.0066 |
| 21 | PDE4A | phosphodiesterase 4A | 8.29 | 0.0190 |
| 22 | APOBEC3C | Apolipoprotein B mRNA editing enzyme catalytic subunit 3C | 8.28 | 0.0170 |
| 23 | RBPMS | RNA binding protein, mRNA processing factor | 8.25 | 0.0066 |
| 24 | MRPS30 | 39S ribosomal protein S30, mitochondrial | 8.20 | 0.0118 |
| 25 | RUNX1 | Runt related transcription factor 1 | 8.11 | 0.0118 |
| 26 | BPIFB1 | BPI fold‐containing family B member 1 | 8.08 | 0.0112 |
| 27 | UBAP2 | Ubiquitin‐associated protein 2 | 7.82 | 0.0097 |
| 28 | RCC2 | Regulator of chromosome condensation 2 | 7.77 | 0.0112 |
| 29 | CLDN2 | Claudin 2 | 7.77 | 0.0112 |
| 30 | PACS1 | Phosphofurin acidic cluster sorting protein 1 | 7.75 | 0.0112 |
| … | ||||
| 35 | TFF1 | Trefoil factor family 1 | 7.66 | 0.0118 |
| 77 | PHLDA1 | Pleckstrin homology‐like domain family A member 1 | 6.97 | 0.0371 |
| 95 | NOTCH2 | Notch 2 | 6.61 | 0.0085 |
Genes verified by IHC are written in bold. Genes upregulated (p < 0.2) in inflamed non‐UACL epithelium versus control were excluded and are listed in supplementary material, Table S4. UACL; ulcer‐associated cell lineage, Log FC; Log2 fold‐change, Adj.; adjusted.
The UACL gene expression signature was confirmed at protein level
To verify RNA‐sequencing results by protein expression we performed IHC for 11 selected proteins coded by differentially expressed genes. The genes were selected based on high expression or if considered interesting in the context of wound healing. MUC5AC, PGC, LCN2, SDC3, and IGFBP5 were all among the ten most‐upregulated genes. Other genes considered to be of particular pathobiological interests were LYZ, BPIFB1, RCN1, PHLDA1, NOTCH2, and MUC2. LYZ, like LCN2, is known to be expressed in Paneth cells, and BPIFB1 and RCN1 were chosen due to possible expression in Paneth cells based on literature and a search in Human Protein Atlas (www.proteinatlas.org), respectively. PHLDA1 was the most upregulated known stem cell marker. NOTCH2 is known to play an important role in epithelial homeostasis and regeneration. MUC2 is the main intestinal mucin, and the only downregulated among the chosen genes (Log fold‐change −2.54, p = 0.054).
Expression of the 11 proteins selected for IHC are shown in Figure 2. Insulin‐like growth factor‐binding protein 5 (gene IGFBP5) showed membrane staining in all parts of UACL, and staining of stem cells and villus epithelium in both controls and inflamed epithelium (Figure 2B). Mucin 5AC (gene MUC5AC) was seen in distal ductular‐ and surface cells only and was absent in controls (Figure 2C). Mucin 2 (gene MUC2) was absent in UACL but expressed in goblet cells of control and inflamed epithelium (Figure 2D). Reticulocalbin 1 (gene RCN1) was expressed in a subset of UACL, but also showed staining of non‐UACL inflamed crypts with strong staining of Paneth cells in controls and inflamed epithelium (Figure 2E). Pleckstrin homology‐like domain family A member 1 (gene PHLDA1) showed staining in stem cells and membrane staining in the UACL, most pronounced in acinar and proximal ductular parts. In addition there was prominent PHLDA1 staining of cells morphologically resembling myofibroblasts in ulcers and in the edges of damaged crypt epithelium (Figure 2F). Pepsinogen C (gene PGC) and lysozyme (gene LYZ) showed cytoplasmic staining in all parts of the UACL, and PGC was also present in single cells in the crypt bases most probably being part of the UACL, while lysozyme was expressed in Paneth cells and inflammatory cells (Figure 2G,H). BPI fold‐containing family B member 1, also known as LPLUNC (gene BPIFB1) stained a small subset of mature UACL‐crypts in addition to a subset of Paneth cells in controls and inflamed epithelium (Figure 2I). Notch2 and syndecan 3 (gene SDC3) also had most prominent staining in the distal parts of UACL and the two proteins showed a high grade of overlapping pattern with strong perinuclear staining corresponding the ER/Golgi in the distal crypts in addition to weaker membrane staining. NOTCH2‐positive membranes were present in the proximal ductular parts (Figure 2K,L).
Figure 2.
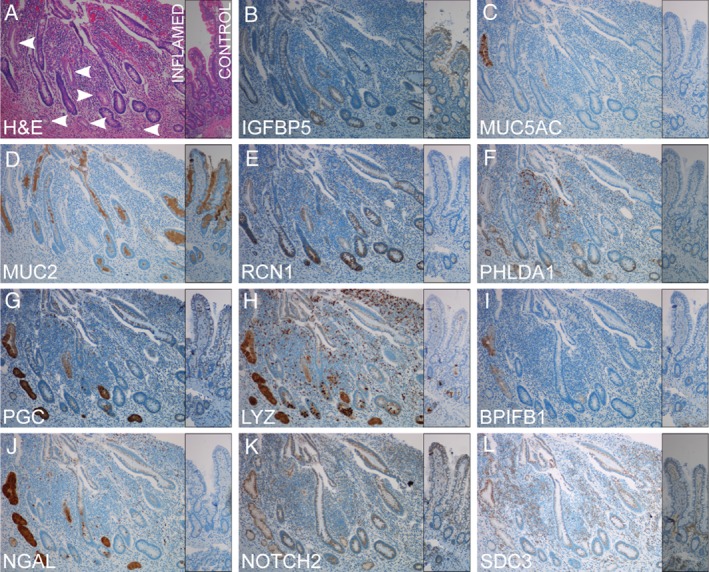
IHC for selected proteins encoded by genes differentially expressed in UACL confirms the RNA‐sequencing data from UACL‐crypts. All genes were upregulated except MUC2 which was significantly downregulated in the gene expression analysis. Serial sections from inflamed mucosa of active CD with UACL‐crypts (left) and normal control mucosa in comparison (narrow, right). (A) H&E. UACL marked with arrows. (B) Insulin‐like growth factor‐binding protein 5. (C) Mucin 5ac. (D) Mucin 2. (E) Reticulocalbin 1. (F) Pleckstrin homology‐like domain family A member 1. (G) Pepsinogen C. (H) Lysozyme. (I) BPI fold‐containing family B member 1. (J) Neutrophil gelatinase‐associated lipocalin. K Notch 2. L syndecan 3. ×10 objective magnification.
Three‐dimensional visualization underlines the abundance of UACL glands
The organization of UACL in the mucosa can be difficult to visualize in a planar histological section in the microscope. Their crypts are often seen in cross‐section as they make a 90° angle with the normal crypts. To further understand the structure of UACLs, we used the iDisco method for visualization of UACLs in a 3D‐format. A surgical specimen from ileum with inflamed and erosive CD was made transparent and stained for NGAL to identify the UACL‐crypts. The 3D‐image (Figure 3) unveiled numerous NGAL‐positive UACLs as continuous complex glands with several buddings along the whole gland length. A video showing multiple UACL‐crypts in a 3D format is available supplementary material, Movie S1.
Figure 3.
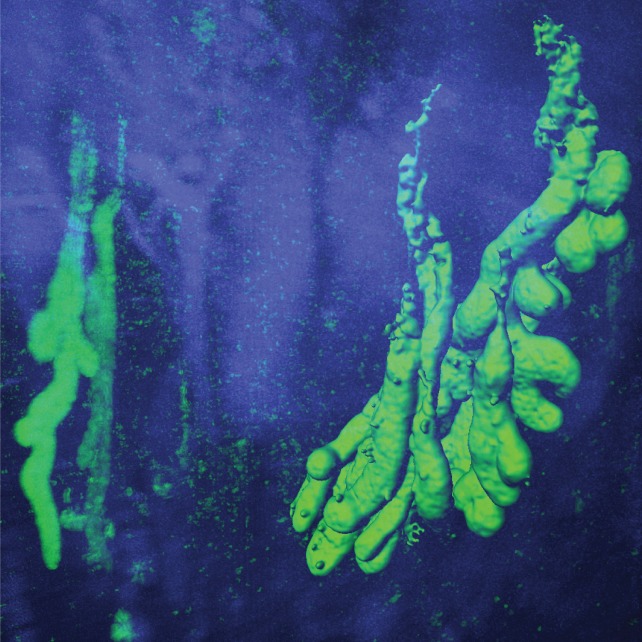
IDisco 3D surface visualization of NGAL‐positive (green) UACL‐crypts with buds and neutrophils in inflamed ileal mucosa from CD. Hoechst nuclear counterstain (blue).
Enrichment analysis of the UACL gene expression signature is compatible with a role in wound healing
We used the analysis program MetaCore to make an enrichment analysis of GO processes and significant networks associated with the genes overexpressed in UACL. Due to a high variance in the gene expression within the UACL group we chose to include genes with P values up to 0.1. Thus, a total of 279 genes were included in the analysis. Among the six most significant GO processes (when general processes with >1500 genes were excluded), five were related to regulation of migration/motility and gland development (Table 2). The genes implicated in the GO processes are listed in supplementary material, Table S5. Among the five most significant disease groups were colonic neoplasms, intestinal polyposis and stomach neoplasms, all conditions associated with aspects of cell growth (Table 2).
Table 2.
Most significant GO processes and diseases associated with the 279 genes upregulated in UACL versus controls
| P | FDR | Network objects from active data | |
|---|---|---|---|
| GO processes (processes containing > 1500 genes excluded) | |||
| 1. Positive regulation of cell migration | 2.62e−9 | 6.95e−7 | 28/727 |
| 2. Positive regulation of cellular component movement | 3.31e−9 | 7.96e−7 | 29/784 |
| 3. Positive regulation of cell motility | 6.32e−9 | 1.28e−6 | 28/757 |
| 4. Gland development | 7.44e−9 | 1.43e−6 | 29/813 |
| 5. Negative regulation of protein phosphorylation | 9.08e−9 | 1.58e−6 | 25/624 |
| 6. Regulation of cell migration | 1.2e−8 | 1.91e−6 | 35/1154 |
| Disease (by biomarkers) | |||
| 1. Colonic neoplasms | 6.58e−23 | 8.38e−20 | 67/1669 |
| 2. Colonic diseases | 9.01e−17 | 5.74e−14 | 113/5307 |
| 3. Intestinal polyposis | 9.63e−16 | 3.24e−13 | 17/107 |
| 4. Stomach neoplasia | 3.91e−15 | 1.24e−12 | 98/4444 |
| 5. Stomach diseases | 9.49e−15 | 2.42e−12 | 98/4505 |
FDR; false discovery rate; GO; gene ontology; UACL; ulcer‐associated cell lineage.
NGAL is strongly expressed in undifferentiated human colonoids
With increased expression of LCN2 in UACL and in regenerative crypts in colitis, we next studied if NGAL was expressed in developing, undifferentiated human colonoids, which may be considered a form of regenerative process from single stem cells. While differentiated colonoids contain mature cells like absorptive, goblet and neuroendocrine cells mimicking the in vivo normal epithelial layer, undifferentiated colonoids mainly consist of stem cells and immature epithelial cells. ISH and IHC indeed showed increasing LCN2/NGAL in undifferentiated colonoids during a growth period of 12 days (i.e. from single cells to spheroids) (Figure 4A). After differentiation, both intracellular expression and secretion of NGAL declined significantly compared to undifferentiated colonoids (p = 0.016) (Figure 4B,C).
Figure 4.
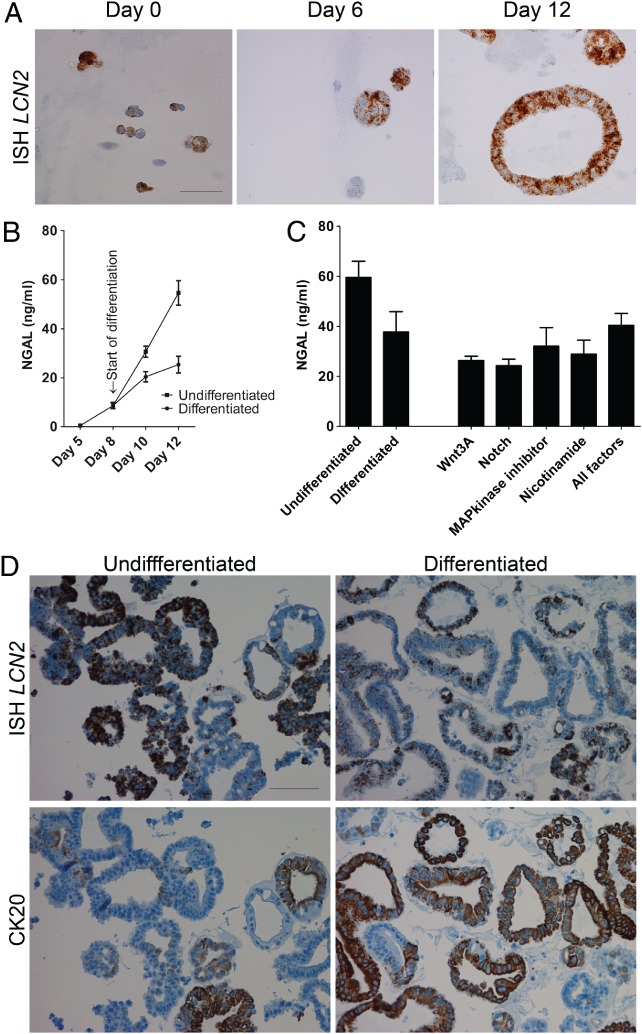
NGAL is expressed in undifferentiated human colonoids. (A) ISH for LCN2 in colonoids (from left to right) on day 0, day 6 and day 12. Scale bar 50 μm. (B) ELISA for NGAL in supernatants from cultures of colonoids kept undifferentiated, or being differentiated (Representative of n = 7. Start of differentiation on day 8.) (C) ELISA for NGAL in supernatants from cultures of undifferentiated and differentiated colonoids (first two columns), and colonoids differentiated for 2 days before restimulation with Wnt3a, Notch (by removing the notch‐inhibitor DAPT), MAP kinase inhibitor (SB202190), nicotinamide, or all four factors for 2 days (last five columns). Mean and SEM from n = 3 biological replicates. (D) Serial sections of undifferentiated (left) and differentiated (right) colonoids. ISH for LCN2 (top) and IHC for CK20 (bottom) shows LCN2 expression mainly in CK20‐negative, undifferentiated colonoids. Scale bar 100 μm.
To keep colonoids in an undifferentiated state, they were grown in a Wnt3A enriched medium 23. To examine if the various factors in the Wnt3A‐rich medium could induce NGAL expression also in differentiated cells, colonoids were differentiated for 48 or 72 h before addition of Wnt3A, nicotinamide, MAPK inhibitor (SB202190) and removal of the pan‐NOTCH inhibitor DAPT, either concomitantly or each factor alone. However, none of the factors could significantly increase NGAL in differentiated epithelium (Figure 4C). Serial sections stained for the proliferation marker Ki‐67 (data not shown) and differentiation marker CK20 showed that LCN2 expression was confined mainly to the undifferentiated, CK20‐negative, Ki‐67‐positive colonoids (Figure 4D). This suggests that NGAL is expressed during the proliferative phase of the colonoids, and disappears during the differentiation process.
Discussion
In line with our initial studies, we found NGAL/LCN2 to be strongly expressed in UACL, present in all parts from the early buds to the surface. The 3D immunofluorescence image of NGAL‐positive UACL shows the extent and morphology of UACL‐crypts in the mucosa. We further observed strong NGAL staining in colonic, branching, regenerative crypts. In patient‐derived colonoids we found a remarkable overexpression of NGAL/LCN2 in undifferentiated epithelium, disappearing during the differentiation process. This indicates that NGAL is important in tissue regeneration. Although not established for IBD, such a role for NGAL has been suggested in various studies, but the exact function of the protein is still unknown. Some studies have shown that NGAL increases migration of epithelial cells 24, 25, 26, others have shown a role in differentiation 27. NGAL is also known as an antibacterial protein 28, 29 that may serve a function in shaping the microbiota and protecting the intestinal barrier. However, the antibacterial activity seems an unlikely explanation for a potent upregulation in undifferentiated colonoids which is then switched off during maturation.
The remarkable overexpression of NGAL in UACL led us to explore the pathobiology of these cells by transcriptome‐wide RNA sequencing. This study is, to our knowledge, the first to characterize UACL at this level. Although RNA sequencing was performed on small samples yielding very little RNA, confirmation with IHC of 11 proteins encoded by mRNAs with various fold changes and P values shows that the results are highly reliable for genes identified as differentially expressed. Some genes coding for proteins known to be differentially expressed in UACL, such as TFF2, CDX2 and E‐cadherin 30, 31, are not among our differentially expressed genes although, e.g. E‐cadherin seems clearly downregulated by IHC. These genes were most probably not detected due to small sample sizes with little RNA extracted, reflecting that this transcriptome assay may have been conducted close to the limitations of the method.
Our analysis of the UACL transcriptome shows that the most significant networks based on an enrichment analysis are compatible with a role for UACL in wound healing. We chose to focus on GO process networks with less than 1500 objects in our results, as this opens for the more specific categories to become prominent. The analysis shows that the differentially expressed genes are enriched for genes involved in cell migration and motility, and for biomarkers of gastrointestinal neoplasia, supporting the understanding of a role for UACL as part of a reepithelialization or reparative process. The prominent upregulation of NGAL in UACL, together with the findings in our organoid preparations, make it likely that NGAL is a protein relevant for these processes although its precise role cannot be determined based on these results.
In addition to LCN2/NGAL, several of the genes upregulated in UACL were verified using IHC. Genes were chosen either because they are relevant in the context of wound healing, or had highly statistically significant differential expression between UACL and healthy control tissue. Among the interesting genes expressed in UACL and confirmed by IHC was NOTCH2. In combination with NOTCH1, NOTCH2 is known to play an important role in intestinal homeostasis 32. One study suggested that while NOTCH1 is the primary receptor in intestinal stem cell regulation, the combination of the two are important in cell fate determination and wound healing 33. NOTCH2 has also been found to be important for goblet cell metaplasia in the lung 34. In our IHC analysis we found an overlapping pattern between NOTCH2 and syndecan 3 (SDC3) in UACL. NOTCH and SDC3 have been shown to co‐localize and cooperate in homeostasis of the satellite cells and myofiber size in muscle. One study showed that SDC3 was required for NOTCH processing by ADAM 17/TNFa‐converting enzyme (TACE) and signal transduction 35. Whether such a cooperation exists in the intestine is yet to be explored. Another interesting gene confirmed with IHC was the highest upregulated stem cell marker PHLDA1, which has also been shown to play a role in migration 36.
UACL induction occurs in the proximity of Paneth cells and stem cells in crypt bases at ulcer margins, but the mechanisms are not known. In a recent publication, Goldenring 7 suggests that Paneth cells can be the origin of UACL due to UACL's origin in the crypt bases. Paneth cells express several proteins important for stem cell maintenance and cell growth like WNT, EGF, TGFα, and the Notch ligand DLL4 37. Moreover, recent studies have suggested Paneth cells acquire stem‐like features during inflammation‐related loss of stem cells 38. In an earlier study we found NGAL to be expressed by a subset of Paneth cells 4. In addition to NGAL, among the regulated genes to be verified by IHC, we chose to include the highly upregulated Paneth cell marker Lysozyme (LYZ) and both were expressed in UACL. Moreover, IHC showed the two UACL‐expressed proteins BPIFP1 and reticulocalbin 1 to be specifically expressed in Paneth cells of both healthy controls and inflamed ileal mucosa. To our knowledge these are novel observations.
Interestingly, in the present study we found the homeobox transcription factor PDX1 to be among the most‐upregulated genes in both UACL and inflamed non‐UACL epithelium compared to control epithelium. PDX1 has been shown to decrease CDX2 39. A previous study found increased expression of PDX1 and decreased expression of CDX2 in UACL 31. Simmini et al 40 showed that murine intestinal LGR5+ stem cells converted cell‐autonomously into pyloric stem cells in the absence of CDX2. If this is true also in human intestinal stem cells, it suggests that inhibition of CDX2 can be an important factor for the induction of UACL.
In conclusion, several UACL genes are implicated in migration and gland development supporting a role for UACL in wound healing. We find that NGAL is highly expressed in UACL, regenerative colonic crypts and in undifferentiated colonoids, strongly suggesting that NGAL plays a role in the regeneration process in IBD.
Author contributions statement
ST, AvBG, IB, JKD, AEØ, TB, and AKS contributed to the conception and design of different parts of the study. ST, AvBG, TDS, IB, and TB performed the experiments. ST, AvBG, IB, ESR, THF, JKD, AEØ, TB, and AKS contributed to the assembly, analysis and interpretation of data. ST, AvBG, and AKS wrote the manuscript. All authors were involved in final revision and approval.
SUPPLEMENTARY MATERIALS ONLINE.
Supplementary materials and methods
Supplementary figure legends
Figure S1. An example of the LCM of UACL with dehumidified, AB‐PAS stained sections, before (left) and after (right) LCM
Table S1. Primary antibodies used
Table S2. Characteristics of patients in the RNA‐sequencing of microdissected UACL
Table S3. Area and DV200 values in sample groups
Table S4. Protein‐coding genes upregulated in both UACL (p < 0.1) and inflamed non‐UACL epithelium (p < 0.2) versus control epithelium and excluded from the enrichment analysis of the UACL gene signature
Table S5. Genes involved in the six top significant GO processes
Movie S1. A video showing multiple UACL‐crypts in a 3D format
Supporting information
Supplementary materials and methods
Supplementary figure legends
Figure S1. An example of the LCM of UACL with dehumidified, AB‐PAS stained sections, before (left) and after (right) LCM
Table S1. Primary antibodies used
Table S2. Characteristics of patients in the RNA‐sequencing of microdissected UACL
Table S3. Area and DV200 values in sample groups
Table S4. Protein‐coding genes upregulated in both UACL (p < 0.1) and inflamed non‐UACL epithelium (p < 0.2) versus control epithelium and excluded from the enrichment analysis of the UACL gene signature
Table S5. Genes involved in the six top significant GO processes
Movie S1. A video showing multiple UACL‐crypts in a 3D format
Acknowledgements
We thank Bjørn Munkvold, Berit Doseth, Wahida Afroz, and Anne Kristensen for excellent technical assistance. The RNA sequencing and bioinformatics analysis were performed in close collaboration with the Genomics Core Facility (GCF), Norwegian University of Science and Technology (NTNU). GCF is funded by the Faculty of Medicine and Health Sciences at NTNU and Central Norway Regional Health Authority. The confocal imaging was performed at the Cellular & Molecular Imaging Core Facility (CMIC), NTNU.
No conflicts of interest were declared.
References
- 1. Nielsen BS, Borregaard N, Bundgaard JR, et al. Induction of NGAL synthesis in epithelial cells of human colorectal neoplasia and inflammatory bowel diseases. Gut 1996; 38: 414–420. [DOI] [PMC free article] [PubMed] [Google Scholar]
- 2. Ostvik AE, Granlund AV, Torp SH, et al. Expression of Toll‐like receptor‐3 is enhanced in active inflammatory bowel disease and mediates the excessive release of lipocalin 2. Clin Exp Immunol 2013; 173: 502–511. [DOI] [PMC free article] [PubMed] [Google Scholar]
- 3. Thorsvik S, Damas JK, Granlund AV, et al. Fecal neutrophil gelatinase‐associated lipocalin as a biomarker for inflammatory bowel disease. J Gastroenterol Hepatol 2017; 32: 128–135. [DOI] [PubMed] [Google Scholar]
- 4. Thorsvik S, Bakke I, van Beelen GA, et al. Expression of neutrophil gelatinase‐associated lipocalin (NGAL) in the gut in Crohn's disease. Cell Tissue Res 2018; 374: 339–348. [DOI] [PMC free article] [PubMed] [Google Scholar]
- 5. Wright NA, Pike C, Elia G. Induction of a novel epidermal growth factor‐secreting cell lineage by mucosal ulceration in human gastrointestinal stem cells. Nature 1990; 343: 82–85. [DOI] [PubMed] [Google Scholar]
- 6. Buisine M, Desreumaux P, Leteurtre E, et al. Mucin gene expression in intestinal epithelial cells in Crohn's disease. Gut 2001; 49: 544–551. [DOI] [PMC free article] [PubMed] [Google Scholar]
- 7. Goldenring JR. Pyloric metaplasia, pseudopyloric metaplasia, ulcer‐associated cell lineage and spasmolytic polypeptide‐expressing metaplasia: reparative lineages in the gastrointestinal mucosa. J Pathol 2018; 245: 132–137. [DOI] [PMC free article] [PubMed] [Google Scholar]
- 8. Wright NA, Poulsom R, Stamp G, et al. Trefoil peptide gene expression in gastrointestinal epithelial cells in inflammatory bowel disease. Gastroenterology 1993; 104: 12–20. [DOI] [PubMed] [Google Scholar]
- 9. Hanby AM, Wright NA. The ulcer‐associated cell lineage: the gastrointestinal repair kit? J Pathol 1993; 171: 3–4. [DOI] [PubMed] [Google Scholar]
- 10. Koukoulis GK, Ke Y, Henley JD, et al. Detection of pyloric metaplasia may improve the biopsy diagnosis of Crohn's ileitis. J Clin Gastroenterol 2002; 34: 141–143. [DOI] [PubMed] [Google Scholar]
- 11. Yokoyama I, Kozuka S, Ito K, et al. Gastric gland metaplasia in the small and large intestine. Gut 1977; 18: 214–218. [DOI] [PMC free article] [PubMed] [Google Scholar]
- 12. Ishii K, Hosaka N, Toki T, et al. A new view of the so‐called adenoma malignum of the uterine cervix. Virchows Archiv 1998; 432: 315–322. [DOI] [PubMed] [Google Scholar]
- 13. Wright NA. Epithelial stem cell repertoire in the gut: clues to the origin of cell lineages, proliferative units and cancer. Int J Exp Pathol 2000; 81: 117–143. [DOI] [PMC free article] [PubMed] [Google Scholar]
- 14. Bojesen RD, Riis LB, Hogdall E, et al. Inflammatory bowel disease and small bowel cancer risk, clinical characteristics, and histopathology: a population‐based study. Clin Gastroenterol Hepatol 2017; 15: 1900–1907.e1902. [DOI] [PubMed] [Google Scholar]
- 15. Jess T, Loftus EV Jr, Velayos FS, et al. Risk of intestinal cancer in inflammatory bowel disease: a population‐based study from Olmsted County, Minnesota. Gastroenterology 2006; 130: 1039–1046. [DOI] [PubMed] [Google Scholar]
- 16. Whitcomb E, Liu X, Xiao SY. Crohn enteritis‐associated small bowel adenocarcinomas exhibit gastric differentiation. Hum Pathol 2014; 45: 359–367. [DOI] [PubMed] [Google Scholar]
- 17. Renier N, Wu Z, Simon DJ, et al. iDISCO: a simple, rapid method to immunolabel large tissue samples for volume imaging. Cell 2014; 159: 896–910. [DOI] [PubMed] [Google Scholar]
- 18. Liao Y, Smyth GK, Shi W. featureCounts: an efficient general purpose program for assigning sequence reads to genomic features. Bioinformatics (Oxford, England) 2014; 30: 923–930. [DOI] [PubMed] [Google Scholar]
- 19. Law CW, Chen Y, Shi W, et al. voom: Precision weights unlock linear model analysis tools for RNA‐seq read counts. Genome Biol 2014; 15: R29. [DOI] [PMC free article] [PubMed] [Google Scholar]
- 20. Mahe MM, Sundaram N, Watson CL, et al. Establishment of human epithelial enteroids and colonoids from whole tissue and biopsy. J Vis Exp 2015. [DOI] [PMC free article] [PubMed] [Google Scholar]
- 21. Sato T, Stange DE, Ferrante M, et al. Long‐term expansion of epithelial organoids from human colon, adenoma, adenocarcinoma, and Barrett's epithelium. Gastroenterology 2011; 141: 1762–1772. [DOI] [PubMed] [Google Scholar]
- 22. Longman R, Douthwaite J, Sylvester P, et al. Coordinated localisation of mucins and trefoil peptides in the ulcer associated cell lineage and the gastrointestinal mucosa. Gut 2000; 47: 792–800. [DOI] [PMC free article] [PubMed] [Google Scholar]
- 23. Holmberg FE, Seidelin JB, Yin X, et al. Culturing human intestinal stem cells for regenerative applications in the treatment of inflammatory bowel disease. EMBO Mol Med 2017; 9: 558–570. [DOI] [PMC free article] [PubMed] [Google Scholar]
- 24. Playford RJ, Belo A, Poulsom R, et al. Effects of mouse and human lipocalin homologues 24p3/lcn2 and neutrophil gelatinase‐associated lipocalin on gastrointestinal mucosal integrity and repair. Gastroenterology 2006; 131: 809–817. [DOI] [PubMed] [Google Scholar]
- 25. Hu L, Hittelman W, Lu T, et al. NGAL decreases E‐cadherin‐mediated cell‐cell adhesion and increases cell motility and invasion through Rac1 in colon carcinoma cells. Lab Invest 2009; 89: 531–548. [DOI] [PMC free article] [PubMed] [Google Scholar]
- 26. Miao Q, Ku AT, Nishino Y, et al. Tcf3 promotes cell migration and wound repair through regulation of lipocalin 2. Nat Commun 2014; 5: 4088. [DOI] [PMC free article] [PubMed] [Google Scholar]
- 27. Gwira JA, Wei F, Ishibe S, et al. Expression of neutrophil gelatinase‐associated lipocalin regulates epithelial morphogenesis in vitro. J Biol Chem 2005; 280: 7875–7882. [DOI] [PubMed] [Google Scholar]
- 28. Flo TH, Smith KD, Sato S, et al. Lipocalin 2 mediates an innate immune response to bacterial infection by sequestrating iron. Nature 2004; 432: 917–921. [DOI] [PubMed] [Google Scholar]
- 29. Goetz DH, Holmes MA, Borregaard N, et al. The neutrophil lipocalin NGAL is a bacteriostatic agent that interferes with siderophore‐mediated iron acquisition. Mol Cell 2002; 10: 1033–1043. [DOI] [PubMed] [Google Scholar]
- 30. Hanby AM, Chinery R, Poulsom R, et al. Downregulation of E‐cadherin in the reparative epithelium of the human gastrointestinal tract. Am J Pathol 1996; 148: 723–729. [PMC free article] [PubMed] [Google Scholar]
- 31. Kaneko Y, Nakamura T, Hayama M, et al. Altered expression of CDX‐2, PDX‐1 and mucin core proteins in “ulcer‐associated cell lineage (UACL)” in Crohn's disease. J Mol Histol 2008; 39: 161–168. [DOI] [PubMed] [Google Scholar]
- 32. Riccio O, van Gijn ME, Bezdek AC, et al. Loss of intestinal crypt progenitor cells owing to inactivation of both Notch1 and Notch2 is accompanied by derepression of CDK inhibitors p27Kip1 and p57Kip2. EMBO Rep 2008; 9: 377–383. [DOI] [PMC free article] [PubMed] [Google Scholar]
- 33. Carulli AJ, Keeley TM, Demitrack ES, et al. Notch receptor regulation of intestinal stem cell homeostasis and crypt regeneration. Dev Biol 2015; 402: 98–108. [DOI] [PMC free article] [PubMed] [Google Scholar]
- 34. Danahay H, Pessotti AD, Coote J, et al. Notch2 is required for inflammatory cytokine‐driven goblet cell metaplasia in the lung. Cell Rep 2015; 10: 239–252. [DOI] [PubMed] [Google Scholar]
- 35. Pisconti A, Cornelison DD, Olguin HC, et al. Syndecan‐3 and Notch cooperate in regulating adult myogenesis. J Cell Biol 2010; 190: 427–441. [DOI] [PMC free article] [PubMed] [Google Scholar]
- 36. Sakthianandeswaren A, Christie M, D'Andreti C, et al. PHLDA1 expression marks the putative epithelial stem cells and contributes to intestinal tumorigenesis. Cancer Res 2011; 71: 3709–3719. [DOI] [PubMed] [Google Scholar]
- 37. Sato T, van Es JH, Snippert HJ, et al. Paneth cells constitute the niche for Lgr5 stem cells in intestinal crypts. Nature 2011; 469: 415–418. [DOI] [PMC free article] [PubMed] [Google Scholar]
- 38. Schmitt M, Schewe M, Sacchetti A, et al. Paneth cells respond to inflammation and contribute to tissue regeneration by acquiring stem‐like features through SCF/c‐Kit signaling. Cell Rep 2018; 24: 2312–2328. e2317. [DOI] [PubMed] [Google Scholar]
- 39. Heller RS, Stoffers DA, Hussain MA, et al. Misexpression of the pancreatic homeodomain protein IDX‐1 by the Hoxa‐4 promoter associated with agenesis of the cecum. Gastroenterology 1998; 115: 381–387. [DOI] [PubMed] [Google Scholar]
- 40. Simmini S, Bialecka M, Huch M, et al. Transformation of intestinal stem cells into gastric stem cells on loss of transcription factor Cdx2. Nat Commun 2014; 5: 5728. [DOI] [PMC free article] [PubMed] [Google Scholar]
Associated Data
This section collects any data citations, data availability statements, or supplementary materials included in this article.
Supplementary Materials
Supplementary materials and methods
Supplementary figure legends
Figure S1. An example of the LCM of UACL with dehumidified, AB‐PAS stained sections, before (left) and after (right) LCM
Table S1. Primary antibodies used
Table S2. Characteristics of patients in the RNA‐sequencing of microdissected UACL
Table S3. Area and DV200 values in sample groups
Table S4. Protein‐coding genes upregulated in both UACL (p < 0.1) and inflamed non‐UACL epithelium (p < 0.2) versus control epithelium and excluded from the enrichment analysis of the UACL gene signature
Table S5. Genes involved in the six top significant GO processes
Movie S1. A video showing multiple UACL‐crypts in a 3D format