Abstract
Purpose
Breast density is important in the evaluation of breast cancer risk. At present, breast density is evaluated using two‐dimensional projections from mammography with or without tomosynthesis using either (a) subjective assessment or (b) a computer‐aided approach. The purpose of this work is twofold: (a) to establish an algorithm for quantitative assessment of breast density using quantitative three‐dimensional transmission ultrasound imaging; and (b) to determine how these quantitative assessments compare with both subjective and objective mammographic assessments of breast density.
Methods
We described and verified a threshold‐based segmentation algorithm to give a quantitative breast density (QBD) on ultrasound tomography images of phantoms of known geometric forms. We also used the algorithm and transmission ultrasound tomography to quantitatively determine breast density by separating fibroglandular tissue from fat and skin, based on imaged, quantitative tissue characteristics, and compared the quantitative tomography segmentation results with subjective and objective mammographic assessments.
Results
Quantitative breast density (QBD) measured in phantoms demonstrates high quantitative accuracy with respect to geometric volumes with average difference of less than 0.1% of the total phantom volumes. There is a strong correlation between QBD and both subjective mammographic assessments of Breast Imaging ‐ Reporting and Data System (BI‐RADS) breast composition categories and Volpara density scores — the Spearman correlation coefficients for the two comparisons were calculated to be 0.90 (95% CI: 0.71–0.96) and 0.96 (95% CI: 0.92–0.98), respectively.
Conclusions
The calculation of breast density using ultrasound tomography and the described segmentation algorithm is quantitatively accurate in phantoms and highly correlated with both subjective and Food and Drug Administration (FDA)‐cleared objective assessments of breast density.
Keywords: breast density, image segmentation, medical imaging, transmission ultrasound, ultrasound tomography
1. Introduction
Dense breast tissue is an independent predictor of increased breast cancer risk.1, 2, 3 Women demonstrate a natural continuum of breast density, and the presence of dense fibroglandular breast tissue is estimated to increase the risk of breast cancer by four‐ to sixfold.4, 5 The only factors associated with greater increases in breast cancer risk are age and certain genetic mutations, such as those in the BRCA genes.6, 7, 8, 9 In this era of precision medicine, risk models for screening based on breast density have increasingly been proposed as an alternative to risk models based on age.10, 11, 12 For risk‐based screening using breast density to be effective, the methods to assess breast density must be reliable, robust, accessible, and consistent.
Breast density refers to the percentage of breast tissue that is relatively opaque to mammography.13 The fourth edition of the Breast Imaging‐Reporting and Data System (BI‐RADS) developed by the American College of Radiology and published in 2003 incorporated a quantitative component of density percentages to the four quartile breast density categories. More recently, the fifth edition of BI‐RADS published in 2013 removed the quantitative component and instead pushed forth ordinal categories (A, B, C, and D) with more emphasis placed on the masking effects of the dense tissues. The overall result has been a shift toward higher density assessments for all women.14 Following publication of the fifth edition of BIRADS, it has also been demonstrated in the literature that the use of categorical mammographic density scales rather than continuous percent mammographic density measures results in a significant loss of information. For example, the use of a categorical scale can force very different clinical decisions based on an arbitrary category cut‐off that may not be clinically relevant or meaningful. The more precise continuous density measures have been shown to better capture the density–risk relationship, resulting in more personalized and accurate risk assessments.15
There is currently no gold standard method to accurately estimate breast density. Currently utilized methods range from (a) qualitative to quantitative and from (b) visual to fully automated. The vast majority of subjective and automated assessments of breast density rely on two‐dimensional (2D) images. These 2D images are derived from either 2D mammographic images or synthesized from three‐dimensional (3D) digital breast tomosynthesis (DBT). The challenge with using 2D mammographic images or 2D synthesized mammographic images as a means to assess breast density is that the 3D heterogeneity of fibroglandular breast tissue is not captured. Additionally, challenges exist with the subjective assessment of breast density, as multiple studies have demonstrated significant inter‐ and intra‐reader variability.16, 17
Transmission ultrasound imaging is an emerging technology that has a long history18, 19, 20, 21, 22, 23, 24, 25, 26, 27, 28, 29 that provides a 3D representation of tissue characteristics. The purpose of the work described in this paper was twofold: (a) to establish an algorithm for quantitative assessment of breast density using full‐wave 3D transmission ultrasound imaging28 and (b) to determine how these quantitative assessments relate to both subjective mammographic assessments of BI‐RADS breast composition categories and objective measures provided by FDA‐cleared VolparaDensity software. We believe that the high resolution and quantitative accuracy of full‐wave 3D inverse scattering ultrasound tomography28 should improve the accuracy of estimates of breast density.
2. Materials and methods
2.A. Transmission ultrasound scanning of the breast
All scans were performed on a multimodality transmission and reflection ultrasound imaging system (QT Ultrasound, LLC, Novato, CA; Fig. 1). The scanner consists of a water bath in which the breast (or phantom) is immersed, a transmitter and receiver array set for transmission imaging, and three reflection arrays for reflection imaging. This is an investigational use of this device. The scanner and the imaging algorithms have been fully described in previous literature.29, 30, 31
Figure 1.
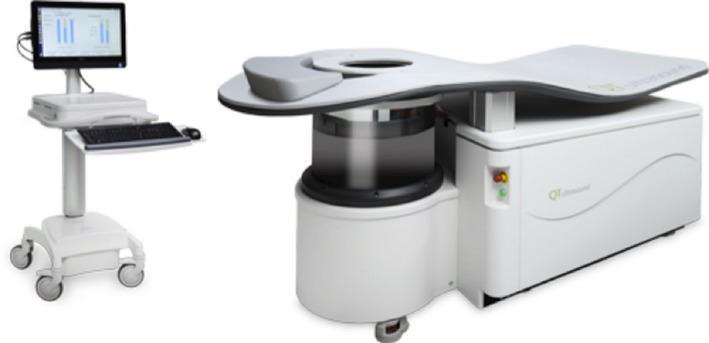
Photograph of the multimodality transmission and reflection ultrasound imaging system. [Color figure can be viewed at wileyonlinelibrary.com]
2.B. Segmentation algorithm
In contrast to other manual segmentation techniques, we segment using a fully automated approach. The algorithm for automatic quantitative breast density (QBD) measurement performs the following steps in sequence:
Segmentation of the whole breast from surrounding water.
Segmentation of the relatively high‐speed breast tissue from the total breast tissue volume.
Segmentation and removal of the skin from the high‐speed breast tissue.
Calculation of the breast density as a ratio of high‐speed breast tissue volume to the total breast tissue volume. The final output is expressed as a percentage (QBD value).
The details of segmentation of high‐speed breast tissue from skin and fat are as follows:
-
1
The attenuation image information is used to determine the breast volume. For each 1 mm vertical level (moving from the nipple to the chest wall):
-
a
From the border of the image space, the algorithm moves inward horizontally until pixels with nonzero attenuation are encountered. It is assumed that the breast has nonzero attenuation whereas the attenuation of the water bath can be considered zero.
-
b
From the surface of the breast (i.e., the point at which the attenuation changes from zero to nonzero) to the midpoint of the image space, the pixels are labeled “breast tissue.” It is assumed that everything from the surface of the breast to the center of the breast is breast tissue.
-
c
To account for the vertical convexity of the breast, the algorithm moves upward until pixels with nonzero attenuation are encountered. From these pixels onward, the pixels are labeled “breast tissue.”
-
d
Pixels labeled “breast tissue” that are close to the border between the breast tissue and the water bath are labeled “border pixels.”
-
a
-
2
The speed of sound image is then segmented on the basis of speed and the pixel information from the attenuation segmentation carried out above. This is valid since the speed of sound image is coregistered with the attenuation image. This yields the separation of fibroglandular tissue and skin from fat. Fibroglandular tissue and skin are segmented together from the total breast tissue volume since they both have higher speed of sound (>1510 m/s) than that of fat (<1480 m/s).
-
3
In the last step, the skin is segmented and removed by exclusion of the border pixels as defined in step 1(d).
In the above algorithm, attenuation is used initially because attenuation in water is almost zero, whereas it is approximately two to three orders of magnitude larger in breast tissue. The speed of sound (SOS) and reflection images were also used to constrain the total breast volume based on a priori known SOS of skin and lack of reflecting objects in water. The reflection image gives an accurate delineation of the skin. Note, however, that the segmentation of the SOS is critical for distinguishing fibroglandular tissue. This requires high‐resolution speed images that are obtained by modeling refraction and diffraction effects in 3D, which are required to avoid artifacts and volume averaging effects.28 Presently, we used a SOS of 1489 m/s as a threshold to distinguish fibroglandular from fat tissue. This was a universal value used for all image sets in this study, since the quantitative values for the SOS at each voxel should be independent of the breast type, and only dependent on the tissue type at that voxel.32 This multistep automatic method utilizes the information from both the attenuation and the speed of sound images in an intelligent manner specifically adapted to the breast and yields segmented speed of sound and attenuation images. The algorithm is summarized in Fig. 2.
Figure 2.
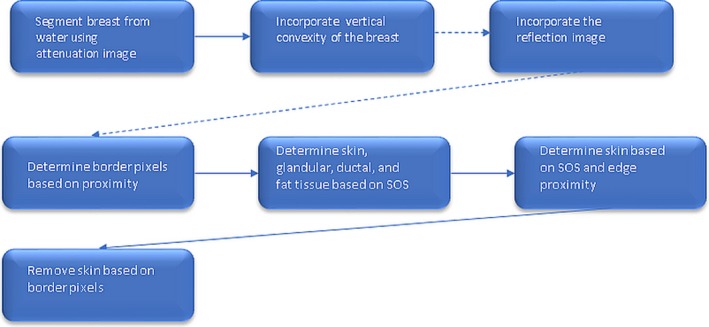
Summary of segmentation algorithm. [Color figure can be viewed at wileyonlinelibrary.com]
2.C. Phantom studies
The algorithm was tested on multiple phantoms, the first and simplest of which was a cylindrical polyurethane phantom with cylindrical inclusions (Metropolis Design and Prototyping, North Salt Lake, UT). It consisted of an outer cylinder of polyurethane 40.5 mm wide with two cylindrical holes, each 9.25 mm in diameter, and a third cylindrical hole, 7.2 mm in diameter (Fig. 3). The outer cylinder background SOS is 1440 m/s, with attenuation 0.9 dB/cm. One of the cylindrical holes was filled with a high speed plug (1540 m/s, attenuation 1.6 dB/cm), the second larger hole and the smaller hole were filled with background material, so that only one cylindrical hole was segmented out as in Fig. 6.
Figure 3.
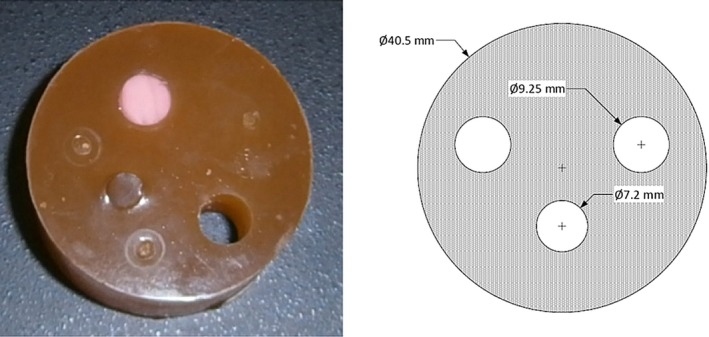
Photograph (left) and schematic (right) of the cylindrical phantom with cylindrical inclusions. On the schematic, the label Ø symbol indicates diameter (not radius) of the associated holes. All measurements are in millimeters. [Color figure can be viewed at wileyonlinelibrary.com]
Figure 6.
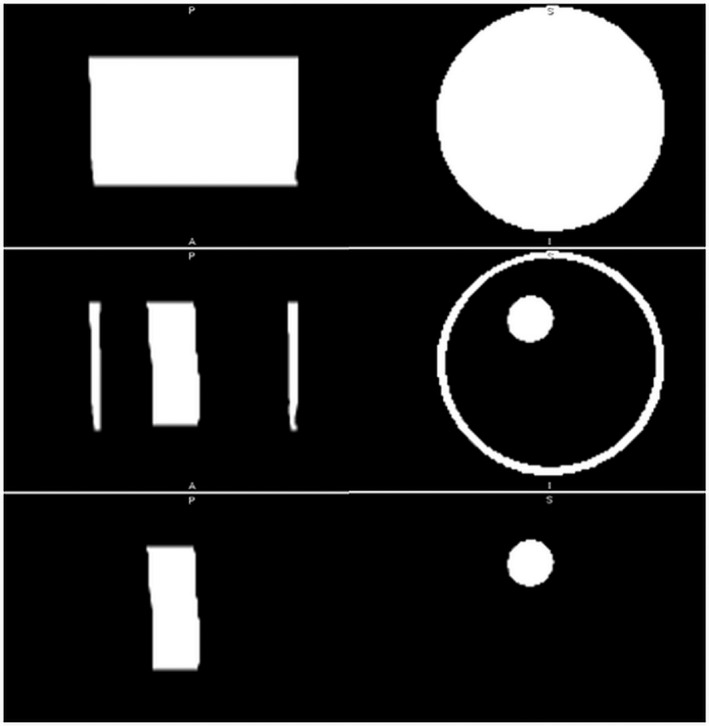
Segmented transmission ultrasound images (coronal and axial views) of the cylindrical phantom with cylindrical inclusions for geometric comparison. Top row: segmented total volume, middle row shows segmented peripheral capsule and internal cylinder. Bottom row: segmented internal cylinder without the peripheral capsule (representing skin). Quantitative breast density score is volume in bottom row divided by volume in top row.
The algorithm was also tested on a cylindrical polyurethane phantom, three inches tall and three inches in diameter, with spherical inclusions (Fig. 4). The spherical inclusions had a SOS of 1560 m/s and attenuation 1.6 dB/cm. The background cylinder had a SOS of 1470 m/s, and attenuation 0.9 dB/cm. The spherical inclusions were constructed to be 1 cm in diameter, and the dimensions were verified with a caliper. The volume of these spheres was measured (a) by direct calculation using the formula for the volume of a sphere and (b) by volume displacement in a graduated cylinder filled with water. The graduated cylinder was filled to 4 cc. Addition of six spheres to the water raised the volume to 7.20 cc; thus, the estimated volume of each sphere was 3.20 cc/6 = 0.53 cc. This agrees well with the volume calculated using the formula , which gave V = 0.52 cc, for a sphere of radius 0.50 cm.
Figure 4.
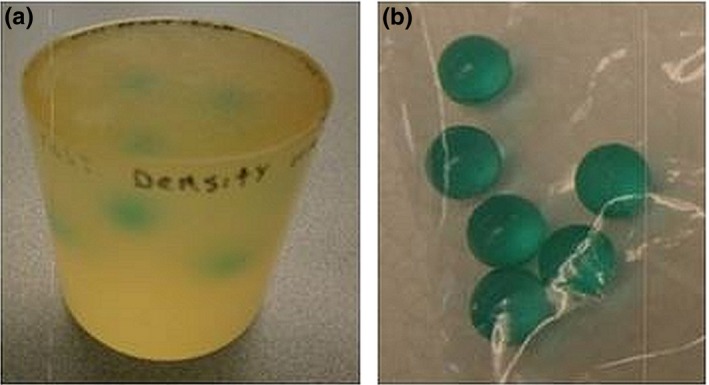
Photographs of (a) polyurethane phantom with spherical inclusions (left) and (b) isolated spherical inclusions (right). [Color figure can be viewed at wileyonlinelibrary.com]
The algorithm was also tested on a calibration phantom consisting of a polyurethane cylinder 60 mm tall and 80 mm in diameter containing four 8‐mm‐diameter water‐filled holes, four 15‐mm‐diameter spheres, two 1‐mm‐diameter rods, and two 5‐mm‐diameter rods (Fig. 5) Half of the spheres and half of the rods were made of high‐speed material: 1540 m/s speed of sound and 1.7 dB/cm attenuation at 1.3 MHz. The remaining inclusions had a SOS of 1440 m/s and 0.9 dB/cm attenuation. The background material had a SOS of 1480 m/s and attenuation of 0.9 dB/cm. A calculation based on the geometry of the phantom and standard formulas for the volumes of spheres and cylinders indicates that high speed material corresponding to fibroglandular tissue accounts for 18.70% of the breast volume.
Figure 5.
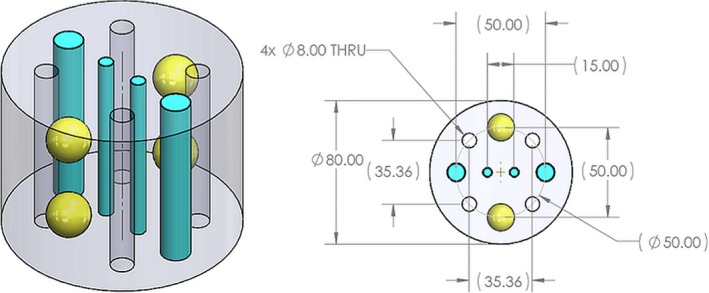
Isometric (left) and planar (right) views of the calibration phantom. On the planar view, the label Ø indicates diameter and THRU indicates through holes. There are four (4 × ) through holes in the phantom which are filled with water upon placement of the phantom in water. All dimensions are in millimeters.
2.D. Correlation of QBD with BIRADS and Volpara density scores
The clinical feasibility of the algorithm was first tested by applying the algorithm to transmission ultrasound images from 17 volunteers. QBD values calculated by the algorithm were compared to BI‐RADS33 breast composition categories assigned by four board‐certified breast radiologists following review of the corresponding two‐view mammograms. The radiologists were blinded to the QBD scores.
To compare the QBD values with the BI‐RADS breast composition categories,34 it was necessary to convert the BI‐RADS mammographic composition categories to breast density (BD) scores. We therefore used the values in Table 1. These values are subjective17 estimates, but are used consistently, to quantify the BIRADS score. We also compared and correlated the QBD values with quantitative density scores provided by VolparaDensity35 software, for a cohort of 25 volunteers. We opted to assess the correlation with the Spearman ρ, since we do not know a priori, that the relationship between QBD and Volpara is linear.
Table 1.
Conversion of BI‐RADS breast density categories to quantitative scores
| BI‐RADS category | BD score |
|---|---|
| a | 6.0 |
| b | 14.8 |
| c | 51.2 |
| d | 78.4 |
3. Results
3.A. Verification with phantoms
The results of segmentation for the cylindrical phantom with cylindrical inclusions are shown in Fig. 6. The density value based on geometry was 3.96%, whereas the QBD value was 4.09%. The results are summarized in Table 2.
Table 2.
High speed material as a proportion of phantom volume: QBD value vs geometry‐based value
| Phantom | QBD value, % | Geometry‐based value, % |
|---|---|---|
| Cylindrical phantom with cylindrical inclusions | 4.09 | 3.96 |
| Cylindrical phantom with spherical inclusions | 1.00 | 0.92 |
| Calibration phantom (with rods and spheres) | 18.66 | 18.70 |
The results of segmentation for the cylindrical phantom with spherical inclusions are shown in Fig. 7. The density value based on geometry was 0.92%, whereas the QBD value was 1.00% (Table 2).
Figure 7.
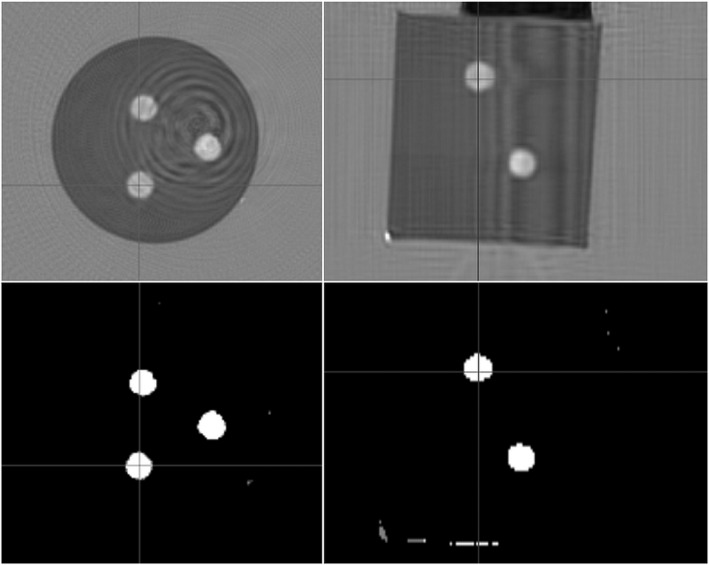
Top row, speed of sound images of the cylindrical phantom with spherical inclusions; Bottom row, high speed spheres segmented out.
The total volume of the phantom was calculated as 347.50 cubic centimeters (cc). The spheres had a total volume of 6 × 0.53 cc. The ratio (6 × 0.53)/347.50 gives 0.92%.
For the calibration phantom (Fig. 5), the density value based on geometry was 18.70% in comparison to the QBD value which was 18.66%. The corresponding image set is shown in Fig. 8 (along with a supplementary media file showing 3D segmentation of the relatively high‐speed regions within the phantom).
Figure 8.
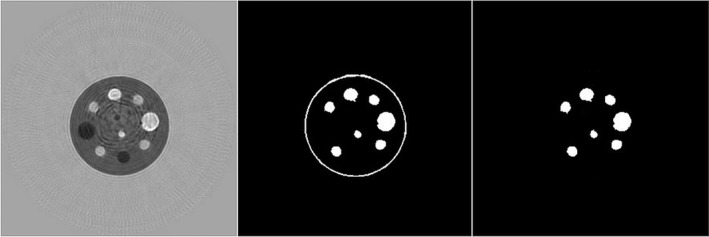
Quantitative breast density segmentation algorithm applied to calibration phantom; (left) speed of sound image, (middle) segmented peripheral capsule and high‐speed spheres and rods. The segmentation is based on speed of sound > 1489 m/s.
See also Video, Supplemental Digital Content 1, which shows a rotating segmentation of the calibration phantom showing the high‐speed rods and spheres segmented out from the entire phantom. This shows the high resolution of our method and avoidance of 2D artifacts. There has been a great deal of research toward ultrasound tomography.21, 22, 36, 37, 38, 39 However, these methods generally rely on 2D (not 3D) full‐wave methods or ray‐based forward models40 in the inversions. Thus, they may have 2D artifacts or lower resolution, which may affect the segmentation process adversely.
3.B. Verification on volunteers
A typical automatically generated result from a clinical volunteer subject is shown in Fig. 9. First, a comparison of the speed of sound image (top row) with the segmented image (middle row) shows a clear correlation. Second, the bottom row shows that the “skin removing” part of the algorithm effectively removes the tissue corresponding to skin.
Figure 9.
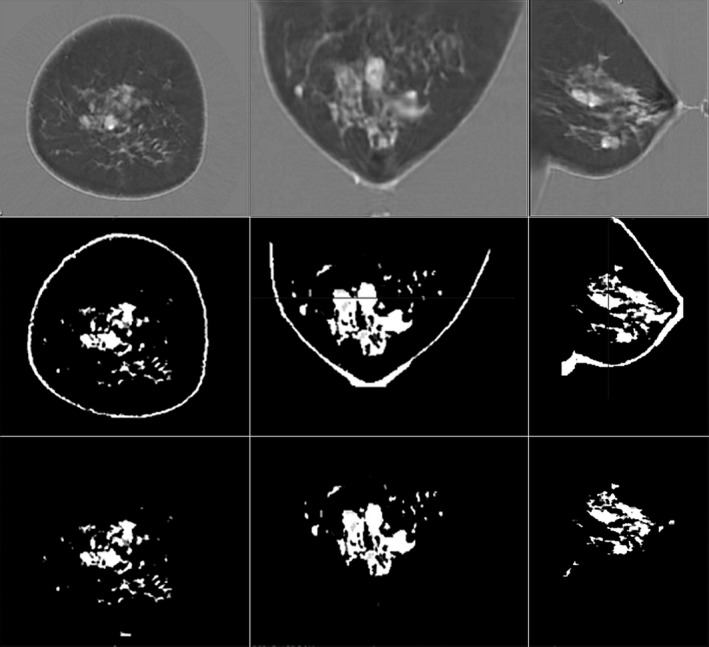
Steps in the quantitative breast density algorithm: Top row, speed of sound images. Middle row, breast separated from the water bath with skin and fibroglandular tissue segmented from the total breast tissue volume. Bottom row, remaining fibroglandular tissue following the segmentation and removal of skin. The segmentation is based on speed of sound > 1489 m/s.
There was high correlation between the QBD values and the categorical BIRADS breast density scores (Fig. 10). There was also high correlation between QBD and scores determined by Volpara, as shown in Fig. 11 which shows the scatter plot of QBD values against Volpara density scores for a sample size of 25. The nonparametric Spearman coefficient for this correlation was r = 0.96 (95% CI: 0.92–0.98, P < 0.0001). The correlation equation is y = 0.52x–0.023.
Figure 10.
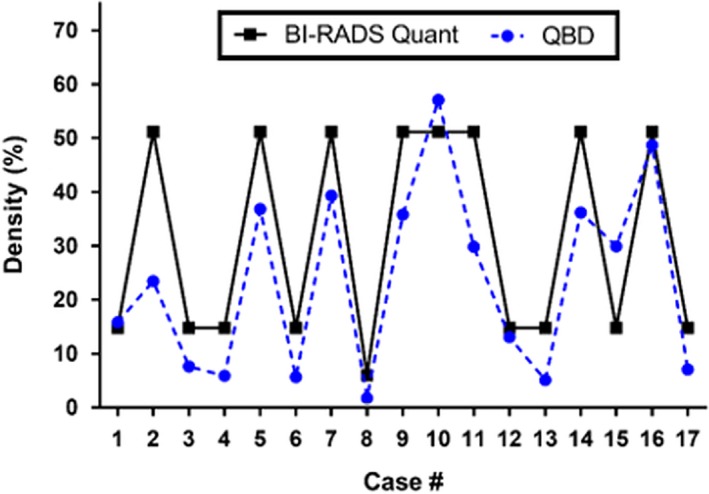
Comparison of quantitative breast density (QBD) values and BI‐RADS‐based subjective breast density scores.17 The vertical axis is the percentage of total breast volume that is fibroglandular tissue — either the QBD value or the subjective value assigned to BiRADS composition categories. [Color figure can be viewed at wileyonlinelibrary.com]
Figure 11.
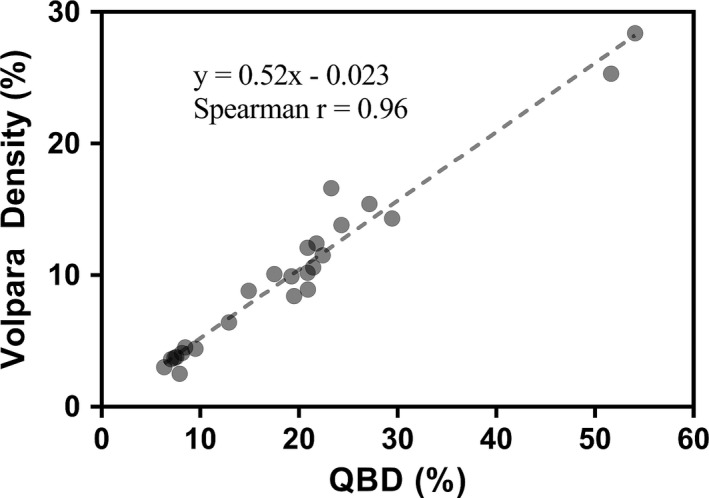
Comparison of quantitative breast density and Volpara density scores. The Spearman rank correlation r is 0.96
Figures 12, 13, 14 show application of the QBD algorithm to three different classes of breast densities: a fatty breast with QBD of 10.9%, a heterogeneously dense breast with QBD of 29.5%, and a very dense breast with QBD of 62.5%. Taken together, these figures show the effectiveness of the QBD algorithm on a variety of breast densities. We emphasize that these SOS images are the standard images that come from the scanner. The attenuation and reflection images are not shown since they are used only to accurately determine the breast volume, which is clearly seen in the images. We note that Case 2 in Fig. 10 is an outlier which we believe indicates the coarseness of the BIRADS composition score. Note that the SOS threshold value chosen in the segmentation is consistent for all image sets. One value is used for all breasts, since our image is a high‐resolution 3D map of intrinsic tissue characteristics, independent of the scanner. This value (1489 m/s) was determined empirically. Further studies are ongoing to optimize this threshold value.
Figure 12.
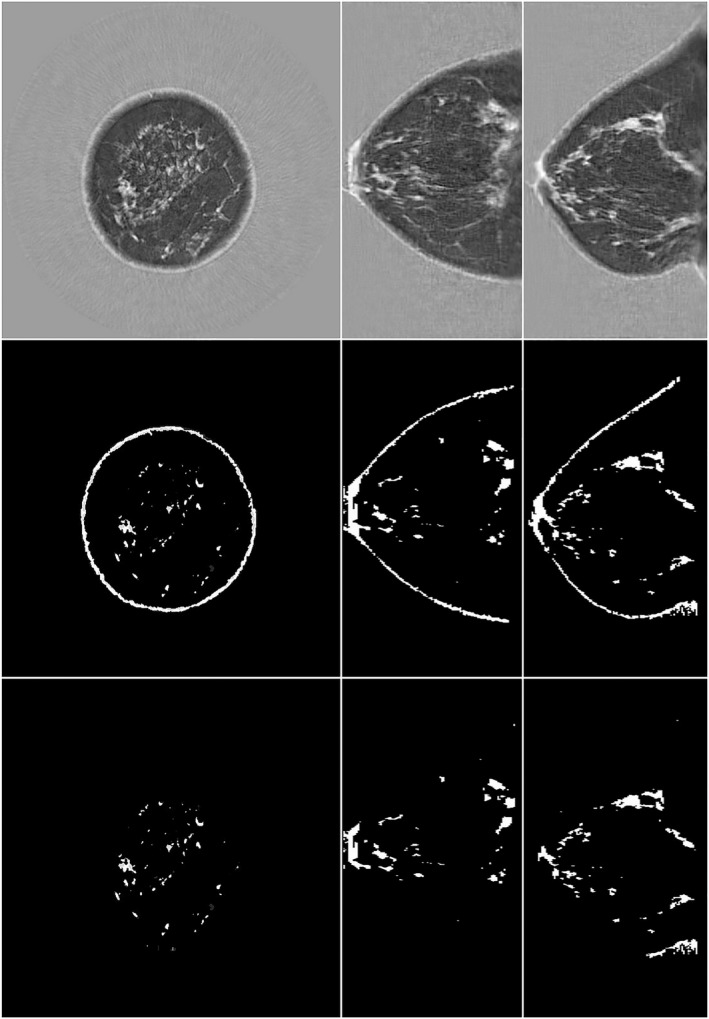
Transmission ultrasound images of a fatty breast quantitative breast density (QBD = 10.9%). Top row, speed of sound image; L to R: coronal, axial sagittal image. Middle row, fibroglandular tissue and skin segmented from the total breast tissue volume. Bottom row, remaining fibroglandular tissue following the segmentation and removal of skin. The segmentation is based on speed of sound > 1489 m/s.
Figure 13.
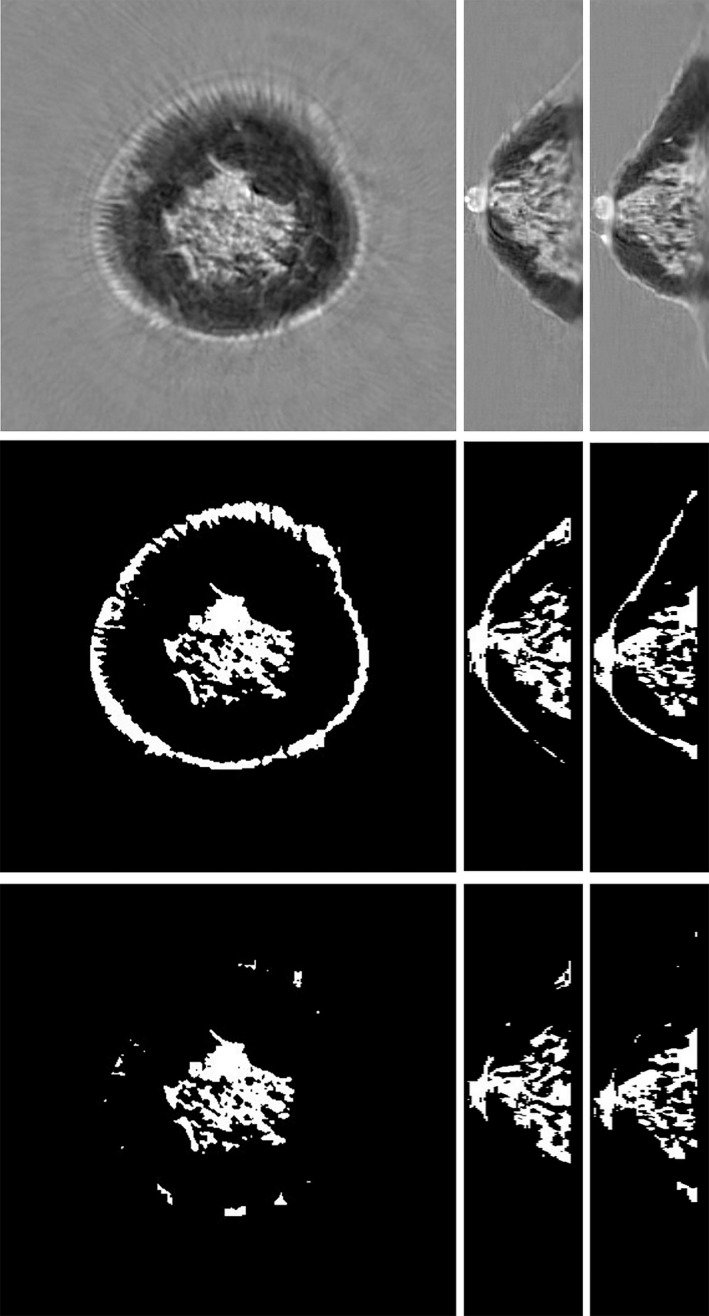
Transmission ultrasound images of a heterogeneously dense breast quantitative breast density (QBD = 29.5%). Top row, speed of sound (SOS). L to R: coronal, axial, sagittal. Middle row, segmentation with skin. Bottom row, corresponding total breast volume. There is clear correlation between the total breast volume, the segmentation, and the high‐speed tissue. The segmentation is based on SOS > 1489 m/s.
Figure 14.
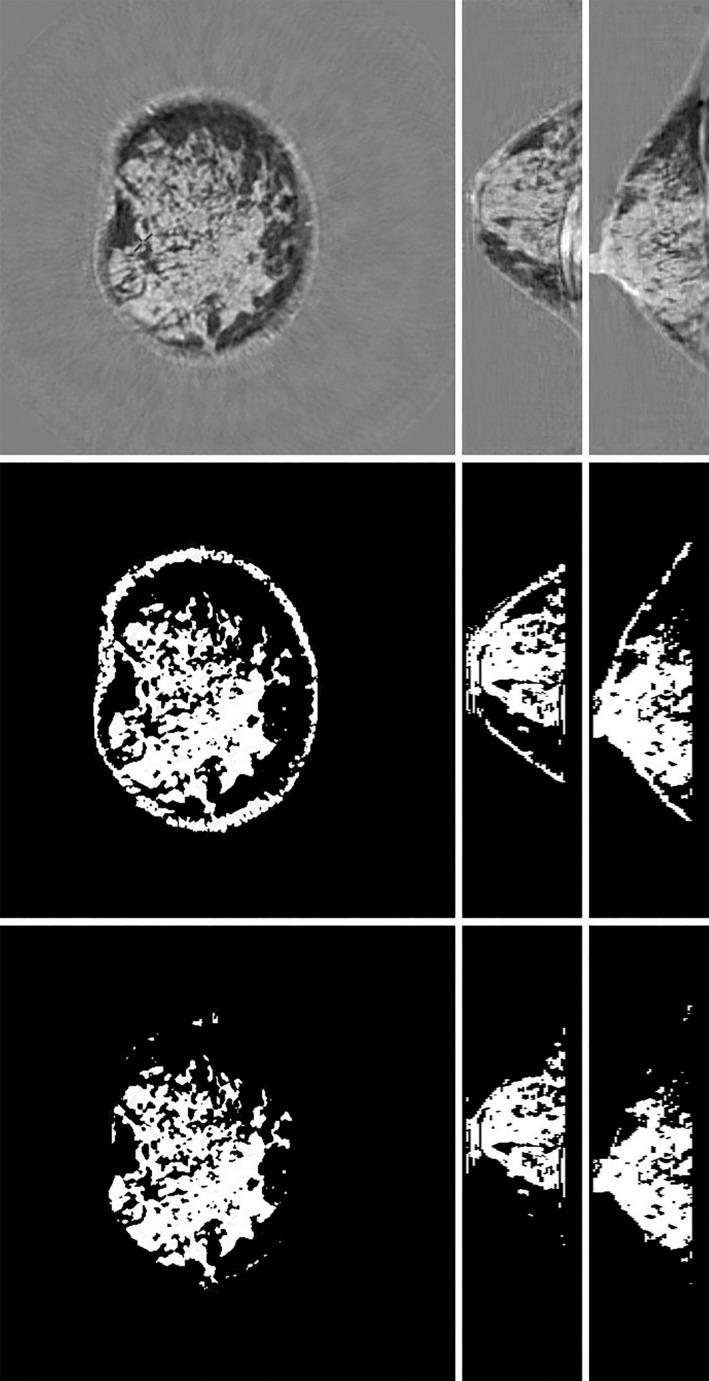
Transmission ultrasound images of a dense breast quantitative breast density (QBD = 62.4%). Top row, speed of sound (SOS). L to R: coronal, axial, sagittal. Middle row, segmentation with skin. Bottom row, corresponding total breast volume. There is clear correlation between the total breast volume, the segmentation, and the high‐speed tissue. The segmentation is based on SOS > 1489 m/s.
The algorithm uses the attenuation image as well as the speed of sound image. The attenuation and reflection images are used only to determine the whole breast volume and so are not shown. Once the breast volume is isolated, we use the quantitative estimate of the tissue SOS at each particular voxel for the critical segmentation operation to distinguish between fibroglandular and other tissue. This operation requires lack of artifacts and high resolution which requires modeling and reconstruction incorporating both refraction and diffraction effects in full 3D.28 The voxels are 0.4 mm × 0.4 mm × 1 mm in size and the image space is 531 × 531 pixels in the coronal view of the breast. The vertical extent of the image space varies with the size of the breast, with each level representing a 1‐mm‐thick slice.
See Video S2, which shows the rotating fibroglandular tissue of a human breast segmented out based on the present algorithm and SOS, attenuation, and reflection values. Part of the skin is shown for perspective, and a subcutaneous vein is visible.
Finally, we also demonstrate that there is a psychovisual tendency to overestimate 3D volumes from projections. This disparity is particularly relevant in the case of solid objects with convex or concave margins. As seen in Fig. 15, the light gray 3D object appears to cover almost 50% of the cross‐sectional area. This is approximately true independent of the azimuthal view. However, it can be shown through geometric considerations that the fraction of the volume of the cube occupied by the light gray volume is given by Eq. (1), where d/a is the ratio of the width, d, of the light gray cross to the length of the side of the cube, a, and h is the height of the light gray region above the bottom of the cube.
Figure 15.
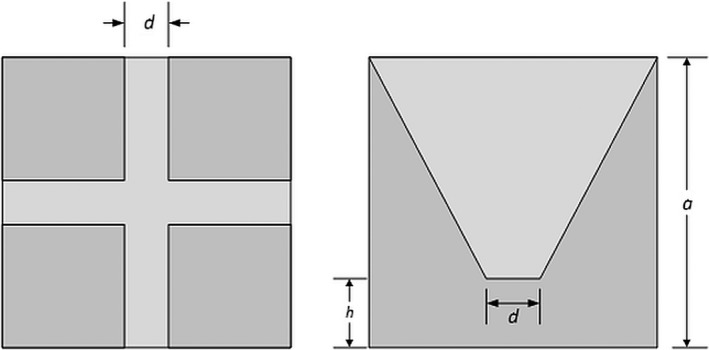
Cube containing cross‐shaped truncated cone (light gray). Left, top view. Right, side view. The volume fraction of the light gray area is only ~12%, but on the side projection (right panel), the light gray area occupies ~49% of the total square.
| (1) |
| (2) |
Hence, for the case shown in Fig. 15, (where d/a = h/a = 1/7), the volume fraction is only ~12%, whereas a projection from any side view would imply a much larger volume fraction of ~49% (ratio of the area of the light gray region to the square on the right panel of Fig. 15).
4. Discussion
We observed that the QBD algorithm was quantitatively accurate for simple phantoms with both 2D (cylindrical) and true 3D (spherical) inclusions. Specifically, we verified the quantitative accuracy of the QBD algorithm against theoretically calculated values. This establishes the importance and accuracy of the high resolution and quantitative accuracy of the segmentation. We note that some research groups have skipped this important first step — validation. In the clinical setting, upon evaluation of images from volunteer subjects, the fibroglandular tissue volume segmented by the QBD algorithm showed high visual correlation with the speed of sound image.
There is known 3D heterogeneity within fibroglandular breast tissue, which we refer to as topological diversity. The key point in this analysis is that the fibroglandular tissue is nonconvex and contains voids. Consequently, two 2D projections as in mammography can misrepresent the true 3D volume41 Our QBD algorithm, when used in conjunction with quantitative transmission ultrasound tomography, is accurate regardless of the 3D heterogeneity in the fibroglandular breast tissue.
We also note that our images are unique in their high resolution, reduction of 2D artifact, and reduction of “volume averaging” which may affect any segmentation yielding a QBD score.28, 42 Sak et al.43 obtained a Spearman correlation coefficient of 0.568 between k‐means segmented and 0.715 between threshold segmented volumes based on ultrasound tomography and mammographic breast density. Our comparison yielded a correlation of 0.96 and the value appears to remain high over larger cohorts, as future publications will establish. It may be that the value differs due to differences in the SOS images used in the segmentation. Our 3D algorithm (utilizing diffraction) appears to avoid some artifacts and volume averaging that may arise with 2D reconstruction algorithms,28 especially if the model is based on refraction only, as in the case of ray‐based inversions.7 Note that Sak et al. observed better correlation when segmentation was based on thresholding (which we use here) rather than k‐means clustering. This may be because transmission ultrasound tomography yields characteristic estimates of the tissue itself, independent of the imaging system and surrounding tissue.
In consideration of frequently used imaging modalities in breast imaging, it becomes clear that 3D techniques are advantageous over 2D methods. Kopans44 has argued with respect to breast density determination: “Future investigations need to use 3D information,” and that “Radiologists can guesstimate the percentage of breast tissue that is dense, but they are still using 2D information to assess a 3D phenomenon.” To this end, volumetric measurement of breast density from intrinsically 3D imaging modalities is considered more accurate due to their scientific validity. Recently, 3D‐segmented magnetic resonance (MR) images have been used45 to assess breast density and appear to be robust to positioning issues46 and give reproducible results.47 However, MR imaging is relatively costly and requires specialized expertise to run and operate.
More recently developed breast imaging modalities such as breast computed tomography (CT) have the advantage of being intrinsically volumetric.48 Vedantham49 has analyzed the use of dedicated breast CT to determine the mean and range of “volumetric glandular fraction” in a related context. They carried out a validation step and observed that their algorithm was accurate to within ± 1.9% in determining the volume of an irregular shaped phantom. The calculation of breast density via automated breast ultrasound (ABUS) images50 has also been correlated with MR imaging (MRI) — Chen et al.50 found a correlation (R2 = 0.825) for breast percent density (similar to our QBD), as measured with ABUS vs MRI, which are both volumetric measures.
Digital breast tomosynthesis (DBT) also provides a 3D image stack. Breast densities from DBT, MRI, and digital mammography (DM — a 2D image) were pairwise correlated in Moon et al.51 They indicated some correlation between breast volumes for all three modalities. However, the correlation between the estimate of breast density from DBT and DM (R = 0.789) was substantially higher than that between DBT and MRI (R = 0.482), which was the same as the correlation between DM and MRI (R = 0.482).
Prior to the work in this paper, ultrasound tomography had been explored as well for assessment of breast density although some of these methods provide a surrogate for QBD and not a direct percentage measure. Initial work using ultrasound tomography utilized images made from 2D‐based algorithms, wherein 2D images are concatenated together to yield 3D images.43, 52, 53 O'Flynn et al.,54 Glide,55 and Duric et al.53 calculated volume‐averaged SOS (VASS) derived from ray‐based ultrasound tomography as a means to ascertain breast density. Similarly, Sak et al.43 used median and mean values of the SOS image and correlated with mammographic breast density as determined by Cumulus software. However, their ray‐based methods account for refraction, but not diffraction wave phenomena. Consequently, their images would be potentially subject to volume averaging resulting in lower quantitative accuracy.
Glide‐Hurst et al.52 used a volumetric ultrasound percent density (UPD) as determined by segmenting high sound speed areas from each image slice using a k‐means clustering routine and integrating these results over all the slices of the breast. Hence, their comparison of the phantom was based on integrated areas, whereas ours was based on a segmented volume. They observed a moderate Spearman correlation of 0.69 between the BIRADS assessment of composition and UPD. However, their segmentation was semi‐automatic and carried out slice by slice, which is appropriate, since their ultrasound tomograms were reconstructed in the same manner. In particular, they manually determined the first and last levels, which bound the segmented slices. Similarly, the segmentation methods utilized by O'Flynn on the ultrasound tomography images were not automatic — the posterior and anterior limiting levels were chosen manually. In our algorithm, the segmentation was totally automatic to prevent bias across multiple breasts. This characteristic is important to insure lack of bias and consistency in the proposed QBD score. Also, the segmentation threshold we chose is empirical, but universal for all breasts. We can do this because our image gives the intrinsic tissue characteristics of a particular voxel. Ours is a model‐based inversion of the governing partial differential equation and thus is independent of the data collection apparatus (up to noise and numerical conditioning considerations). The VASS (SOS) images in O'Flynn show volume averaging in comparison to the images shown here. The VASS score will, in part, compensate for the volume averaging. However, the segmentation contained here geometrically isolates the fibroglandular tissue from other breast tissue, which is not only more intuitively appealing but also opens the possibility to understand more completely, why dense breasts are a cancer risk factor.
It is noted in literature56 that Volpara and Quantra tend to underestimate mammographic density. This also corroborates our findings. This can be attributed to the fact that although the Highnam equation41 and similar formulas are useful to estimate the total thickness of the fibroglandular tissue, it is an ill‐conditioned inversion problem and highly susceptible to noise. The presence of multiple voids in the fibroglandular tissue can be difficult to account for when estimating density from projection images. These limitations can affect all automated breast density methods. However, Volpara seems to provide a better correlation with visual assessment of breast density as noted by Duffy et al.57 who analyzed both Volpara and Quantra software, which helps to justify our choice of comparison in this research. Vinnicombe also prefers Volpara to Cumulus.35
Our results on volunteers demonstrate a correlation between the BI‐RADS breast composition category assigned by the board‐certified breast radiologists and the QBD value. In addition, our images indicate that the QBD value is geometrically accurate across a range of breast densities. We also demonstrated a significant correlation (Spearman r = 0.96) with Volpara density scores derived from VolparaDensity software which FDA cleared to provide both volumetric breast density measurements and a breast density category. The volume fraction of physiologically “dense” tissue is an intuitively appealing score to use. We established here the accuracy of the segmentation with known phantoms (validation) and showed statistical correlation with FDA‐approved breast density estimation methods with small cohorts. This essential first step will be followed with future research using the quantitative nature of our images to facilitate further differentiation of glandular from connective tissue, and utilization of larger cohorts and MR images to further substantiate the correlation observed here.
In conclusion, this work demonstrates that the QBD algorithm has promise as a viable method to accurately and consistently quantify breast density. Additional work is required to further define the utility of the QBD algorithm in a clinical setting.
Conflicts of interest
All authors are employees of QT Ultrasound, LLC.
Supporting information
Video S1: Video which shows a rotating segmentation of the calibration phantom showing the high‐speed rods and spheres segmented out from the entire phantom. mp4
Video S2: Video that shows a rotating segmentation of the fibroglandular tissue of a human breast. Wmv
Acknowledgments
This work was supported in part by the National Institutes of Health (R01 CA138536). JWW thank Dr. E. Iuanow, MD, for seminal discussions regarding mammographic breast density and its importance. The authors thank Nasser Pirshafiey and Robin Terry for technical discussions and design of phantoms, and Michael Racosky of Conversion Technology Inc. for construction of the calibration phantom. The authors express appreciation for the staff of Marin Breast Health Trial center (https://www.marinbreasthealth.com/) and Dr. J. Klock, for the accrual of patient data.
References
- 1. Pettersson A, Hankinson SE, Willett WC, Lagiou P, Trichopoulos D, Tamimi RM. Nondense mammographic area and risk of breast cancer. Breast Cancer Res. 2011;13:R100. [DOI] [PMC free article] [PubMed] [Google Scholar]
- 2. Martin LJ, Boyd NF. Mammographic density. Potential mechanisms of breast cancer risk associated with mammographic density: hypotheses based on epidemiological evidence. Breast Cancer Res. 2008;10:201. [DOI] [PMC free article] [PubMed] [Google Scholar]
- 3. Boyd NF, Martin LJ, Yaffe MJ, Minkin S. Mammographic density and breast cancer risk: current understanding and future prospects. Breast Cancer Res. 2011;13:223. [DOI] [PMC free article] [PubMed] [Google Scholar]
- 4. Harvey JA, Bovbjerg VE. Quantitative assessment of mammographic breast density: relationship with breast cancer risk. Radiology. 2004;230:29–41. [DOI] [PubMed] [Google Scholar]
- 5. Boyd NF, Lockwood GA, Byng JW, Tritchler DL, Yaffe MJ. Mammographic densities and breast cancer risk. Cancer Epidemiol Biomark Prev. 1998;7:1133–1144. [PubMed] [Google Scholar]
- 6. White J. Breast density and cancer risk: what is the relationship?. J Natl Cancer Inst. 2000;92:443. [DOI] [PubMed] [Google Scholar]
- 7. Khodr ZG, Sak MA, Pfeiffer RM, et al. Determinants of the reliability of ultrasound tomography sound speed estimates as a surrogate for volumetric breast density. Med Phys. 2015;42:5671. [DOI] [PMC free article] [PubMed] [Google Scholar]
- 8. McCormack VA, dos Santos Silva I. Breast density and parenchymal patterns as markers of breast cancer risk: a meta‐analysis. Cancer Epidemiol Biomark Prevent. 2006;15:1159–1169. [DOI] [PubMed] [Google Scholar]
- 9. Boyd N, Martin L, Bronskill M, Yaffe MJ, Duric N, Minkin S. Breast tissue composition and susceptibility to breast cancer. J Natl Cancer Inst. 2010;102:1224–1237. [DOI] [PMC free article] [PubMed] [Google Scholar]
- 10. Schousboe JT, Kerlikowske K, Loh A, Cummings SR. Personalizing mammography by breast density and other risk factors for breast cancer: analysis of health benefits and cost‐effectiveness. Ann Intern Med. 2011;155:10–20. [DOI] [PMC free article] [PubMed] [Google Scholar]
- 11. Shieh Y, Eklund M, Sawaya GF, Black WC, Kramer BS, Esserman LJ. Population‐based screening for cancer: hope and hype. Nat Rev Clin Oncol. 2016;13:550. [DOI] [PMC free article] [PubMed] [Google Scholar]
- 12. Warwick J, Birke H, Stone J, et al. Mammographic breast density refines Tyrer‐Cuzick estimates of breast cancer risk in high‐risk women: findings from the placebo arm of the International Breast Cancer Intervention Study I. Breast Cancer Res. 2014;16:451. [DOI] [PMC free article] [PubMed] [Google Scholar]
- 13. Mast TD. Empirical relationships between acoustic parameters in human soft tissues. J Acoust Soc Am. 2000;1:37–42. [Google Scholar]
- 14. Irshad A, Leddy R, Ackerman S, et al. Effects of changes in BI‐RADS density assessment guidelines (fourth versus fifth edition) on breast density assessment: intra‐ and interreader agreements and density distribution. Am J Roentgenol. 2016;207:1366–1371. [DOI] [PubMed] [Google Scholar]
- 15. Abdolell M, Tsuruda KM, Brown P, Caines JS, Iles SE. Breast density scales: the metric matters. Br J Radiol. 2017;90:20170307. [DOI] [PMC free article] [PubMed] [Google Scholar]
- 16. Byng JW, Yaffe MJ, Jong RA, et al. Analysis of mammographic density and breast cancer risk from digitized mammograms. Radiographics. 1998;18:1587–1598. [DOI] [PubMed] [Google Scholar]
- 17. Nicholson BT, LoRusso AP, Smolkin M, Bovbjerg VE, Petroni GR, Harvey JA. Accuracy of assigned BI‐RADS breast density category definitions. Acad Radiol. 2006;13:1143–1149. [DOI] [PubMed] [Google Scholar]
- 18. Lavarello RJ, Oelze M. Tomographic reconstruction of three dimensional volumes using the distorted born approximation. IEEE Trans Med Imaging. 2009;28:1643–1653. [DOI] [PubMed] [Google Scholar]
- 19. Lavarello R, Oelze M. A study on the reconstruction of moderate contrast targets using the distorted born iterative method. Trans Ultrason Ferroelect Freq Control. 2007;55:112–124. [DOI] [PubMed] [Google Scholar]
- 20. Ozmen‐Eryilmaz N, Dongen KV. A contrast source inversion method for breast cancer detection. J Acoust Soc Am. 2013;133:3230–3230. [Google Scholar]
- 21. Dongen KWAV, Wright WMD. A forward model and conjugate gradient inversion technique for low‐frequency ultrasonic imaging. J Acoust Soc Am. 2006;120:2086–2095. [DOI] [PubMed] [Google Scholar]
- 22. Dongen KWAV, Ozmen‐Eryilmaz N. Quantitative ultrasound tomography. J Acoust Soc Am. 2013;133:3229–3229. [Google Scholar]
- 23. Waag R, Lin F, Varslot T, Astheimer J. An eigenfunction method for reconstruction of large‐scale and high‐contrast objects. IEEE Trans Ultrason Ferroelectr Freq Control. 2007;54:1316–1332. [DOI] [PubMed] [Google Scholar]
- 24. Greenleaf JF, Johnson SA, Samayoa WF, Duck FA. Algebraic reconstruction of spatial distributions of acoustic velocities in tissue from their time‐of‐flight profiles In: Booth N, ed. Acoustical Holography: Volume 6. Boston, MA: Springer US; 1975:71–90. [Google Scholar]
- 25. Andre M, Janee H, Otto G, Martin P, Spivey B, Palmer D. High speed data acquisition in a diffraction tomography system employing large‐scale toroidal arrays. Int J Imaging Syst Technol. 1997;8:137–147. [Google Scholar]
- 26. Carson PL, Meyer C, Scherzinger A, Oughton T. Breast imaging in coronal planes with simultanious pulse echo and transmission ultrasound. Science. 1981;214:1141–1143. [DOI] [PubMed] [Google Scholar]
- 27. Carson PL, Scherzinger AL, Meyer CR, Jobe W, Samuels B, Adler DD. Lesion detectability in ultrasonic computed tomography of symptomatic breast patients. Invest Radiol. 1988;23:421–427. [DOI] [PubMed] [Google Scholar]
- 28. Wiskin JW, Borup DT, Iuanow E, Klock J, Lenox MW. 3‐D nonlinear acoustic inverse scattering: algorithm and quantitative results. IEEE Trans Ultrason Ferroelectr Freq Control. 2017;64:1161–1174. [DOI] [PMC free article] [PubMed] [Google Scholar]
- 29. Wiskin J, Borup DT, Johnson SA, Berggren M. Non‐linear inverse scattering: high resolution quantitative breast tissue tomography. J Acoust Soc Am. 2012;131:3802–3813. [DOI] [PMC free article] [PubMed] [Google Scholar]
- 30. Wiskin J, Borup D, Callahan K, et al. Inverse scattering results In: Acoustical Imaging 30. Heidelberg: Springer; 2011:61–68. [Google Scholar]
- 31. Wiskin J, Borup D, Johnson S. Inverse scattering theory In: André MP, Jones JP, Lee H, eds. Acoustical Imaging: Volume 30. Dordrecht, Netherlands: Springer; 2011:53–59. [Google Scholar]
- 32. Johnston RL, Goss SA, Maynard V, et al. Elements of Tissue Characterization: Part I, Ultrasonic Propagation Properties. Vol 11. Washington, DC: US Governmet Printing Office; 1979:19–27. [Google Scholar]
- 33. D'Orsi CJ. ACR BI‐RADS atlas: breast imaging reporting and data system. American College of Radiology; 2013.
- 34. Spak DA, Plaxco JS, Santiago L, Dryden MJ, Dogan BE. BI‐RADS® fifth edition: a summary of changes. Diagn Intervent Imaging. 2017;98:179–190. [DOI] [PubMed] [Google Scholar]
- 35. Vinnicombe SJ. Breast density: why all the fuss? Clin Radiol. 2018;73:334–357. [DOI] [PubMed] [Google Scholar]
- 36. Dongen KWAV, Demi L, Verweij MD. Numerical schemes for the iterative nonlinear contrast source method. J Acoust Soc Am. 2012;132:1918. [Google Scholar]
- 37. Sandhu GY, Li C, Roy O, Schmidt S, Duric N. Frequency domain ultrasound waveform tomography: breast imaging using a ring transducer. Phys Med Biol. 2015;60:5381–5398. [DOI] [PMC free article] [PubMed] [Google Scholar]
- 38. Wang K, Matthews T, Anis F, Li C, Duric N, Anastasio MA. Waveform inversion with source encoding for breast sound speed reconstruction in ultrasound computed tomography. IEEE Trans Ultrason Ferroelectr Freq Control. 2015;62:475–493. [DOI] [PMC free article] [PubMed] [Google Scholar]
- 39. Duric ND, Li C, Littrup P, et al. Detection and characterization of breast masses with ultrasound tomography: clinical results. Paper presented at: SPIE 72651G2009.
- 40. Chen J‐H, Gulsen G, Su M‐Y. Imaging breast density: established and emerging modalities. Translat Oncol. 2015;8:435–445. [DOI] [PMC free article] [PubMed] [Google Scholar]
- 41. Ng K‐H, Lau S. Vision 20/20: mammographic breast density and its clinical applications. Med Phys. 2015;42:7059–7077. [DOI] [PubMed] [Google Scholar]
- 42. Malik B, Terry R, Wiskin J, Lenox M. Quantitative transmission ultrasound tomography: imaging and performance characteristics. Med Phys. 2018;45:3063–3075. [DOI] [PMC free article] [PubMed] [Google Scholar]
- 43. Sak M, Duric N, Littrup P, et al. Using speed of sound imaging to characterize breast density. Ultrasound Med Biol. 2017;43:91–103. [DOI] [PMC free article] [PubMed] [Google Scholar]
- 44. Kopans DB. Basic physics and doubts about relationship between mammographically determined tissue density and breast cancer risk. Radiology. 2008;246:348–353. [DOI] [PubMed] [Google Scholar]
- 45. Li H, Weiss WA, Medved M, et al. Breast density estimation from high spectral and spatial resolution MRI. J Med Imaging. 2016;3:044507. [DOI] [PMC free article] [PubMed] [Google Scholar]
- 46. Chen J‐H, Chan S, Tang Y‐T, et al. Impact of positional difference on the measurement of breast density using MRI. Med Phys. 2015;42:2268–2275. [DOI] [PMC free article] [PubMed] [Google Scholar]
- 47. Ding J, Stopeck AT, Gao Y, et al. Reproducible automated breast density measure with no ionizing radiation using fat‐water decomposition MRI. J Magn Reson Imaging. 2018;48:971–981. [DOI] [PMC free article] [PubMed] [Google Scholar]
- 48. O'Connell AM, Karellas A, Vedantham S. The potential role of dedicated 3D breast CT as a diagnostic tool: review and early clinical examples. Breast J. 2014;20:592–605. [DOI] [PMC free article] [PubMed] [Google Scholar]
- 49. Vedantham S, Shi L, Karellas A, O'Connell AM. Dedicated breast CT: fibroglandular volume measurements in a diagnostic population. Med Phys. 2012;39:7317–7328. [DOI] [PMC free article] [PubMed] [Google Scholar]
- 50. Chen J‐H, Lee Y‐W, Chan S‐W, Yeh D‐C, Chang R‐F. Breast density analysis with automated whole‐breast ultrasound: comparison with 3‐D magnetic resonance imaging. Ultrasound Med Biol. 2016;42:1211–1220. [DOI] [PubMed] [Google Scholar]
- 51. Moon WK, Chang J‐F, Lo C‐M, et al. Quantitative breast density analysis using tomosynthesis and comparison with MRI and digital mammography. Comput Methods Programs Biomed. 2018;154:99–107. [DOI] [PubMed] [Google Scholar]
- 52. Glide‐Hurst CK, Duric N, Littrup P. Volumetric breast density evaluation from ultrasound tomography images. Med Phys. 2008;35:3988–3997. [DOI] [PubMed] [Google Scholar]
- 53. Duric N, Boyd N, Littrup P, et al. Breast density measurements with ultrasound tomography: a comparison with film and digital mammography. Med Phys. 2013;40:013501. [DOI] [PMC free article] [PubMed] [Google Scholar]
- 54. O'Flynn EAM, Fromageau J, Ledger AE, et al. Ultrasound tomography evaluation of breast density: a comparison with noncontrast magnetic resonance imaging. Invest Radiol. 2017;52:343–348. [DOI] [PMC free article] [PubMed] [Google Scholar]
- 55. Glide C, Duric N, Littrup P. Novel approach to evaluating breast density utilizing ultrasound tomography. Med Phys. 2007;34:744–753. [DOI] [PubMed] [Google Scholar]
- 56. Rahbar K, Gubern‐Merida A, Patrie JT, Harvey JA. Automated volumetric mammographic breast density measurements may underestimate percent breast density for high‐density breasts. Acad Radiol. 2017;24:1561–1569. [DOI] [PubMed] [Google Scholar]
- 57. Duffy SW, Morrish OWE, Allgood PC, et al. Mammographic density and breast cancer risk in breast screening assessment cases and women with a family history of breast cancer. Eur J Cancer. 2018;88:48–56. [DOI] [PMC free article] [PubMed] [Google Scholar]
Associated Data
This section collects any data citations, data availability statements, or supplementary materials included in this article.
Supplementary Materials
Video S1: Video which shows a rotating segmentation of the calibration phantom showing the high‐speed rods and spheres segmented out from the entire phantom. mp4
Video S2: Video that shows a rotating segmentation of the fibroglandular tissue of a human breast. Wmv


 Quantitative assessment of breast density using transmission ultrasound tomography