

Abstract
Objectives
This study examines the intrapatient variability in peak instantaneous left ventricular outflow tract (LVOT) gradients and aortic pulse pressures during rest, exercise, and after ventricular ectopy.
Background
Although the variability in LVOT gradients in patients with hypertrophic cardiomyopathy (HCM) is well known, the predictors of such variation are not. We hypothesized that quantitative invasive analysis of gradient variation could identify useful predictors of maximal gradients.
Methods
Variability in continuously recorded, high‐fidelity left ventricular and aortic pressure waveforms were evaluated by computer‐assisted analysis in the resting state (N = 659 beats) and during supine exercise (N = 379 beats) in a symptomatic patient with a resting LVOT gradient >30 mmHg and frequent ventricular ectopy.
Results
At rest, the peak left ventricular and aortic pressures at the time of the peak instantaneous LVOT gradient for all sinus and postectopic beats followed consistent regression slopes characterizing the potential energy loss between the LV cavity and aorta. During exercise, similar regression slopes were identified, and these converged with the resting slopes at the point of the maximal measured LVOT gradient. Component analysis of the LVOT gradient suggests that resting beat‐to‐beat variability provides information similar to post‐ectopic pressures for predicting maximal gradients in obstructive‐variant HCM.
Conclusions
Our study suggests that computer‐assisted analysis of hemodynamic variability in HCM may prove useful in characterizing the severity of obstruction. Further study is warranted to confirm the reproducibility and utility of this finding in a population with clinically significant exercise‐induced gradients.
Keywords: Brockenbrough‐Braunwald‐Morrow sign, cardiac catheterization, dynamic obstruction, ectopy, high fidelity pressure measurements, hypertrophic cardiomyopathy, LVOT gradient, multisensor catheter, supine submaximal exercise
1. BACKGROUND
Hypertrophic cardiomyopathy (HCM) is a common genetic disorder associated with a diverse family of sarcomere and related protein mutations, and a variable phenotypic presentation and clinical course.1 The hypertrophic changes induce a spectrum of hemodynamic alterations and have been categorized by the presence or absence of dynamic left ventricular outflow pressure gradients observed at rest or with provocation.1, 2, 3, 4 Left ventricular outflow tract (LVOT) gradients ≥30 mmHg are considered significant predictors of morbidity and mortality in patients with HCM, and in the absence of significant resting gradients, exercise provocation is advised.1, 5, 6 LVOT pressure gradients are most often measured noninvasively by Doppler,1, 5, 7, 8 but in some patients with eccentric mitral regurgitation accurate measurement is challenging and invasive measurement may be required. Invasive LVOT gradients are also evaluated during alcohol septal ablation procedures.9, 10 Invasive exercise LVOT gradient measurement is impractical for most catheterization laboratories. Invasive provocation methods include Valsalva maneuvers, isoproterenol infusion, and the postpremature ventricular contraction (PVC) responses to induced or spontaneous ventricular ectopy. Of these, post‐PVC hemodynamic response remains a cornerstone for invasive assessment.
In 1961, Brockenbrough et al. reported that PVC provocation was a useful technique for differentiating fixed from dynamic left ventricular outflow obstruction.11 In patients with fixed outflow tract lesions (e.g., aortic and discrete subvalvular stenosis), they observed that pulse pressures (PP) increased with increased LV systolic pressure (LVPs) in post‐PVC beats. In contrast, in HCM patients with dynamic LVOT obstruction, PP narrowed paradoxically (10 of 11 patients) or did not increase (one patient) as LVPs increased. Subsequently, these observations were confirmed in a larger group of HCM patients (N = 64).12 Thus, the failure to augment or a decrease in the arterial pulse in the post‐PVC beat was established as a signature hemodynamic feature of HCM, a.k.a. the Brockenbrough‐Braunwald‐Morrow (BBM) sign, but the dynamic nature of outflow obstruction results in significant variability in these responses.12 No information is provided in the current HCM practice guidelines1 or recent reviews13, 14, 15 that defines the sensitivity or specificity of BBM sign for eliciting clinically significant LVOT gradients or compares this provocation with gradients induced by other provocations.
Spontaneous variation in the LVOT gradient is a hallmark feature of HCM and may cause incorrect classification of the severity of obstruction in a significant number of patients.9, 16 To better define LVOT gradient variability and the variability of the BBM sign in HCM, we reviewed continuously recorded multi‐sensor, high‐fidelity waveform data from archived cardiac catheterization records of a single HCM patient with frequent ectopic beats both at rest and during supine exercise. It was reasoned that this would control for phenotypic variability and provide sufficient data for descriptive statistics to assess PP and LVOT variation.
2. PATIENT
A 32‐year‐old active duty male soldier presented for dyspnea on exertion, lightheadedness, and chest pain. On examination, his blood pressure was 110/70 mmHg and his pulse regular with a rate of 100 bpm. His chest was clear to auscultation and no jugular venous distension was noted. A bisferiens carotid pulse was present as well as a palpable S4, a faintly palpable systolic thrill, audible S4, normal S1, physiological spit S2, and a grade IV/VI harsh systolic ejection murmur (SEM) noted at the left sternal border. The SEM increased with Valsalva, decreased with squatting and increased with standing. An electrocardiogram (ECG) demonstrated an abnormal precordial R wave progression, and repolarization abnormalities consistent with left ventricular hypertrophy. A transthoracic echocardiogram revealed systolic anterior motion of the mitral valve leaflet, mild mitral regurgitation and left atrial enlargement. Maximum septal thickness was 2.4 cm and the septal to posterior wall thickness ratio was greater than 1.5. The patient was diagnosed with HCM and propranolol was up‐titrated to 240 mg four times a day for symptom management. This was unsuccessful, so the patient was referred for further evaluation. The patient completed 6:35 (min:sec) of a standard Bruce protocol exercise test attaining a peak blood pressure of 136/82 mmHg and pulse rate of 115 bpm. No chest pain or significant ECG changes were reported with exercise and the stress test was stopped due to fatigue. Exercise Doppler was not obtained as stress echo technology did not exist at the time of this evaluation. Cardiac catheterization was performed to further elucidate the patient's continued symptoms.
2.1. Cardiac catheterization procedure
The patient underwent catheterization in a fasting and mildly sedated state. Cardiac medications were suspended 48 hr prior to catheterization. Right and left heart catheterizations were performed with a right brachial approach using fluoroscopic guidance. Coronary angiography was unremarkable. Right and left heart pressures were simultaneously recorded with multisensory, high‐fidelity catheters (Millar Instruments, Houston, Texas). The peak instantaneous LVOT pressure gradient was obtained by LVP – AoP waveform subtraction and the aortic mid‐systolic pressure at the time of the peak instantaneous gradient (AoPPIG) was also analyzed. Beat‐to‐beat hemodynamic variability in sinus beats and the hemodynamic changes with spontaneous and catheter induced ectopy were evaluated from continuously recorded waveform data during steady‐state rest (659 cardiac cycles) and submaximal supine ergometry at 1,200 fpm (≈27 W; 379 cardiac cycles) using computer‐assisted analysis (σ‐Pad version 3.1, USA Institute of Surgical Research). Post‐PVC aortic PP were compared to PP of the cardiac cycles preceding ventricular ectopy11, 12 and PP was measured as the difference between AoPs and the onset of pressure rise for the beat. The data presented in this study were extracted from de‐identified records (circa 1980) from the hemodynamic waveform library at Brooke Army Medical Center. This project was approved by US Army Regional Health Command‐Central Institutional Review Board (IRB). Additional details for the catheterization protocol, hemodynamic processing, and descriptions of waveform variability pre‐ and post‐ectopy are present in the appendix (on‐line supplement).
3. DATA ANALYSIS
The data are presented as mean ± standard deviation. A two‐tailed paired t‐test was employed to assess changes between pre‐ectopic and post‐ectopic sinus beats. Beat‐to‐beat sinus waveform variability was compared to pre‐ and post‐ectopic beat hemodynamic changes and beats with significant sinus arrhythmia using a one‐way analysis of variance (ANOVA). Linear regression analyses were performed to assess the strength of association between changes in PP and LVOT gradient and to characterize energy transfer losses between the LV cavity (LVPs) and the aorta (AoPPIG). P‐values <0.05 were considered significant. Sigma Plot (version 12.5) and Microsoft Excel 2010 were used for statistical and graphic analysis.
4. RESULTS
Table 1 presents the rest and exercise hemodynamic data reported at the time of cardiac of catheterization. The patient was reported to have a resting LVOT gradient of 40 mmHg that increased to 100 mmHg in post‐PVC beats. LVEDP and PCWP were within normal limits at rest but elevated during supine submaximal exercise. The right heart pressures were within normal limits at rest and increased modestly during exercise. Pulmonary vascular resistance (PVR) and systemic vascular resistance (SVR) decreased normally. Mild mitral regurgitation was noted by ventriculography.
Table 1.
Hemodynamics at cardiac catheterization
| Parameter | Rest | Exercise* |
|---|---|---|
| Heart rate and cardiac output | ||
| Heart rate (bpm) | 82 | 122 |
| Ao O2 sat (%) | 96.3 | 96.3 |
| PA O2 sat (%) | 82.3 | 64.8 |
| Cardiac output (L/min) | 5.8 | 9.1 |
| Pressures (mmHg) | ||
| RAPm | 6 | 12 |
| RVPs/RVEDP | 24/6 | 50/12 |
| PAPs/d/m | 21/9/14 | 42/23/28 |
| PCWPm | 6 | 20 |
| LVPs/LVEDP | 154/6 | 170/20 |
| AoPs/d/m | 114/78/100 | 135/90/110 |
| LVOT gradient | 40 | >100 |
| Resistances (d * sec * cm −5 ) | ||
| TPR | 118 | 166 |
| PVR | 67 | 47 |
| SVR | 817 | 616 |
| Ventriculography (mL) | ||
| LVED volume | 134 | |
| LVES volume | 27 | |
| Stroke volume | 107 | |
| LVEF (%) | 80 |
Abbreviations: RAPm, mean right atrial pressure; RVPs, right ventricular systolic pressure; RVEDP, right ventricular end‐diastolic pressure; PCWPm, mean pulmonary capillary wedge pressure; LVPs, left ventricular systolic pressure; LVEDP, left ventricular end‐diastolic pressure; AoPs/d/m, aortic systolic/diastolic/mean pressures; LVOT, left ventricular outflow tract; TPR, total pulmonary resistance, PVR, pulmonary vascular resistance, SVR, systemic vascular resistance, LVED, LV end‐diastolic; LVES, LV end‐systolic.
Supine ergometry at 1,200 fpm (≈27 W).
In the resting state, ventricular ectopic events included: 28 nonejecting PVCs, one PVC with aortic ejection, four episodes of ventricular bigeminy, and three ventricular couplets. The PVC morphology remained consistent during baseline conditions suggestive of a unifocal origin. Due to the predominance of isolated non‐ejecting PVCs in the resting state (N = 28), only these beats were analyzed for occurrence of BBM sign. Also noted in baseline recordings were 19 cardiac cycles with significant sinus arrhythmia (RR prolongation) with PP changes similar to changes in post‐PVC beats. Sinus arrhythmia beats were separately evaluated. During exercise, 34 PVCs with ejection, four nonejecting PVCs and two ventricular couplets were identified. All isolated PVCs (N = 38) were evaluated.
Figure 1 illustrates examples of the BBM sign at rest and during exercise. In both examples, the post‐PVC PP decreased and the LVOT gradient increased consistent with the classically defined BBM sign. Details of the hemodynamic changes observed between the pre‐ and post‐ectopic beats at rest and during exercise are provided in Tables 2 and 3. Figure 2 illustrates the intrapatient variability in LVOT gradient as a function of central aortic PP measurements from continuously recorded waveforms at rest, and for pre‐ and post‐PVC beats during exercise. The regression line (blue) illustrates an inverse but poor (R2 = 0.263) relationship between LVOT gradient and AoPP for sinus beats with the greatest beat‐to‐beat uncertainty in LVOT gradients noted at lower aortic PP.
Figure 1.

Illustrates examples of the Brockenbrough‐Braunwald‐Morrow sign at rest and during exercise. In both examples, the post‐PVC pulse pressures decreased and the LVOT gradient increased consistent with classically defined BBM sign
Table 2.
Hemodynamics pre‐ vs. post‐PVC at rest
| Parameter | Rest (N = 28) | ||
|---|---|---|---|
| Pre‐PVC | Post‐PVC | ||
| (mean ± SD) | (mean ± SD) | P ≤ | |
| Rate and intervals | |||
| HR (bpm) | 84 ± 11 | 56 ± 7 | <0.001 |
| RR interval (sec) | 0.728 ± 0.106 | 1.085 ± 0.147 | <0.001 |
| Diastolic duration (sec) | 0.444 ± 0.103 | 1.167 ± 0.145 | <0.001 |
| LVET (msec) | 281 ± 12 | 312 ± 11 | <0.001 |
| Aortic pressures | |||
| AoPs (mmHg) | 116.3 ± 6.7 | 94.1 ± 4.0 | <0.001 |
| AoPd (mmHg) | 80.3 ± 5.0 | 62.4 ± 3.1 | <0.001 |
| AoPP (mmHg) | 36.0 ± 3.3 | 31.7 ± 3.1 | <0.001 |
| AoPm (mmHg) | 83.6 ± 2.9 | 80.3 ± 3.6 | <0.001 |
| AoPPIG (mmHg) | 109.9 ± 7.3 | 83.4 ± 3.2 | <0.001 |
| LV pressures and LV dP/dt | |||
| LVEDP (mmHg) | 11.2 ± 3.2 | 11.9 ± 3.4 | 0.447 |
| LVPs (mmHg) | 159.4 ± 11.0 | 201.1 ± 6.0 | <0.001 |
| Peak +dP/dt (mmHg/sec) | 2,654 ± 270 | 3,090 ± 235 | <0.001 |
| Peak −dP/dt (mmHg/sec) | −2,071 ± 174 | −1,535 ± 156 | <0.001 |
| Gradients | |||
| LV‐Ao mean (mmHg) | 27.4 ± 6.4 | 70.7 ± 4.4 | <0.001 |
| Peak to peak (mmHg) | 43.1 ± 10.5 | 107.0 ± 7.3 | <0.001 |
| Peak instantaneous (mmHg) | 49.5 ± 12.0 | 117.7 ± 7.0 | <0.001 |
Table 3.
Hemodynamics pre‐ vs. post‐PVC during exercise
| Parameter | Exercise (N = 38) | ||
|---|---|---|---|
| Pre‐PVC | Post‐PVC | ||
| (mean ± SD) | (mean ± SD) | P ≤ | |
| Rate and intervals | |||
| HR (bpm) | 119 ± 3 | 90 ± 4 | <0.001 |
| RR interval (sec) | 0.506 ± 0.014 | 0.672 ± 0.034 | <0.001 |
| Diastolic duration (sec) | 0.247 ± 0.029 | 0.750 ± 0.045 | <0.001 |
| LVET(msec) | 260 ± 5 | 274 ± 5 | <0.001 |
| Aortic pressures | |||
| AoPs (mmHg) | 133.9 ± 8.1 | 112.5 ± 5.7 | <0.001 |
| AoPd (mmHg) | 89.8 ± 6.5 | 70.3 ± 5.8 | <0.001 |
| AoPP (mmHg) | 44.1 ± 2.4 | 42.3 ± 2.3 | <0.001 |
| AoPm (mmHg) | 107.7 ± 9.8 | 92.6 ± 5.4 | <0.001 |
| AoPPIG (mmHg) | 123.6 ± 10.6 | 96.9 ± 5.4 | <0.001 |
| LV pressures and LV dP/dt | |||
| LVEDP (mmHg) | 23.5 ± 4.3 | 18.5 ± 3.0 | <0.001 |
| LVPs (mmHg) | 187.3 ± 10.4 | 204.0 ± 7.7 | <0.001 |
| Peak +dP/dt (mmHg/sec) | 3,677 ± 247 | 3,989 ± 191 | <0.001 |
| Peak −dP/dt (mmHg/sec) | −2,573 ± 146 | −1,935 ± 267 | <0.001 |
| Gradients | |||
| LV‐Ao mean (mmHg) | 34.6 ± 5.8 | 61.4 ± 6.7 | <0.001 |
| Peak to peak (mmHg) | 53.3 ± 8.8 | 91.4 ± 10.7 | <0.001 |
| Peak instantaneous (mmHg) | 63.6 ± 11.1 | 107.3 ± 10.5 | <0.001 |
Figure 2.
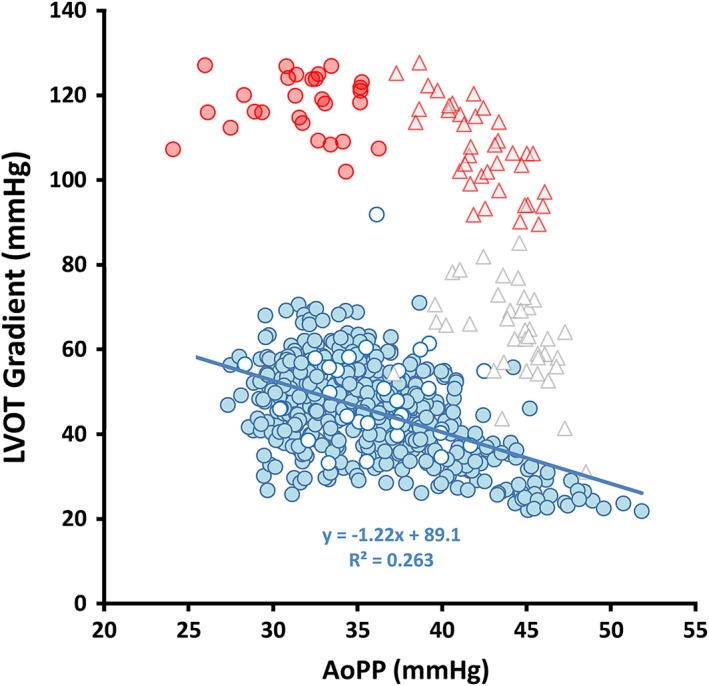
Illustrates sinus beat‐to‐beat variability in the LVOT gradient as a function of aortic pulse pressure (blue filled) and pre‐ vs. post‐PVC (white circles with blue borders vs. red filled circles) at rest and pre‐and post‐ectopic beats during exercise (open vs. filled triangles)
During baseline conditions, the peak instantaneous LVOT gradient from continuously recorded cardiac cycles excluding beats associated with ectopy ranged from 22 to 86 mmHg (mean ± SD = 46.4 ± 11.7 mmHg). At rest, 8.7% of gradients were <30 mmHg, 54.6% were between 30 and 50 mmHg and 36.7% were >50 mmHg. The BBM sign was observed in 92.9% (26/28) of post‐PVC beats. The average decrease in PP in post‐PVC beats was −4 ± 3 mmHg (−11.8 ± 8.2%, P < .001) and the LVOT gradient increased 68 ± 11 mmHg (P < .001). The range of post‐PVC PP changes was −11 to +1 mmHg and the changes in LVOT gradient ranged from 31 to 89 mmHg. Left ventricular systolic pressure in the post‐PVC beats increased by 42 ± 9 mmHg (P < .001) and the AoPPIG decreased from 109 ± 7 to 83 ± 3 mmHg (−24 ± 5%, P < .001). Although an inverse relationship (Figure 3) was noted between PP changes and changes in the LVOT gradient with ventricular ectopy, the changes in PP poorly predicted the changes in the peak outflow gradient (Δ peak gradient = −1.62 ΔPP + 61.1, R2 = 0.198, P = .018). Also noted at baseline were hemodynamic changes in 17/19 (89.5%) during sinus arrhythmia with RR interval prolongation that were similar to PP changes observed in post‐PVC beats, but these changes were of a lesser magnitude (Appendix: Table S1 and Figure, online supplement).
Figure 3.

Compares the changes in pulse pressure (ΔPP) and LVOT gradient (ΔLVOT gradient) associated with ventricular ectopy at rest (N = 28) and exercise (N = 34) with normal sinus beat‐to‐beat respiratory variability (N = 292). Post‐PVC beats with slight increases in pulse pressure are indicated by “X”. Solid red circles represent response to PVCs at rest and solid triangles reflect changes during exercise. Sinus beat‐to‐beat changes are illustrated by blue filled circles
As expected, PP (42 ± 2 vs. 32 ± 3 mmHg) and LVOT gradients (64 ± 11 vs. 50 ± 12 mmHg) increased during exercise (P < .001) and the BBM sign was observed in 84.2% (N = 32/38) of the post‐PVC beats. However, the fall in PP in post‐PVC beats (−1.9 ± 2.8 mmHg) was less than observed following ectopy at rest (P < .001). In post‐PVC beats, the LVOT gradient increased 44 ± 11 mmHg (P < .005), LVPs increased 18 ± 13 mmHg (P < .001), and the AoPPIG decreased 27 ± 10 mmHg (P < .001). Similar to the observations in the resting state (Figure 3), the changes in PP during exercise poorly predicted the changes in peak instantaneous gradients (Δ peak gradient = −2.31 ΔPP + 39.4, R2 = 0.134, P = .026). When post‐PVC beats were compared between rest and exercise, no difference was noted in LVPs (201 ± 6 vs. 204 ± 8 mmHg, P = .091) and the post‐PVC gradients were lower during exercise (107 ± 10 vs. 118 ± 7 mmHg, P < .001).
Figure 3 also compares changes in PP (Δ PP) and LVOT gradient (Δ LVOT gradient) associated with ectopy (rest and exercise) with normal resting sinus beat‐to‐beat variability (N = 292). In this patient, inspiration was associated with a decrease in the LVOT gradient and an increase in PP in normal sinus beats at baseline. The 95% confidence intervals (CI) for normal sinus beat‐to‐beat variability for ΔPP ranged from ±4.2 mmHg and the ΔLVOT gradient ranged from ±16 mmHg, respectively. Although regression lines were offset with ectopic changes consistent with the presence of increased LVOT gradient in post‐PVC beats, little difference was noted among regression line slopes. The post ectopic beats that did not meet criteria for BBM sign (“x” symbols) were noted to be on same trend line as the beats that met criteria and these beats were within the 95% CI for sinus beat‐to‐beat variability. Furthermore, the CI for AoP PP changes with ectopy at rest (95% CI = −10.4 to 1.8 mmHg) and exercise (95% CI = −7.3 to 3.5 mmHg) overlap the CI for sinus beat‐to‐beat changes. Results suggest that the forces associated with the BBM sign variability may be similar to sinus beat‐to‐beat variability. Additionally, sinus arrhythmia with prolongation of RR interval produced changes similar to those observed with the BBM sign, but were of lesser magnitude (Appendix supplement Table S1).
Given the similarity of LVPs values in post‐PVC beats between rest and exercise and the similarity in slopes of the changes in LVOT gradient and PP with sinus beats and ectopy, we further examined the relationship between the peak LVOT gradient and LVPs and the aortic pressure at peak gradient (AoPPIG) for all beats at rest (sinus beat‐to‐beat, pre‐ and post‐PVCs and with prolonged RR interval) and the pre‐ and post‐ventricular ectopic beats during exercise (Figure 4). Figure 4 presents pre‐PVC and post‐PVC beats as solid white and filled red symbols with red borders, respectively. The pre‐ and post‐PVC response to exercise is depicted as the diamond symbols. It is noteworthy that for a given physiological state (rest or exercise), the sinus and the pre‐ and post‐ectopic beats follow a consistent slope characterizing the potential energy difference between the LV cavity and aorta. It is also noteworthy that in the resting state the responses to ectopy and RR interval prolongation followed the same trajectory as the sinus beat‐to‐beat variability. Furthermore, the relative significance of LVPs and AoPPIG for determining LVOT gradient in rest and exercise is depicted by the respective slopes of the regression lines. For example, for any given increase in LVOT gradient with exercise, AoP PIG decreases to a greater extent than LVPs increases and conversely, changes in LVPs are greater than the fall in AoPPIG at rest. The regression of LVPs and AoP PIG also characterizes the potential energy loss between the LV cavity and aorta and suggests that the regression lines for LVPs and AoPPIG at rest state converge with exercise at a point of similar maximal potential energy loss. In this patient, the convergence point predicts a peak instantaneous gradient = 149 mmHg, LVPs = 222 mmHg and mid‐systolic AoPPIG = 73 mmHg; this suggests that 2/3 of the potential pressure energy would be lost during ejection when systolic contraction is maximally augmented.
Figure 4.

Compares changes in LVPs and AoPPIG at the time of the peak instantaneous LVOT gradient during rest and during exercise. Red regression lines represent changes in LVPs and AoPPIG at rest and dark dashed regression lines represent changes during exercise. Circles represent LVPs during rest (sinus beats not associated with ectopy = blue, pre‐PVC beats = white, post‐PVC beats = red and the beats with prolonged RR interval blue borders and light red filled). The triangles indicate AoPPIG with symbol colors similar to LVPs. The diamond symbols represent exercise pre‐ and post‐PVC beats for LVPs and AoPPIG. The open triangles are pre‐PVC and the gray triangles with red borders are post‐PVC beats
5. DISCUSSION
In this study, we examined the variability in the peak instantaneous LVOT gradient and BBM sign in a symptomatic active duty soldier with HCM. This patient had a resting gradient in sinus rhythm >30 mmHg that increased to >50 mmHg during supine submaximal exercise. His resting sinus arrhythmia and frequent, isolated PVCs during rest and exercise created a unique opportunity to accurately assess gradient variability and postectopic hemodynamic changes from invasive multisensor, high‐fidelity raw hemodynamic data.
It has long been known that in HCM patients outflow tract obstruction is “notable for spontaneous variability”;12, 17 however, the clinical significance of this variability is generally underappreciated.16 A recent study from the Mayo Clinic reported that 50% of an HCM cohort referred for invasive hemodynamic evaluation or percutaneous septal ablation had fluctuations in LVOT gradients “to the degree that their classification as severe versus non‐severe obstruction varied during a single study”.9 Proposed sources of gradient variation during a steady state include: cycle‐length dependent changes in LV contractility, afterload, preload, and degree of mitral regurgitation; changes in autonomic tone during exercise and postectopy; respiratory induced changed in afterload.18, 19, 20
Our patient also demonstrated the challenge of assessing LVOT gradients in HCM. Resting gradients varied between classifications of nonsignificant to severe with additional variability noted in post‐PVC beats during rest and exercise. Given that the peak instantaneous gradient = LVPs – AoPPIG, we examined the relationship between these two parameters and the LVOT gradient. Findings suggest that the spectrum of beat‐to‐beat variability, pre‐ and post‐ectopic changes and changes with prolongation of RR interval fall within a continuum in which regression slopes indicate the relative contribution of LVPs and AoPpig forming the LVOT gradient. It is noteworthy that regression lines for these elements converge for rest and exercise at a maximal LVOT gradient and define the point of potential energy lost when systolic contraction is maximally augmented.
We hypothesize that this relationship is a patient‐specific function, and that it could be derived from careful analysis of multiple beats in the resting state. If validated by further research, such a function could be used to predict the maximal exercise LVOT gradients from the measurement of variability in resting hemodynamic data. While it is known that LVOT gradients increase with post systolic potentiation the relationship with the beat‐to‐beat variability across hundreds of beats has not been previously reported. Present guidelines for HCM therapy use a binary gradient cutoff value based on the pivotal population‐based research from Maron et al. 5. Our research suggests that a more continuous function for predicting the maximal potential pressure loss in each patient might further improve classification of obstructive HCM patients and optimize therapy.
Other investigators have proposed using the BBM sign to further classify HCM patients when invasive resting LVOT gradients are below 30 mmHg or to accurately quantify gradients during alcohol septal ablation.21, 22 However, we show that PP changes poorly predict changes in LVOT gradients. In our patient, most post‐PVC beats at rest (≈93%) and during exercise (≈84%) met the classic definition for a positive BBM sign, but some post‐PVC beats were associated with a slight increase in PP and these appear to lie on the same trend line with ΔLVOT gradients as the post‐PVC beats with decreased PP. This observation suggests that interpretation of the post‐PVC response in PP may benefit from an understanding of beat‐to‐beat variability and the observation of slight increases in post‐PVC PP may not rule out the presence of obstructive physiology.
6. CONCLUSION
In summary, this case provided a unique opportunity to study invasive, postectopic hemodynamic changes during rest and supine exercise, and reminds us of the complex pathophysiology of HCM. Our study suggests that computer‐assisted analysis of hemodynamic variability in HCM may prove useful in characterizing the severity of obstruction. Opportunities remain for improving diagnostic criteria for the assessment of these challenging patients.
DISCLAIMER STATEMENT
The view(s) expressed herein are those of the author(s) and do not reflect the official policy or position of Brooke Army Medical Center, the U.S. Army Medical Department, the U.S. Army Office of the Surgeon General, the Department of the Air Force, the Department of the Army or the Department of Defense or the U.S. Government.
Supporting information
Figure S1. Simultaneously recorded right and left heart hemodynamics at rest and during supine exercise. Right heart pressures include right atrial, ventricular and pulmonary artery pressures. Left heart pressures include left ventricular and aortic pressures. The respiratory signal (inspiration downward deflection) is shown at the bottom of the figure.
Figure S2. Demonstrates the variability in the Brockenbrough‐Braunwald‐Morrow sign with isolated PVC at rest. Top figure shows the beat‐to‐beat variability in the aortic pressure wave contour with an ensemble averaged (N = 28) left ventricular (blue) and the aortic pressure (red). The ensemble averaged aortic pressure (lower panel) is offset to compare pre‐ and post‐PVC beat amplitude and morphology.
Figure S3. Illustrates the variability in the Brockenbrough‐Braunwald‐Morrow sign during exercise. Top figure shows the beat‐to‐beat variability in the aortic pressure wave contour with an ensemble averaged (N = 34) left ventricular (blue) and the aortic pressures (red). The ensemble averaged aortic pressure (lower panel) was offset to compare pre‐ and post‐PVC beat morphology.
Figure S4. Also noted at baseline were hemodynamic changes during sinus arrhythmia with RR interval prolongation that were similar to pulse pressure changes observed in post PVC beats (right panel), but these changes were of a lesser magnitude (Table S1). The average decrease in pulse pressure was −‐3.1 ± 3.5 mmHg (pP < 0.001) and the LVOT gradient increased 42 ± 12 mmHg (pP < 0.001). Right panel shows the variability in the aortic pressure waveform with sinus arrhythmia. Top left panel shows the beat‐to‐beat variability in the aortic pressure waveform contour with an ensemble averaged (N = 19) left ventricular (blue) and the aortic pressures (red). The ensemble averaged aortic pressure (lower panel) was offset to compare pre‐ and post‐PVC beat morphology.
Figure S5. Illustrates the spectrum of left ventricular and central aortic waveforms associated with BBM sign. The waveforms are represent ensemble averages of multiple waveforms and are noteworthy for an early pressure rise in aortic pressures, a spike and dome or a bifid pulse in post ectopic beats, and a mid‐systolic pressure gradient.
Table S1. Hemodynamics Prolonged RR interval (rest)
Appendix S1: Supplementary Material
Appendix S2: Supplementary Material
ACKNOWLEDGMENTS
The authors would like to express their gratitude for the software development efforts of Mr. William Baker, US Army Institute of Surgical Research, Joint Base San Antonio, FT Sam Houston, TX. This software provided integrated waveform visualization with beat‐by‐beat analysis.
Bauch TD, Smith AJ, Murgo JP, Watts JA, Rubal BJ. Gradient variability in hypertrophic cardiomyopathy: New insights from computer‐assisted, high fidelity, rest and exercise hemodynamic analysis. Catheter Cardiovasc Interv. 2019;94:E37–E43. 10.1002/ccd.27998
REFERENCES
- 1. Gersh BJ, Maron BJ, Bonow RO, et al. 2011 ACCF/AHA guideline for the diagnosis and treatment of hypertrophic cardiomyopathy: Executive summary: A report of the American College of Cardiology Foundation/American Heart Association Task Force on Practice Guidelines. J Am Coll Cardiol. 2011;58:2703‐2738. [DOI] [PubMed] [Google Scholar]
- 2. Maron MS, Olivotto I, Zenovich AG, et al. Hypertrophic cardiomyopathy is predominantly a disease of left ventricular outflow tract obstruction. Circulation. 2006;114(21):2232‐2239. [DOI] [PubMed] [Google Scholar]
- 3. Ommen SR, Shah PM, Tajik AJ. Left ventricular outflow tract obstruction in hypertrophic cardiomyopathy: Past, present and future. Heart. 2008;94(10):1276‐1281. [DOI] [PubMed] [Google Scholar]
- 4. Maron MS, Rowin EJ, Olivotto I, et al. Contemporary natural history and management of nonobstructive hypertrophic cardiomyopathy. J Am Coll Cardiol. 2016;67(12):1399‐1409. [DOI] [PubMed] [Google Scholar]
- 5. Maron MS, Olivotto I, Betocchi S, et al. Effect of left ventricular outflow tract obstruction on clinical outcome in hypertrophic cardiomyopathy. N Engl J Med. 2003;348(4):295‐303. [DOI] [PubMed] [Google Scholar]
- 6. Maron BJ, Maron MS. Hypertrophic cardiomyopathy. Lancet. 2013;381(9862):242‐255. [DOI] [PubMed] [Google Scholar]
- 7. Rowin EJ, Maron BJ, Olivotto I, Maron MS. Role of exercise testing in hypertrophic cardiomyopathy. JACC Cardiovasc Imaging. 2017;10(11):1374‐1386. [DOI] [PubMed] [Google Scholar]
- 8. Panza JA, Petrone RK, Fananapazir L, Maron BJ. Utility of continuous wave Doppler echocardiography in the noninvasive assessment of left ventricular outflow tract pressure gradient in patients with hypertrophic cardiomyopathy. J Am Coll Cardiol. 1992;19(1):91‐99. [DOI] [PubMed] [Google Scholar]
- 9. Geske JB, Sorajja P, Ommen SR, Nishimura RA. Variability of left ventricular outflow tract gradient during cardiac catheterization in patients with hypertrophic cardiomyopathy. JACC Cardiovasc Interv. 2011;4(6):704‐709. [DOI] [PubMed] [Google Scholar]
- 10. Spirito P, Rossi J, Maron BJ. Alcohol septal ablation: In which patients and why? Ann Cardiothorac Surg. 2017;6(4):369‐375. [DOI] [PMC free article] [PubMed] [Google Scholar]
- 11. Brockenbrough EC, Braunwald E, Morrow AG. A hemodynamic technic for the detection of hypertrophic subaortic stenosis. Circulation. 1961;23:189‐194. [Google Scholar]
- 12. Braunwald E, Lambrew CT, Rockoff SD, Ross J Jr, Morrow AG. Idiopathic hypertrophic subaortic stenosis. I: A description of the disease based upon an analysis of 64 patients. Circulation. 1964;30:3‐119. [DOI] [PubMed] [Google Scholar]
- 13. Maron BJ, Ommen SR, Semsarian C, Spirito P, Olivotto I, Maron MS. Hypertrophic cardiomyopathy: Present and future, with translation into contemporary cardiovascular medicine. J Am Coll Cardiol. 2014;64(1):83‐99. [DOI] [PubMed] [Google Scholar]
- 14. Varma PK, Neema PK. Hypertrophic cardiomyopathy: Part 1 – Introduction, pathology and pathophysiology. Ann Card Anaesth. 2014;17:118‐124. [DOI] [PubMed] [Google Scholar]
- 15. Marian AJ, Braunwald E. Hypertrophic cardiomyopathy: Genetics, pathogenesis, clinical manifestations, diagnosis, and therapy. Circ Res. 2017;121(7):749‐770. [DOI] [PMC free article] [PubMed] [Google Scholar]
- 16. Geske JB, Sorajja P, Ommen SR, Nishimura RA. Left ventricular outflow tract gradient variability in hypertrophic cardiomyopathy. Clin Cardiol. 2009;32(7):397‐402. [DOI] [PMC free article] [PubMed] [Google Scholar]
- 17. Maron BJ, Rowin EJ, Udelson JE, Maron MS. Clinical spectrum and management of heart failure in hypertrophic cardiomyopathy. JACC Heart Fail. 2018;6(5):353‐363. [DOI] [PubMed] [Google Scholar]
- 18. Reddy CVR, Gould L, Singh BK, Zen B. Expiratory increase in the LV outflow obstruction in IHSS. Cathet Cardiovasc Diagn. 1980;6:349‐350. [DOI] [PubMed] [Google Scholar]
- 19. Wigle ED, Henderson M, Rakowski H, Wilansky S. Muscular (hypertrophic) subaortic stenosis (hypertrophic obstructive cardiomyopathy): The evidence for true obstruction to left ventricular outflow. Postgrad Med J. 1986;62(728):531‐536. [DOI] [PMC free article] [PubMed] [Google Scholar]
- 20. Jain R, Osranek M, Jan MF, et al. Marked respiratory‐related fluctuations in left ventricular outflow tract gradients in hypertrophic obstructive cardiomyopathy: An observational study. Eur Heart J Cardiovasc Imaging. 2018;19(10):1126‐1133. [DOI] [PubMed] [Google Scholar]
- 21. Trevino AR, Buergler J. The Brockenbrough‐Braunwald‐morrow sign. Methodist Debakey Cardiovasc J. 2014;10(1):34‐37. [DOI] [PMC free article] [PubMed] [Google Scholar]
- 22. Soon CY, Buergler JM. Alcohol septal ablation and the Brockenbrough‐Braunwald phenomenon. Catheter Cardiovasc Interv. 2008;72(7):1016‐1024. [DOI] [PubMed] [Google Scholar]
Associated Data
This section collects any data citations, data availability statements, or supplementary materials included in this article.
Supplementary Materials
Figure S1. Simultaneously recorded right and left heart hemodynamics at rest and during supine exercise. Right heart pressures include right atrial, ventricular and pulmonary artery pressures. Left heart pressures include left ventricular and aortic pressures. The respiratory signal (inspiration downward deflection) is shown at the bottom of the figure.
Figure S2. Demonstrates the variability in the Brockenbrough‐Braunwald‐Morrow sign with isolated PVC at rest. Top figure shows the beat‐to‐beat variability in the aortic pressure wave contour with an ensemble averaged (N = 28) left ventricular (blue) and the aortic pressure (red). The ensemble averaged aortic pressure (lower panel) is offset to compare pre‐ and post‐PVC beat amplitude and morphology.
Figure S3. Illustrates the variability in the Brockenbrough‐Braunwald‐Morrow sign during exercise. Top figure shows the beat‐to‐beat variability in the aortic pressure wave contour with an ensemble averaged (N = 34) left ventricular (blue) and the aortic pressures (red). The ensemble averaged aortic pressure (lower panel) was offset to compare pre‐ and post‐PVC beat morphology.
Figure S4. Also noted at baseline were hemodynamic changes during sinus arrhythmia with RR interval prolongation that were similar to pulse pressure changes observed in post PVC beats (right panel), but these changes were of a lesser magnitude (Table S1). The average decrease in pulse pressure was −‐3.1 ± 3.5 mmHg (pP < 0.001) and the LVOT gradient increased 42 ± 12 mmHg (pP < 0.001). Right panel shows the variability in the aortic pressure waveform with sinus arrhythmia. Top left panel shows the beat‐to‐beat variability in the aortic pressure waveform contour with an ensemble averaged (N = 19) left ventricular (blue) and the aortic pressures (red). The ensemble averaged aortic pressure (lower panel) was offset to compare pre‐ and post‐PVC beat morphology.
Figure S5. Illustrates the spectrum of left ventricular and central aortic waveforms associated with BBM sign. The waveforms are represent ensemble averages of multiple waveforms and are noteworthy for an early pressure rise in aortic pressures, a spike and dome or a bifid pulse in post ectopic beats, and a mid‐systolic pressure gradient.
Table S1. Hemodynamics Prolonged RR interval (rest)
Appendix S1: Supplementary Material
Appendix S2: Supplementary Material