

Abstract
Procarbazine hydrochloride (PCH) is a DNA‐reactive hematopoietic carcinogen with potent and well‐characterized clastogenic activity. However, there is a paucity of in vivo mutagenesis data for PCH, and in vitro assays often fail to detect the genotoxic effects of PCH due to the complexity of its metabolic activation. We comprehensively evaluated the in vivo genotoxicity of PCH on hematopoietic cells of male MutaMouse transgenic rodents using a study design that facilitated assessments of micronuclei and Pig‐a mutation in circulating erythrocytes, and lacZ mutant frequencies in bone marrow. Mice were orally exposed to PCH (0, 6.25, 12.5, and 25 mg/kg/day) for 28 consecutive days. Blood samples collected 2 days after cessation of treatment exhibited significant dose‐related induction of micronuclei in both immature and mature erythrocytes. Bone marrow and blood collected 3 and 70 days after cessation of treatment also showed significantly elevated mutant frequencies in both the lacZ and Pig‐a assays even at the lowest dose tested. PCH‐induced lacZ and Pig‐a (immature and mature erythrocytes) mutant frequencies were highly correlated, with R2 values ≥0.956, with the exception of lacZ vs. Pig‐a mutants in mature erythrocytes at the 70‐day time point (R2 = 0.902). These results show that PCH is genotoxic in vivo and demonstrate that the complex metabolism and resulting genotoxicity of PCH is best evaluated in intact animal models. Our results further support the concept that multiple biomarkers of genotoxicity, especially hematopoietic cell genotoxicity, can be readily combined into one study provided that adequate attention is given to manifestation times. Environ. Mol. Mutagen. 60:505–512, 2019. © 2018 Her Majesty the Queen in Right of Canada
Keywords: mutagenicity, bone marrow, red blood cells, mutation, micronuclei
INTRODUCTION
Procarbazine hydrochloride (PCH) is a hydrazine derivative that is reemerging as a useful drug that in combination with other anti‐neoplastic agents is effective at treating several malignancies, especially gliomas and Hodgkin's lymphoma (Armand et al. 2007). While clearly efficacious, concerns about PCH treatment‐induced tumors exist (Levine and Bloomfield 1992). Mouse bioassays indicate that lung and hematopoietic cells are important target sites (IARC 1981). Furthermore, cancer patients treated with PCH in combination with other antineoplastic agents have an elevated risk of secondary malignancies, especially hematopoietic cancers (IARC 1981; Kaldor et al. 1988).
PCH appears to be a particularly effective in vivo clastogen inducing both micronuclei in bone marrow (Romagna and Schneider 1990) and DNA breaks as detected by the alkaline elution (Holme et al. 1989) and comet (Sasaki et al. 1998) assays in multiple tissues including stomach and liver. Furthermore, significant increases in median percent tail DNA were recently reported in bone marrow, liver, kidney, and lungs of rats, 1 day after a 28‐day exposure to 30 or 60 mg PCH/kg/day (Chen et al. 2019). However, PCH's mutagenic activity is less well‐characterized. For instance, using the transgenic MutaMouse model, Suzuki et al. (1999) showed that a single intraperitoneal (i.p.) injection of 50 mg PCH/kg was a potent micronucleus inducer in blood (mean fold change: 19.6x), while no change to lacZ mutation frequencies were observed in multiple tissues. In contrast, PCH mutagenicity was evident in lung, bone marrow, and spleen after five daily administrations of 150 mg/kg by i.p. injection (Suzuki et al. 1999). Following a 3‐day exposure regimen by oral gavage Phonethepswath et al. (2013) confirmed the strong clastogenic activity of PCH and observed a moderate but variable mutagenic response using the rodent phosphatidylinositol glycan‐class A (Pig‐a) assay. Together with the rodent bioassay data and occurrences of therapy‐related tumors noted above, the weight of evidence provided by in vivo data implies that PCH is a carcinogen with a genotoxic mode of action that clearly involves clastogenicity, with some evidence of mutagenicity as well. Based on these findings, the mutagenic potential of PCH deserves more analysis and consideration, including an assessment of the impact of longer exposure duration, different sampling times, and a comparison of different genetic endpoints within the same experimental system.
PCH undergoes complex metabolic activation and forms intermediates that have the capacity to react with DNA. One presumably important intermediate is the methyl diazonium ion that induces O 6‐methyl‐guanine adducts (Souliotis et al. 1994; Pletsa et al. 1997). The complexity of PCH metabolism is illustrated by the fact that a free radical, a reactive aldehyde, and an arylmethyl diazonium ion have also been implicated as significant contributors to observed toxic effects (IARC 1981; Prough and Tweedie 1987; Suzuki et al. 1999). Given the reactivity of these various metabolites, the well‐documented in vivo genotoxicity of the drug is not surprising (IARC 1981). At the same time, the complex metabolism of PCH coupled with deficiencies with standard exogenous metabolic activation systems is considered responsible for the high occurrence of false negative in vitro results (reviewed in Suzuki et al. 1999). Indeed, bacterial mutagenicity data are generally negative (McCann et al. 1975; Bronzetti et al. 1979). Mutagenic effects were observed in V79 cells (Suter 1987), but the clearest effects required nonstandard metabolic activation systems. There are some reports of positive mouse lymphoma assay data with the resultant colonies being described as small, suggesting a clastogenic mode of action (Clive et al. 1988). However, Vian et al. (1993) failed to induce micronuclei in cultures of PCH‐treated primary human lymphocytes, with or without rat liver S9. Thus, PCH represents an example where the genotoxic potential is best evaluated in vivo.
There is growing interest in integrating various testing approaches to significantly improve the manner in which genotoxicity testing is accomplished and reducing the number of animals required for testing. These integrated approaches provide a mechanism to precisely quantify different genotoxic endpoints within the same experimental design and identify which endpoints are most relevant to adverse effects in humans. We therefore considered PCH to be an interesting test case for evaluating the merits of an integrated study design that would allow us to comprehensively assess hematopoietic cell genotoxicity, both for chromosomal damage and gene mutation potential. The treatment period consisted of 28 consecutive days of exposure, and evaluation of chromosomal damage was accomplished by measuring micronucleus frequencies in both immature and mature peripheral blood erythrocytes (MacGregor et al. 1980). We used the MutaMouse transgenic mouse model that harbor ~29 tandem copies of a recombinant λgt10 phage vector containing a mutation‐reporting Escherichia coli lacZ gene on each copy of chromosome 3 (Shwed et al. 2010) and facilitated assessments of mutations in both the lacZ transgene (Gingerich et al. 2014) and the endogenous Pig‐a gene (Gollapudi et al. 2015). We quantified mutations arising in these two reporter genes at two time points: (1) 3 days from the end of the last treatment as recommended in the Organisation of Economic Co‐operation and Development (OECD) test guideline 488 (OECD 2013); and (2) 70 days after cessation of treatment to evaluate effects in long‐lived progenitor cells. The results are discussed in terms of the high information content provided by this multiple endpoint study design, including comparison of mutation frequencies at two gene loci, one endogenous and one transgenic, and chromosomal damage.
MATERIALS AND METHODS
Reagents and Other Supplies
PCH (CAS no. 36670‐1; purity ≥98%) was purchased from Sigma‐Aldrich, Oakville, ON, Canada. Lympholyte®‐Mammal cell separation reagent was purchased from CedarLane, Burlington, NC. Anti‐PE MicroBeads, LS Columns, and a QuadroMACS™ separator were from Miltenyi Biotec, Bergisch Gladbach, Germany. CountBright™ absolute count beads and fetal bovine serum (FBS) were purchased from Invitrogen, Carlsbad, CA. Anticoagulant solution, buffered salt solution, nucleic acid dye solution (contains SYTO® 13), anti‐CD24‐PE, and anti‐CD61‐PE were from Mouse Blood In Vivo MutaFlow® Kits (Litron Laboratories, Rochester, NY). Hank's balanced salt solution (HBSS) was purchased from MediaTech, Herndon, VA. Reagents used for flow cytometric micronucleus scoring (anticoagulant solution, buffered salt solution, stock propidium iodide solution, anti‐CD71‐FITC, and anti‐CD61‐PE solutions, stock RNase solution, and malaria biostandards) were from In Vivo Mouse MicroFlow® Kits (Litron Laboratories).
For the lacZ assay, phenyl‐beta‐D‐galactopyranoside (P‐Gal) was purchased from G‐Biosciences, St Louis, MO; proteinase K was from Invitrogen, Burlington, ON, Canada; packaging extract kits were from Agilent Technologies, Mississauga, ON, Canada; all other chemicals were purchased from Sigma‐Aldrich.
Animals, Treatments, Blood Harvests
Experiments were conducted with the oversight of the Health Canada Ottawa Animal Care Committee, which approved all animal procedures. Male MutaMouse rodents were obtained from a colony maintained at Health Canada. Mice were allowed to acclimate for approximately 10 days, and their age at the start of the treatment was between 10 and 12 weeks. Pretreatment blood samples were not collected prior to study initiation. Water and food were available ad libitum throughout the acclimation and experimental periods. PCH was prepared in phosphate buffered saline (PBS) on each treatment day and was administered via oral gavage in a volume of 0.003 mL/kg body weight/administration. Dose levels were 0, 6.25, 12.5, or 25 mg/kg/day and exposure occurred on study Days 1 through 28 (n = 4 for controls and 8 per treatment group per time point). The top dose level used in the main study was based on a pilot dose range‐finding study that demonstrated that a dose of 50 mg/kg/day resulted in a body weight loss that approached what would be considered excessive toxicity and grossly affected testis weight (this aspect will be reported separately, manuscript in progress).
For the micronucleus assay, peripheral blood was collected 2 days after the end of the exposure period (referred to hereafter as 28 + 2d) from the same groups of animals euthanized the next day (i.e., 28 + 3d) for the lacZ and Pig‐a assays. Approximately 60 μL of peripheral blood was collected from the facial vein and immediately combined with 350 μL of anticoagulant from the MicroFlowBASIC Kit (Rodent Fixed Blood; Litron Laboratories, Rochester, NY). Following MicroFlowBASIC Kit instructions, anticoagulated blood samples were fixed with ice‐cold methanol and stored at −80°C. After 5 days, fixed blood samples were centrifuged, rinsed, and transferred to a long‐term storage solution. Coded specimens were shipped to Litron for analysis of micronucleated cell frequency as described below.
Peripheral blood and bone marrow for the Pig‐a and lacZ assays, respectively, were collected at 28 + 3d and 70 days (28 + 70d) after cessation of treatment. At each time point, animals were euthanized by cardiac puncture under isoflurane anesthesia. The femurs were removed and the bone marrow was flushed out in 1 mL of PBS, pelleted via brief centrifugation, resuspended in 100 μL of PBS and flash frozen in liquid nitrogen, and finally stored at −80°C. Following blood collection via cardiac puncture, 400 μL of blood was immediately transferred to a 0.5 mL K2‐EDTA‐coated microtainer obtained from Litron and maintained at 4°C until being placed in an ExactPak shipping container and shipped on ice overnight to Litron for analysis of Pig‐a mutant cell frequencies as described below.
Micronucleated Reticulocytes: Sample Preparation, Data Acquisition
The frequency of reticulocytes (%RET), micronucleated immature, and mature (normochromatic) erythrocytes (MN‐RET and MN‐NCE, respectively) were determined for coded blood samples collected at the 28 + 2d time point. To prepare samples for flow cytometric analysis, blood was washed out of methanol fixative and incubated with antibodies and other reagents as specified in the In Vivo Mouse MicroFlow Kit manual. This methodology has been described in detail elsewhere (Dertinger et al. 2004). Kit‐supplied malaria‐infected erythrocytes served as biological standards and guided instrument settings on each day of analysis (Tometsko et al. 1993). Micronucleus frequencies were determined upon the acquisition of 20,000 CD71‐positive reticulocytes (RET) per blood sample. A BD FACSCalibur flow cytometer running CellQuest Pro v5.2 was used for these analyses.
LacZ Mutation: Sample Preparation, Data Acquisition
LacZ mutant frequencies were determined on coded bone marrow samples collected at 28 + 3d and 28 + 70d. Bone marrow total genomic DNA was extracted according to Gingerich et al. (2014). Briefly, bone marrow was thawed, then 50 μL was digested in 5 mL lysis buffer (10 mM EDTA, 100 mM NaCl, 10 mM Tris–HCl, pH 7.6, 1% sodium dodecyl sulfate [w/v] and 1 mg/mL Proteinase K [Invitrogen, Burlington, Canada]), and incubated at 37°C overnight with gentle shaking. Genomic DNA was extracted using phenol/chloroform extraction procedure and was then stored at 4°C in 90 μL TE buffer (10 mM Tris pH 7.6, 0.1 mM EDTA).
The P‐Gal positive selection assay was used for determining lacZ mutant frequency in DNA samples as previously described (Gingerich et al. 2014). The recombinant λgt10 phage vector was transfected from genomic DNA using Packaging Extract kits then mixed with the host bacterium (Escherichia coli lacZ −/galE −), plated on medium containing 0.3% (w/v) P‐Gal and incubated overnight at 37°C. Mutant frequency was calculated as the ratio of mutant plaque forming units (pfu) to total pfu. The DNA from two mice (a control and one middle dose at 28 + 3d) did not pack well and produced no colonies; while two mice (one from the low dose and one from the middle dose) had to be euthanized before tissue collection at 28 + 70d because of rectal prolapse.
Pig‐a Mutation: Sample Preparation, Data Acquisition
Pig‐a mutant phenotype cell frequencies were determined on coded blood samples collected at 28 + 3d and 28 + 70d. Methods for processing mouse blood for Pig‐a measurements have been described (Labash et al. 2016). As with previous reports, the frequency of mutant phenotype reticulocytes (RETCD24‐) as well as the frequency of mutant phenotype erythrocytes (RBCCD24‐) was determined for each sample. An Instrument Calibration Standard was generated on each day data acquisition occurred. These samples contained a high prevalence of mutant‐mimic cells and provided a means to define the location of GPI anchor‐deficient erythrocytes (Phonethepswath et al. 2010). A BD FACSCanto II flow cytometer running FACSDiva v6.1.1 was used for the Pig‐a analyses.
Calculations, Statistical Analyses
The incidence of MN‐RET, MN‐NCE, and RET are expressed as frequency percent. The formulas used to calculate RETCD24‐ and RBCCD24‐ frequencies based on pre‐ and post‐immunomagnetic column data are described by Dertinger et al. (2012) and the MutaFlow manual (www.litronlabs.com).
To evaluate the effect that PCH treatment may have had on %MN‐RET, %MN‐NCE, %RET, and RBCCD24‐ and RETCD24‐ frequencies relative to concurrent vehicle control mice, Dunnett's multiple comparison t‐tests were performed using JMP software's one‐way ANOVA platform (v12.0.1, SAS Institute, Cary, NC). With the exception of the %RET endpoint, each test was performed at the 5% level using a one‐tailed test to identify significant increases relative to vehicle control. In the case of %RET, the tests were two‐tailed in order to determine whether a significant treatment‐related increase or decrease occurred. Also, note that as similar frequencies were observed for vehicle control mice across every endpoint and both time points, we pooled these data to achieve a larger negative control group size.
Prior to performing the parametric tests described above, Levene's tests were used to verify the equality of variances in the samples (P > 0.05; JMP's ANOVA platform). The following transformations were applied to fulfill this requirement: %MN‐RET and %MN‐NCE values were cube root transformed; and RBCCD24‐, RETCD24‐, and lacZ mutation frequencies were log10 transformed.
Pearson correlation coefficients were calculated for lacZ and Pig‐a mean mutant frequencies at the 28 + 3d and 28 + 70d time points (Microsoft Excel for Mac 2008, v12.3.6, Microsoft, Redmond, WA). This was done for both RBCCD24‐ vs. lacZ mutant frequencies, and RETCD24‐ vs. lacZ mutant frequencies.
RESULTS
We evaluated the induction of MN, Pig‐a, and lacZ mutations in the hematopoietic system of MutaMouse males at different time points after cessation of a 28‐day exposure to PCH. No significant reduction in body weight was observed at the end of the 4 weeks of exposure, or at the later time point (data not shown).
%RET were measured at 28 + 2d in conjunction with MN‐RET analyses. Slightly elevated %RET were observed, with a statistically significant increase evident for the high dose group (Fig. 1A). Higher %RET values that occur several days after cessation of treatment are generally indicative of treatment‐induced bone marrow toxicity, with a consequent period of enhanced erythropoiesis activity upon cessation of treatment (Dertinger et al. 2012). Robust, dose‐related MN induction was also observed for PCH‐exposed mice. Both MN‐RET and MN‐NCE frequencies exhibited statistically significant increases (P < 0.05), even at the low and middle dose levels that were not observed to appreciably affect erythropoiesis (Fig. 1B,C). For the high dose group, MN‐RET, and MN‐NCE frequencies exhibited mean fold increases of 9.1x and 6.8x, respectively.
Figure 1.
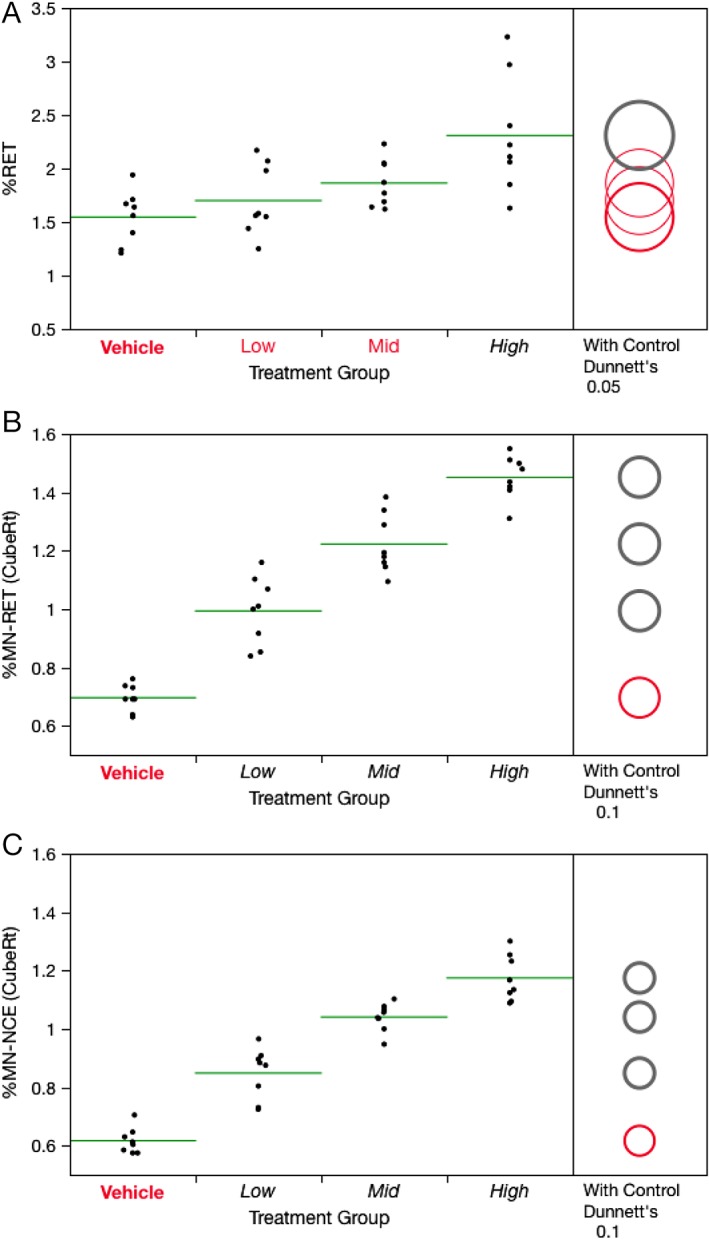
Frequency of Day 28 + 2d blood reticulocytes (A), micronucleated immature erythrocytes (B), and micronucleated mature erythrocytes (C) for each of four PCH treatment groups, where Low = 6.25, Mid = 12.5, and High = 25 mg/kg/day. Data for individual mice are shown, and group means appear as horizontal green lines. Dunnett's test results are shown to the far right of each graph, where statistically significant differences relative to the concurrent vehicle control group appear as italicized black text as opposed to red text, and by a gray circle as opposed to a red circle. Circles' diameters represent 95% confidence intervals (A) or 90% confidence intervals (B and C).
As shown by Figure 2A, treatment with PCH for 28 consecutive days caused dose‐related increases in lacZ mutant frequencies at 28 + 3d with significant fold increases of 2.0‐, 3.5‐, and 6.8‐fold at the low, medium, and high doses (P < 0.05 for all doses), respectively. These effects were sustained at 28 + 70d, with fold increases of 1.6‐, 2.5‐, and 5.0‐ at the low, medium, and high dose (P < 0.05; Fig. 2B). Although the latter harvest time exhibited modestly lower mean PCH‐induced mutant frequencies, and within group variation was more pronounced, these results indicate that PCH induced mutagenicity in long‐lived bone marrow progenitor cells. Mean lacZ frequencies for each treatment condition and time point are provided in Supporting Information Table S1.
Figure 2.
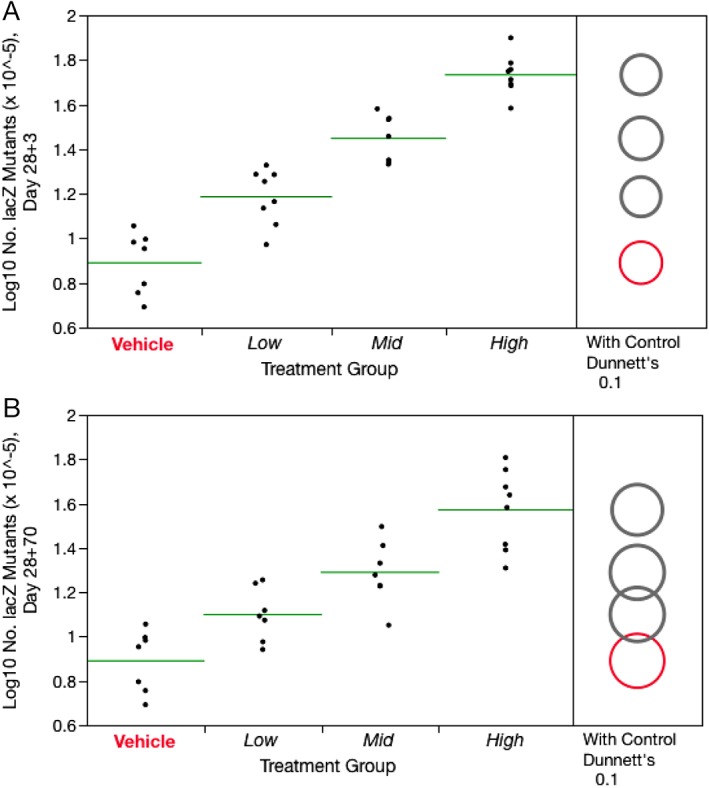
Frequency of Day 28 + 3d lacZ mutations (A) and Day 28 + 70d lacZ mutations (B) for each of four PCH treatment groups, where Low = 6.25, Mid = 12.5, and High = 25 mg/kg/day. Data for individual mice are shown, and group means appear as horizontal green lines. Dunnett's test results are shown to the far right of each graph, where statistically significant differences relative to the concurrent vehicle control group appear as italicized black text as opposed to red text, and by a gray circle as opposed to a red circle. Circles' diameters represent 90% confidence intervals.
RETCD24‐ frequencies were significantly increased in PCH‐treated mice on days 28 + 3d and 28 + 70d (Fig. 3A,C). RETCD24‐ responses were more variable at the later time point. As with the lacZ results, the fact that elevated RETCD24‐ frequencies were observed at the late time point suggests that some portion of the mutated cells arose from long‐lived progenitors with extended self‐renewal capacity. RBCCD24‐ frequencies also showed responses to PCH exposure, with statistically significant increases observed in all PCH treatment groups and at both time points (Fig. 3B,D). Note that the increase observed in the low dose group at 28 + 70d must be qualified to some extent because statistical significance is lost when the animal with the highest mutant frequency is removed. Even so, the result is not likely a scoring artifact as this animal also had the highest mutant RET value among the animals in the same group. The raw Pig‐a data and calculated frequencies, on a per mouse basis, are posted at the Pig‐a In Vivo Gene Mutation Assay Database, http://www.pharmacy.umaryland.edu/centers/cersi-files.
Figure 3.
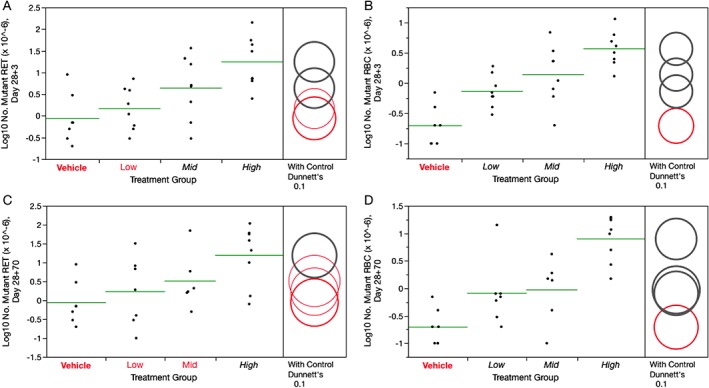
Frequency of 28 + 3d Pig‐a mutant reticulocytes (A) and Pig‐a mutant erythrocytes (B), as well as 28 + 70d Pig‐a mutant reticulocytes (C) and Pig‐a mutant erythrocytes (D) for each of four PCH treatment groups, where Low = 6.25, Mid = 12.5, and High = 25 mg/kg/day. Data for individual mice are shown, and group means appear as horizontal green lines. Dunnett's test results are shown to the far right of each graph, where statistically significant differences relative to the concurrent vehicle control group appear as italicized black text as opposed to red text, and by a gray circle as opposed to a red circle. Circles' diameters represent 90% confidence intervals.
Pearson correlation coefficients were derived for comparisons across the two mutation assays. At 28 + 3d, mean RETCD24‐ and RBCCD24‐ vs. lacZ frequencies showed particularly high correlations, with R2 values of 0.956 and 0.999, respectively (P < 0.05, Fig. 4A,B). At 28 + 70d, mean RETCD24‐ were also in good agreement with lacZ (R2 = 0.996, P < 0.05, Figure 4C), while the RBCCD24‐ correlation was slightly lower (R2 = 0.902, P < 0.05, Figure 4D).
Figure 4.
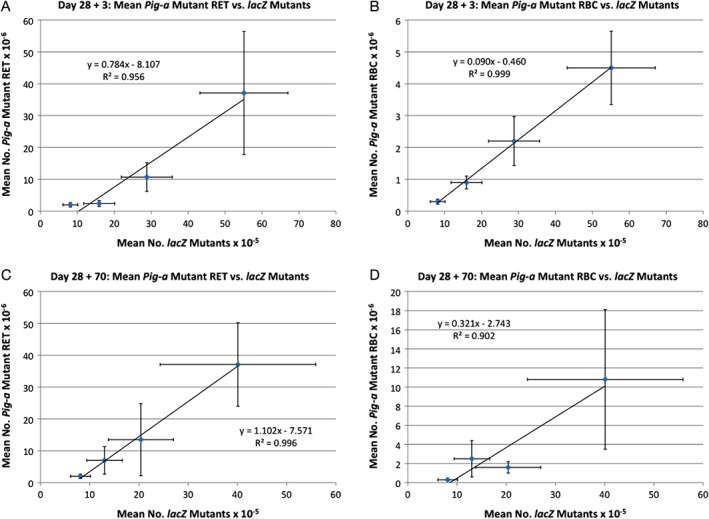
The mean frequency of Pig‐a mutant cells are graphed against the mean frequency of lacZ mutation for each of four dose groups and each of two time points, with Pearson correlation coefficients provided by an R2 value. Error bars represent one standard deviation. A = 28 + 3d results, where Pig‐a mutants are reticulocytes; B = 28 + 3d results, Pig‐a mutants are erythrocytes; C = 28 + 70d results, Pig‐a mutants are reticulocytes; and D = 28 + 70d results, Pig‐a mutants are erythrocytes.
DISCUSSION
There is currently considerable pressure to transition the practice of toxicology toward computational and in vitro methodologies (Dix et al. 2007; Collins et al. 2008; Kavlock et al. 2009). In light of this, and given its predominately negative in vitro DNA‐damage profile, PCH made an interesting case study for evaluating multiple in vivo endpoints of genotoxicity—lacZ and Pig‐a mutation, and chromosomal damage in the form of MN. By concentrating on bone marrow and blood‐based assays, we focused on the hemotopoietic compartment and the notable hematological secondary cancers that have been described for PCH exposure (Levine and Bloomfield 1992). Furthermore, by using an experimental design that facilitated assessment of all three assays, this PCH study was performed in a manner that addresses resource and animal‐usage concerns that are in part driving the transition noted above.
In this study, PCH's in vivo genotoxic activity was readily apparent, as each of the endpoints investigated showed statistically significant effects at all of the doses tested. As also found by Suzuki et al. (1999), we observed potent clastogenic activity as evidenced by robust MN induction. Whereas Suzuki and colleagues failed to detect significant increases in in vivo lacZ mutations in bone marrow, liver, testis, spleen, kidney, and lung upon single administration of 50 mg PCH/kg, they did observe significant lacZ mutation induction at 150 mg/kg/day when administered for five consecutive days (cumulative dose: 750 mg/kg) particularly in those tissues that are prone to develop tumors following PCH exposure (i.e., lung, bone marrow, and spleen). In our experiments, we demonstrated that a strong mutagenic response in the bone marrow is occurring at much lower doses, as even at the lowest PCH dose studied (6.25 mg/kg/day, or a cumulative dose of 175 mg/kg) resulted in significant induction of bone marrow lacZ and blood Pig‐a mutation. These results show that PCH elicits a robust mutagenic response in the bone marrow even at doses that do not produce cytotoxicity. While Phonethepswath et al. (2013) also reported PCH‐induced Pig‐a mutation in mice, it is not productive comparing those results with data reported herein because the previous study utilized an early mouse blood labeling protocol that is now understood to systematically underestimate mutant cell frequency (Labash et al. 2016). Finally, Chen et al. (2019) recently reported strong induction of Pig‐a mutations following a 28‐day exposure regimen in rats using daily doses higher than those used here. Thus, in addition to its well‐known clastogenic activity, PCH is also an effective in vivo mutagen when recommended OECD test guideline experimental design considerations are followed.
One of the objectives of our study was to compare the mutagenic response observed with two reporter genes that are routinely used for assessing chemical mutagenesis. We found a very strong correlation (R2 ≥ 0.956) between lacZ mutant frequencies in bone marrow and Pig‐a mutant RET and RBC at the early time point (i.e., 28 + 3d). At the later time point (i.e., 28 + 70d), the correlation between the two assays was still very strong (R2 = 0.996) when comparing lacZ mutant frequencies with Pig‐a mutant RET. The correlation was slightly lower between mutant lacZ bone marrow cells and Pig‐a mutant RBC (R2 = 0.902), a result that reinforces expert recommendations to study both RET and RBC cohorts for Pig‐a mutation (Gollapudi et al. 2015). Overall, our mutation results are in agreement with those reported by Lemieux and collaborators (Lemieux et al. 2011) who observed a significant, and comparable, dose‐related increase in mutant cells with the Pig‐a and lacZ assays following exposure of MutaMouse males to benzo[a]pyrene, a strong mutagen that acts through a completely different mode of action compared to PCH. These results support the notion that both assays have a broad applicability domain and that they both are effective methods for evaluating gene mutation events.
The use of both gene mutation assays in an integrated test design represents a convenient means to address limitations that are generally ascribed to the two assays when used in isolation. The lacZ mutation assay is a well‐validated and regulatory‐accepted assay with an adopted OECD guideline that can be used for assessing mutagenicity in any tissue. A potential limitation of the assay is that it uses a bacterial gene that is highly methylated and not transcribed, and thus may not be fully representative of the susceptibility of endogenous genes to mutation induction (Lambert et al. 2005). It is also detecting almost exclusively point mutations (Beal et al. 2015). On the other hand, the Pig‐a gene is an endogenous gene and its inactivation can occur through a variety of mutational events including those that would not be detected by the lacZ assay. However, the Pig‐a assay can currently only be conducted in erythropoietic cells and it is challenging to sequence presumed mutant cells to characterize the types of lesions responsible for the mutant phenotype. It should also be noted that an OECD test guideline for the Pig‐a assay is currently under development, and the results reported herein add further support to these validation efforts.
In summary, our data agree with previous studies that found PCH exerts potent clastogenic activity. Furthermore, detection of its mutagenic potential is also readily observed when more careful analysis, particularly in terms of dosing protocol and harvest times, are followed. The advantage of combining the lacZ, Pig‐a, and MN endpoints is that it allows for a comprehensive assessment of multiple types of DNA lesions, a particularly important aspect when studying new chemical classes and/or when complex metabolism makes choosing a single in vivo genotoxicity endpoint difficult to choose a priori. By coupling the gene mutation assessments with MN analyses, it becomes possible to efficiently detect a chemical's mutagenic and chromosome damaging potential. Thus, when systemic exposure of a chemical and its reactive intermediate(s) can be verified, this approach represents an efficient and cost‐effective means of obtaining valuable safety data that includes mode of action information that has not traditionally been collected due to technical and cost considerations.
AUTHOR CONTRIBUTIONS
F.M., C.Y., S.D. and C.M. designed these studies. F.M. and C.Y. secured funding for the study. C.M. executed the lacZ analyses, and prepared coded blood samples for shipment to Litron. C.M. and S.D.D. performed statistical analyses, and all of the authors contributed to data interpretation and writing the manuscript.
DISCLOSURE
S.D.D is an employee of Litron Laboratories. Litron holds patents covering flow cytometric methods for scoring micronucleated erythrocytes and sells kits based on this technology (In Vivo MicroFlow®); Litron hold patents for scoring GPI anchor‐deficient erythrocytes and sells kits based on this technology (In Vivo MutaFlow®).
Supporting information
Supplemental TABLE 1 LacZ mutant frequencies (MFs) in the bone marrow of MutaMouse males, 3 and 70 days after the end of a 28‐day exposure to procarbazine.
ACKNOWLEDGMENTS
Excellent benchtop work provided by Dorothea Torous, Svetlana Avlasevich, and Carson Labash is greatly appreciated. This research was funded through Health Canada's Chemicals Management Plan. C.M. was funded through the Natural Sciences and Engineering Research Council of Canada's Visiting Fellowships in a Government Laboratory Program. We are grateful to Karine Chamberland, Julie Todd, Kevin Little, Scott Smith, Julie Cox, Drs. Martha Navarro, Marc Beal, Matthew Meier, Alexandra Long, and Richard Webster for assistance with animal study and necropsy.
Reproduced with the permission of the Minister of Environmental Health Science and Research Bureau
REFERENCES
- Armand JP, Ribrag V, Harrousseau JL, Abrey L. 2007. Reappraisal of the use of procarbazine in the treatment of lymphomas and brain tumors. Ther Clin Risk Manag 3(2):213–224. [DOI] [PMC free article] [PubMed] [Google Scholar]
- Beal MA, Gagne R, Williams A, Marchetti F, Yauk CL. 2015. Characterizing Benzo[a]pyrene‐induced lacZ mutation spectrum in transgenic mice using next‐generation sequencing. BMC Genomics 16:812. [DOI] [PMC free article] [PubMed] [Google Scholar]
- Bronzetti G, Zeiger E, Malling HV. 1979. Genetic toxicity of procarbazine in bacteria and yeast. Mutat Res 68(1):51–58. [DOI] [PubMed] [Google Scholar]
- Chen G, Wen H, Mao Z, Song J, Jiang H, Wang W, Yang Y, Miao Y, Wang C, Huang Z, Wang X. 2019. Assessment of the pig‐a, micronucleus, and comet assay endpoints in rats treated by acute or repeated dosing protocols with procarbazine hydrochloride and ethyl carbamate. Environ Mol Mutagen 60(1):56–71. [DOI] [PubMed] [Google Scholar]
- Clive D, Turner N, Krehl R. 1988. Procarbazine is a potent mutagen at the heterozygous thymidine kinase (tk +/−) locus of mouse lymphoma assay. Mutagenesis 3(2):83–87. [DOI] [PubMed] [Google Scholar]
- Collins JE, Ellis PC, White AT, Booth AE, Moore CE, Burman M, Rees RW, Lynch AM. 2008. Evaluation of the Litron in vitro microflow kit for the flow cytometric enumeration of micronuclei (MN) in mammalian cells. Mutat Res 654(1):76–81. [DOI] [PubMed] [Google Scholar]
- Dertinger SD, Camphausen K, Macgregor JT, Bishop ME, Torous DK, Avlasevich S, Cairns S, Tometsko CR, Menard C, Muanza T, Chen Y, Miller RK, Cederbrant K, Sandelin K, Ponten I, Bolcsfoldi G. 2004. Three‐color labeling method for flow cytometric measurement of cytogenetic damage in rodent and human blood. Environ Mol Mutagen 44(5):427–435. [DOI] [PubMed] [Google Scholar]
- Dertinger SD, Phonethepswath S, Avlasevich SL, Torous DK, Mereness J, Bryce SM, Bemis JC, Bell S, Weller P, Macgregor JT. 2012. Efficient monitoring of in vivo pig‐a gene mutation and chromosomal damage: summary of 7 published studies and results from 11 new reference compounds. Toxicol Sci 130(2):328–348. [DOI] [PMC free article] [PubMed] [Google Scholar]
- Dix DJ, Houck KA, Martin MT, Richard AM, Setzer RW, Kavlock RJ. 2007. The ToxCast program for prioritizing toxicity testing of environmental chemicals. Toxicol Sci 95(1):5–12. [DOI] [PubMed] [Google Scholar]
- Gingerich JD, Soper L, Lemieux CL, Marchetti F, Douglas GR. 2014. In: Sierra LM, Gaivao I, editors. Transgenic Rodent Gene Mutation Assay in Somatic Tissues. New York: Springer Science+Business Media. [Google Scholar]
- Gollapudi BB, Lynch AM, Heflich RH, Dertinger SD, Dobrovolsky VN, Froetschl R, Horibata K, Kenyon MO, Kimoto T, Lovell DP, Stankowski LF Jr, White PA, Witt KL, Tanir JY. 2015. The in vivo pig‐a assay: a report of the international workshop on Genotoxicity testing (IWGT) workgroup. Mutat Res Genet Toxicol Environ Mutagen 783:23–35. [DOI] [PubMed] [Google Scholar]
- Holme JA, Soderlund EJ, Brunborg G, Hongslo JK, Trygg B, Nelson SD. 1989. Comparative genotoxicities of procarbazine and two deuterated analogs in mammalian cells in vitro and in vivo. Mutagenesis 4(5):355–360. [DOI] [PubMed] [Google Scholar]
- IARC . 1981. Some Antineoplastic and Immunosuppressive Agents, Vol. 26 Lyon, France: IARC monographs on the evaluation of the carcinogenic risk of chemicals to humans; pp. 311–339. [PubMed] [Google Scholar]
- Kaldor JM, Day NE, Hemminki K. 1988. Quantifying the carcinogenicity of antineoplastic drugs. Eur J Cancer Clin Oncol 24(4):703–711. [DOI] [PubMed] [Google Scholar]
- Kavlock RJ, Austin CP, Tice RR. 2009. Toxicity testing in the 21st century: implications for human health risk assessment. Risk Anal 29(4):485–487. discussion 492‐487. [DOI] [PMC free article] [PubMed] [Google Scholar]
- Labash C, Avlasevich SL, Carlson K, Berg A, Torous DK, Bryce SM, Bemis JC, MacGregor JT, Dertinger SD. 2016. Mouse pig‐a and micronucleus assays respond to N‐ethyl‐N‐nitrosourea, benzo[a]pyrene, and ethyl carbamate, but not pyrene or methyl carbamate. Environ Mol Mutagen 57(1):28–40. [DOI] [PubMed] [Google Scholar]
- Lambert IB, Singer TM, Boucher SE, Douglas GR. 2005. Detailed review of transgenic rodent mutation assays. Mutat Res 590(1–3):1–280. [DOI] [PubMed] [Google Scholar]
- Lemieux CL, Douglas GR, Gingerich J, Phonethepswath S, Torous DK, Dertinger SD, Phillips DH, Arlt VM, White PA. 2011. Simultaneous measurement of benzo[a]pyrene‐induced pig‐a and lacZ mutations, micronuclei and DNA adducts in muta mouse. Environ Mol Mutagen 52(9):756–765. [DOI] [PMC free article] [PubMed] [Google Scholar]
- Levine EG, Bloomfield CD. 1992. Leukemias and myelodysplastic syndromes secondary to drug, radiation, and environmental exposure. Semin Oncol 19(1):47–84. [PubMed] [Google Scholar]
- MacGregor JT, Wehr CM, Gould DH. 1980. Clastogen‐induced micronuclei in peripheral blood erythrocytes: the basis of an improved micronucleus test. Environ Mutagen 2(4):509–514. [DOI] [PubMed] [Google Scholar]
- McCann J, Choi E, Yamasaki E, Ames BN. 1975. Detection of carcinogens as mutagens in the salmonella/microsome test: assay of 300 chemicals. Proc Natl Acad Sci U S A 72(12):5135–5139. [DOI] [PMC free article] [PubMed] [Google Scholar]
- OECD . 2013. Test 488: Transgenic Rodent Somatic and Germ Cells Gene Mutation Assays. Paris: OECD Publishing. [Google Scholar]
- Phonethepswath S, Avlasevich SL, Torous DK, Mereness J, Bemis JC, Macgregor JT, Dertinger SD. 2013. Flow cytometric analysis of pig‐a gene mutation and chromosomal damage induced by procarbazine hydrochloride in CD‐1 mice. Environ Mol Mutagen 54(4):294–298. [DOI] [PubMed] [Google Scholar]
- Phonethepswath S, Franklin D, Torous DK, Bryce SM, Bemis JC, Raja S, Avlasevich S, Weller P, Hyrien O, Palis J, Macgregor JT, Dertinger SD. 2010. Pig‐a mutation: kinetics in rat erythrocytes following exposure to five prototypical mutagens. Toxicol Sci 114(1):59–70. [DOI] [PMC free article] [PubMed] [Google Scholar]
- Pletsa V, Valavanis C, van Delft JH, Steenwinkel MJ, Kyrtopoulos SA. 1997. DNA damage and mutagenesis induced by procarbazine in lambda lacZ transgenic mice: evidence that bone marrow mutations do not arise primarily through miscoding by O6‐methylguanine. Carcinogenesis 18(11):2191–2196. [DOI] [PubMed] [Google Scholar]
- Prough RA, Tweedie DJ. 1987. In: Powis G, Prough RA, editors. Procarbazine. London: Taylor and Francis. [Google Scholar]
- Romagna F, Schneider BM. 1990. Comparison of single/multiple‐dose protocols using triethylenemelamine and procarbazine hydrochloride for the mouse bone marrow micronucleus test. Mutat Res 234(3–4):169–178. [DOI] [PubMed] [Google Scholar]
- Sasaki YF, Saga A, Akasaka M, Ishibashi S, Yoshida K, Su YQ, Matsusaka N, Tsuda S. 1998. Organ‐specific genotoxicity of the potent rodent colon carcinogen 1,2‐dimethylhydrazine and three hydrazine derivatives: difference between intraperitoneal and oral administration. Mutat Res 415(1–2):1–12. [DOI] [PubMed] [Google Scholar]
- Shwed PS, Crosthwait J, Douglas GR, Seligy VL. 2010. Characterisation of MutaMouse lambdagt10‐lacZ transgene: evidence for in vivo rearrangements. Mutagenesis 25(6):609–616. [DOI] [PMC free article] [PubMed] [Google Scholar]
- Souliotis VL, Valavanis C, Boussiotis VA, Pangalis GA, Kyrtopoulos SA. 1994. Comparative dosimetry of O6‐methylguanine in humans and rodents treated with procarbazine. Carcinogenesis 15(8):1675–1680. [DOI] [PubMed] [Google Scholar]
- Suter W. 1987. Mutagenicity of procarbazine for V79 Chinese hamster fibroblasts in the presence of various metabolic activation systems. Mutagenesis 2(1):27–32. [DOI] [PubMed] [Google Scholar]
- Suzuki T, Uno Y, Idehara K, Baba T, Maniwa J, Ohkouchi A, Wang X, Hayashi M, Sofuni T, Tsuruoka M, Miyajima H, Kondo K. 1999. Procarbazine genotoxicity in the MutaMouse; strong clastogenicity and organ‐specific induction of lacZ mutations. Mutat Res 444(2):269–281. [DOI] [PubMed] [Google Scholar]
- Tometsko AM, Torous DK, Dertinger SD. 1993. Analysis of micronucleated cells by flow cytometry. 1. Achieving high resolution with a malaria model. Mutat Res 292(2):129–135. [DOI] [PubMed] [Google Scholar]
- Vian L, Bichet N, Gouy D. 1993. The in vitro micronucleus test on isolated human lymphocytes. Mutat Res 291(1):93–102. [DOI] [PubMed] [Google Scholar]
Associated Data
This section collects any data citations, data availability statements, or supplementary materials included in this article.
Supplementary Materials
Supplemental TABLE 1 LacZ mutant frequencies (MFs) in the bone marrow of MutaMouse males, 3 and 70 days after the end of a 28‐day exposure to procarbazine.