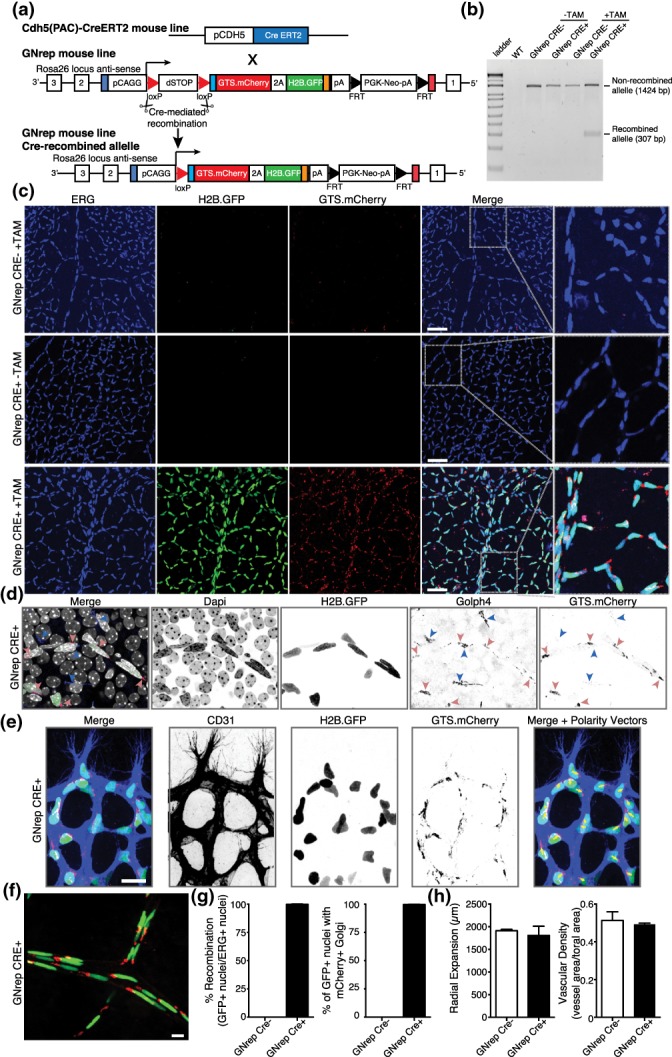
Figure 3.

Validation and characterization of the GNrep mouse line. (a) GNrep mouse line was crossed with the Cdh5(PAC)‐CreERT2 line. Tamoxifen‐mediated activation of Cre activity leads to excision of loxP‐STOP‐loxP cassette and expression of the double fluorescent reporter cassette. (b) Analysis of the Cre‐mediated excision of the LoxP‐STOP‐LoxP cassette by genomic PCR (presence of a band at 307 bp) upon tamoxifen treatment, in designated genotypes. (c) Representative images of GFP, mCherry and anti‐ERG antibody (endothelial nuclei) fluorescent signals in P8 GNrep− or GNrep+ retinas, untreated (−TAM) or treated (+TAM) with tamoxifen. GFP and mCherry can be only detected in retinas GNrep+ treated with tamoxifen. Inserts (right panel) highlight Golgi and nuclear localization of mCherry and GFP signals. Scale bar, 50 μm. (d) High‐magnification image of GFP, mCherry, anti‐Golph4 antibody (pan‐Golgi marker), and Dapi fluorescent signals from a GNrep Cre+ mouse retina highlighting the colocalization between Golph4 and mCherry signal in endothelial cells only (red arrowheads). Non‐endothelial Golgi complexes (blue arrowheads) do not express mCherry. Scale bar, 20 μm. (e) High‐magnification image of GFP, mCherry, anti‐CD31 antibody (endothelial cell membrane marker) from a P6 GNrep Cre+ mouse retina sprouting front, highlighting the polarization patterns of endothelial cells at the angiogenic vascular front (yellow arrows). Scale bar, 20 μm. (f) Representative images of GFP and mCherry fluorescent signals in P21 GNrep Cre+ retinas, after tamoxifen treatment. Scale bar, 10 μm. (g) Quantification of recombination (%) and colocalization (%) between GFP+ nuclei and mCherry+ in P8 retinas after tamoxifen injections. (h) Quantification of vascular outgrowth (μm) and vascular density between GNrep Cre− and GNrep Cre+ mice, after tamoxifen treatment. n = 3
