

Summary
Root analysis is essential for both academic and agricultural research. Despite the great advances in root phenotyping and imaging, calculating root length is still performed manually and involves considerable amounts of labor and time. To overcome these limitations, we developed MyROOT , a software for the semiautomatic quantification of root growth of seedlings growing directly on agar plates. Our method automatically determines the scale from the image of the plate, and subsequently measures the root length of the individual plants. To this aim, MyROOT combines a bottom‐up root tracking approach with a hypocotyl detection algorithm. At the same time as providing accurate root measurements, MyROOT also significantly minimizes the user intervention required during the process. Using Arabidopsis, we tested MyROOT with seedlings from different growth stages and experimental conditions. When comparing the data obtained from this software with that of manual root measurements, we found a high correlation between both methods (R 2 = 0.997). When compared with previous developed software with similar features (BRAT and EZ‐Rhizo), MyROOT offered an improved accuracy for root length measurements. Therefore, MyROOT will be of great use to the plant science community by permitting high‐throughput root length measurements while saving both labor and time.
Keywords: root length, software, root phenotyping, high‐throughput image analysis, Arabidopsis thaliana, technical advance
Significance Statement
MyROOT fills an existing gap in the root phenotyping field. This software performs a highly accurate root length measurement of seedlings growing directly on agar plates, while significantly minimizing the user intervention required during the process.
Introduction
The root, responsible for anchoring the plant to the soil, is an essential organ for overall plant growth and development. Characterization of different root traits is therefore important not only for understanding organ growth, but also for evaluating the impact of roots in agriculture (Kuijken et al., 2015). As such, generating tools for precise, high‐throughput phenotyping and imaging of roots is essential for plant research and agriculture. Phenotyping facilities, such as the ones available in the European Plant Phenotypic Network (http://www.plant-phenotyping-network.eu/), have started to implement tools for mass screening of roots.
Roots provide necessary structural and functional support for incorporation of nutrients and water from soil. In Arabidopsis thaliana (Arabidopsis), the primary root has a simplified anatomy that makes it very amenable for genetic and microscopic analysis (Dolan et al., 1993; Ishikawa and Evans, 1995; Iyer‐Pascuzzi et al., 2009). Different root cell lineages are derived from a group of stem cells located at the root apex. Here, the stem cell niche is formed by a few (three to seven) quiescent center cells that occasionally divide asymmetrically to renew themselves and to form daughter stem cells. From the root apex, these cells actively divide in the meristematic zone and, before exiting the cell cycle in the transition zone, continue to elongate and differentiate in spatially separated regions of the root. In this way, primary root growth is determined by the balance between cell division and cell elongation within the different zones of the root (van den Berg et al., 1997; Beemster and Baskin, 1998; Verbelen et al., 2006; Takatsuka and Umeda, 2014).
The most straightforward symptom of abnormal root growth or development can be identified by examining the length of the primary root in seedlings. Abnormalities in length can usually be observed and measured just 5–6 days after germination (DAG), which still reflect their embryonic origin (Jürgens et al., 1995). Growth defects in the primary root of seedlings are not only consistent with overall growth defects, but also persistent along the entire plant life cycle (Benfey et al., 1993; Potuschak et al., 2003; González‐Garcia et al., 2011). Indeed, Arabidopsis root analyses were the foundations for multiple genetic screens that ultimately led to the identification of several key regulators of plant growth and development (Benfey et al., 1993; Hauser et al., 1995; Caño‐Delgado et al., 2000; Mouchel et al., 2004; Ubeda‐Tomas et al., 2008).
Root analysis of young seedlings offers direct information regarding overall plant growth and viability. Despite important advances in plant imaging techniques such as microscopic visualization (Pfister et al., 2014; González‐Garcia et al., 2015; Lobet, 2017), the root length of seedlings growing in agar plates is generally measured by manually indicating the position of each seedling or manually tracking each root using the ImageJ software (https://imagej.nih.gov/ij/). For this reason, the development and use of methods that enable automatic and accurate analysis of a large number of roots represents a step forward for high‐throughput root analysis. Automatic analysis of root system architecture is just beginning to be implemented, and novel methods based on acquiring, processing, and obtaining quantitative data from root images are now available.
The available root softwares are designed for different purposes. Some of these are applied to crop phenotyping and are mainly focused on traits related to root architecture such as branching or biomass (Le Bot et al., 2010; Lobet et al., 2011; Nagel et al., 2012; Pound et al., 2013; Pace et al., 2014; Kuijken et al., 2015; Wu et al., 2018). Conversely, other root softwares are oriented for the analysis of plant model species as Arabidopsis (Armengaud et al., 2009; French et al., 2009; Yazdanbakhsh and Fisahn, 2012; Slovak et al., 2014). Most of these can reliably measure different root traits (primary root length, lateral roots, etc.) (Arsenault et al., 1995; Le Bot et al., 2010; Clark et al., 2013; Ristova et al., 2013; Slovak et al., 2014; Cai et al., 2015). The analysis usually requires intensive user intervention to set the optimal parameters for root detection and to identify the individual roots (Armengaud et al., 2009; French et al., 2009; Clark et al., 2013). Despite time‐consuming manual tracking of each single root, ImageJ is often used as a tool for primary root length quantification. A summary of the existing softwares for root analysis and its main features is given in Table S1.
Despite the numerous tools for root analysis, these lack the capability to precisely measure the primary root length of seedlings. This approach is key for genetic, physiological and developmental studies in the plant model Arabidopsis and is often done manually. Here, we present MyROOT, a software capable of semiautomatically calculating primary root length in a fast and user‐friendly manner, and that is able to adapt to different imaging and experimental conditions. By automatically identifying the scale and precisely detecting all individual roots and hypocotyls growing on an agar plate from a JPEG image, this software simplifies and minimizes user intervention during the calculation of root length. MyROOT merely requires the user to define the region in which the seedlings are placed on the plate, and then subsequently operates in a semiautomatic fashion. We show that MyROOT can be used both in low‐scale and high‐throughput experiments due to the incorporation of a batch‐processing option for automatic processing of several images without losing its accuracy.
As a proof of concept, MyROOT software was used for root length measurement of Arabidopsis wild‐type and brassinosteroid (BR)‐signaling mutants grown under control conditions, exogenous BR hormones treatment and for plants grown under osmotic stress conditions (Fabregas et al., 2018). MyROOT software is available at https://www.cragenomica.es/research-groups/brassinosteroid-signaling-in-plant-development.
Results
MyROOT is a software for high‐throughput analysis of root length
Most root studies begin with an overall determination of root growth as estimated by manual, laborious and time‐consuming measurements. To address this limitation, we developed a semiautomatic and non‐invasive software for the high‐throughput measurement of root length. This method is implemented in MATLAB as an automatic tool named MyROOT (Figure 1a). It is based on pictures of whole agar plates on which young seedlings are growing vertically on the surface, and implements novel algorithms capable of separately detecting the root and the hypocotyl of each individual seedling and estimating a hypocotyl curve based on the detection of some hypocotyls (Figure 1b–g).
Figure 1.
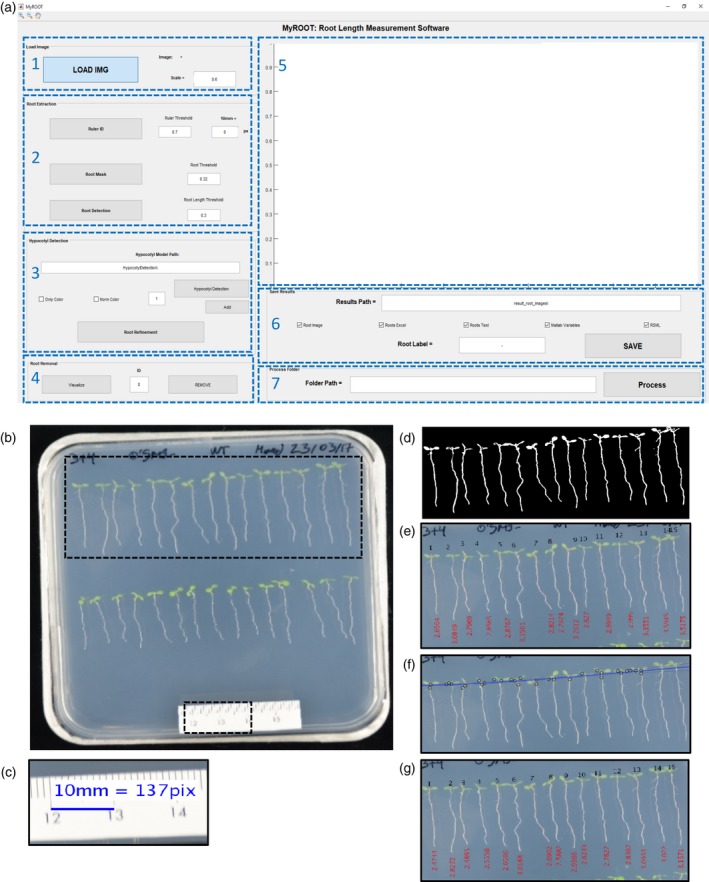
The graphical interface and steps of MyROOT.
(a) The graphical user interface of MyROOT is organized into seven sections: 1. Input image information, 2. Root extraction parameters, 3. Hypocotyl detection parameters, 4. Manual removal of roots, 5. Visualization of the image and the different detection steps, 6. Saving parameters, and 7. Batch processing (b) The input image required for analysis is a picture of the square plate in which the aligned seedlings are growing. By using information from this image, MyROOT performs the following steps: (c) Identification of the ruler to determine the scale (i.e., the equivalence between pixels and millimeters). (d) Root segmentation to identify the seedlings. (e) Root tracking to measure the roots. (f) Hypocotyl detection to identify the hypocotyls and separate them from the roots. (g) Root measurement to quantify the length of individual seedlings (i.e., the distance from the root tip to the end of the hypocotyl).
MyROOT detects and measures root length by following a series of steps (Figure 1b–g, Box 1–3 and Video S1). First, a digital image of the plate containing the growing seedlings is taken and used for the analysis (Figures 1b and S1). The image has to include a ruler (at least 1 cm long) placed on top of the plate. From the JPEG image, the software: (i) detects 1 cm of the ruler to automatically compute the scale and calculate the equivalence between pixels and millimeters (mm; Figure 1c); (ii) generates a binary mask from the manually selected area that allows for root segmentation (this separates those pixels that belong to a root from those of the background) (Figure 1d); (iii) measures the length of the roots through a root‐tracking process (Figure 1e); (iv) computes a regression curve based on the detection of the hypocotyls to identify the starting point of each root (Figure 1f); (v) measures the root length again from the root tip to the end of the hypocotyl (Figure 1g); and (vi) exports the measurements and the generated masks to a new folder. Finally, the results are saved in: (i) a Microsoft Excel spreadsheet or a .txt file in which each root is identified by an ID tag, length value and a descriptive text label introduced by the user; (ii) an image showing the detected and measured roots; (iii) MATLAB variables including the intermediate data such as hypocotyl position and the detection curve that was generated while quantifying root length and (iv) a RSML file so the images can be analyzed with other compatible softwares (Lobet et al., 2015).
Box 1. Installation guide for MyROOT software.
Execute MyAppInstaller_mcr.exe.
In the Root Analysis Installer window click the Next button.
In the Installation Options window select the folder where you wish to install the software. By default, the selected folder is C:\Program Files\La Salle – Universidad Ramon Llull\Root_Analysis.
Mark the option Add a shortcut to the desktop.
Click the Next button.
In the Required Software window select the installation folder for the MATLAB Runtime (by default C:\Program Files\MATLAB\MATLAB Runtime).
Click the Next button.
In the License Agreement window mark the option Yes.
Click the Next button.
In the Confirmation window click the Install button.
Copy the HypocotylDetection folder to the desktop (this folder is in the same folder as the .exe file used for the installation).
Open the software by clicking in the MyROOT desktop icon.
Box 2. Brief user guide for individual plates analysis using MyROOT software.
Open the software in a PC.
Select and load the image to process by pressing the LOAD IMG button. Enter an image resize factor between 0 and 1 in the Scale edit box to reduce the size of the image and speed up the processing of high‐resolution images.
Obtain the pixels‐to‐millimeters scale factor by clicking the Ruler ID button. If needed, edit the Ruler Threshold value to modify the sensitivity of the ruler detector and repeat step 3. If there is no ruler in the image, insert the correspondence between pixels and millimeters manually in the 10 mm equivalence box.
Start the root segmentation process by clicking the Root Mask button. Select the area where the roots are present by clicking in the image. Double click in one of the vertex to start generating the mask. In case the result is not satisfactory (e.g. oversegmented roots), modify the sensitivity factor in the Root Threshold edit box and repeat step 4.
Enter a value in the Root Length Threshold box to indicate the minimum percentage with respect to the longest root to be measured.
Start the root tracking and measurement process by clicking the Root Detection button.
Enter the path of the files containing the pre‐trained hypocotyl detection models in the Hypocotyl Model Path edit box.
Optionally, to perform hypocotyl detection based on color descriptors only, check the Only Color checkbox, and to conduct a channel‐wise color normalization process check the Norm Color checkbox.
Optionally, modify the threshold of the linSVM classifier by modifying the value in the edit box located next to the Hypocotyl Detection button.
Start the hypocotyl detection process by clicking the Hypocotyl Detection button.
If some of the hypocotyls were undetected, insert them manually by using the Add button. Click the Enter key and click the Root Refinement button to update root length measurements.
Remove the undesired roots from the measurement by typing the root identifier in the ID edit box and clicking the Remove button. Click the Visualize button to refresh the image presented on MyROOT's visualization canvas.
Enter the path where you would like the results to be stored in the Results Path edit box.
Choose the type of data you want to save by checking the corresponding checkboxes.
Optionally, type an identification suffix that will be appended to the stored file names via the Root Label edit box.
Save the results by clicking the SAVE button.
Box 3. Brief user guide for batch processing using MyROOT software.
Load one of the image of the folder to process and select the optimal parameters for the analysis (steps 2 to 9 in BOX 2).
Enter the path where you would like the results to be stored in the Results Path edit box.
Choose the type of data you want to save by checking the corresponding checkboxes.
Optionally, type an identification suffix that will be appended to the stored file names via the Root Label edit box.
Indicate the name of the folder with the images to process (Name\) in the Folder Path box.
Click the Process button to start the analysis.
Select if using the hypocotyl detection method by clicking in the Yes or No button in the box that appears.
One of the advantages of MyROOT is that it allows the user to supervise the different steps of the process as the results of each step are displayed before executing the following one. This feature enables the user to modify the different parameters (e.g., segmentation thresholds for ruler and root detection, and model for hypocotyl detection, etc.) at any point in the process to take into account different image conditions. Nonetheless, default parameter values have been set for satisfactory operation on a wide range of images for pre‐defined acquisition conditions (see Experimental procedures). Furthermore, the position of any hypocotyl that is not automatically detected can be manually indicated, and undesired roots can be manually removed from the results before saving. In addition, MyROOT incorporates a batch processing option for an automatic high‐throughput analysis in which the different parameters are set for the first image from a specific folder and automatically applied in the rest of these.
In summary, by determining the pixel‐millimeter equivalence and detecting seedling morphology (roots and hypocotyls) from an image of a seedling‐containing agar plate, MyROOT offers a valuable analytical tool for precisely measuring root growth in a semi‐automatic manner. As such, this software clearly provides a solution to the timely task of manually quantifying root length.
Root detection and measurement process
MyROOT has been developed for the high‐throughput, accurate, and non‐invasive measurement of root length from seedlings growing in agar plates. In this respect, the three most crucial steps are to precisely determine the scale, identify the roots, and measure their length. The scale information is obtained from a piece of measuring tape that is placed on the surface of the Petri dish. This allows the measurements to be completely independent from the specific characteristics of the image capture system. The first step for detecting the ruler is based on its color contrast with the background. By computing the vertical and horizontal profiles of the image, the algorithm is designed to explore the entire image in search of a white patch (Figure S2a). As the border of the plate has a similar color contrast with the background, a median filter is applied to reduce the border effect. The maximum values in the filtered profiles define the image area where the white patch is present. Next, the resulting area is further cropped (Figure S2b) and processed (Figure S2c–e). By applying a threshold based on Otsu's algorithm (Otsu, 1979), the black lines representing cm and mm marks are not filtered out (Figure S2b). Finally, a horizontal profile of this binary image is generated (Figure S2d) in which the pixel‐mm equivalence is defined as the difference between consecutive local maxima (Figure S2e). In case that there is not ruler tape in the image to analyze, MyROOT includes the option of manually indicating the correspondence between pixels and millimeters.
The core of the whole method is the root extraction and measurement process. To extract roots, the user must first manually define the area in which roots are present (note: only one row of seedlings should be included when defining the area). Then, with just a few mouse clicks from the user, a binary mask is generated that allows root segmentation. This later leads to the identification of individual roots through a root tracking process, and finally allows the individually identified roots to be measured (Figure 2). The root segmentation process can be divided into four main steps: (i) color normalization (Figure 2a), (ii) ridge detection (Figure 2b), (iii) root tracking (Figure 2c), and (iv) root identification (Figure 2d). During the color normalization step, the image is processed and a global working framework is set (i.e., all images going through this process become color‐balanced and have the same lower and higher white values; Figure 2a). This allows the user to manage different initial conditions (illumination, color, and saturation, etc.) while continuing with the same subsequent steps of the pipeline. In the next step, a ridge (i.e., white contrasted area) detector identifies roots based on their contrast with the background (for this, the level of whiteness is irrelevant; Figure 2b). After the detection step, a final mask is generated for tracking the roots. Due to the linear disposition of the roots in the plate, we employed a bottom‐up tracking approach. As such, tracking starts at the end point of each root and continues upward, row by row, until the hypocotyl detection curve is found (Figure 2c). Finally, the tracking of each root makes it possible to identify which pixels correspond to which root (Figure 2d).
Figure 2.
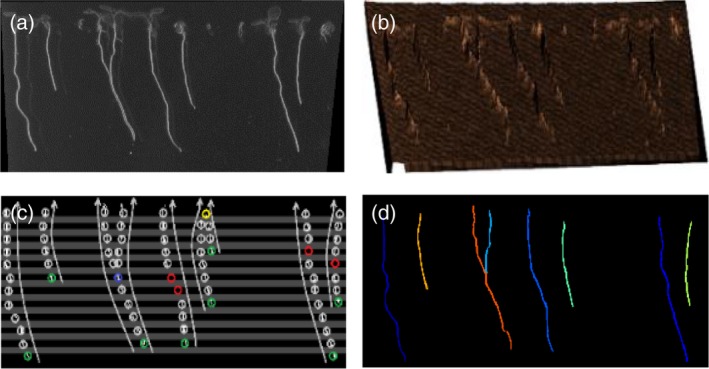
Root extraction method.
(a) Colors are normalized in the area where roots are present, and white roots are detected. (b) Segmentation is performed by applying a ridge detector. (c) Starting at the root tip, the roots are tracked using a bottom‐up approach. (d) Each root is measured using its historical recorded tracking, and root length is calculated by taking into account the pixel‐millimeter equivalence.
Once the root tracking process has been completed, each individual root is measured based on previous positions saved in the historical record. Specifically, root length is calculated in pixels by adding the distances between previous consecutive points and then applying the previously calculated pixel‐mm equivalence. Next, a refinement process is applied in which the shortest roots, which are often associated with noise, are discarded. By default, MyROOT discards any root measurement shorter than 30% of the longest one. However, this percentage can be manually chosen by the user if need be. A second filter is then applied to keep those roots that terminate close to the previously calculated hypocotyl curve. If a root surpasses the hypocotyl curve, it is cut at this level. Finally, unique numeric identifiers (ID) are assigned to all roots that are not filtered out during processing.
As two roots can be located so close to one another that they cannot be detected as individual roots, MyROOT was trained with the following characteristics: (i) when a split occurs and a current root matches more than one detection (blue circle in Figure 2c), a new root sharing the same historical record is created, and (ii) when a fusion occurs and two roots match a single detection (yellow circle in Figure 2c), the shortest root is eliminated from the root set and added as a sub‐root of the longest one; therefore indicating the root length of the primary root which is longer than the lateral roots.
To validate our software, we compared root length measurements obtained using MyROOT with manual measurements performed using ImageJ. We compared the root length values of different experiments. First, 6‐days‐old seedlings of wild type and BR‐related mutants grown in control and in osmotic stress conditions (data published in Fabregas et al. (2018), n > 600, Figure 3), and second, the same seedlings over 6 consecutive days (from three to eight DAG; n > 116). We obtained a positive correlation between the measurements with both methods (R 2 = 0.997, Pearson's r = 0.9985). These results indicated that measurements made using our software coincided with manual measurements, thereby supporting the use of MyROOT for root length analysis in seedlings in different growth stages and experimental conditions.
Figure 3.
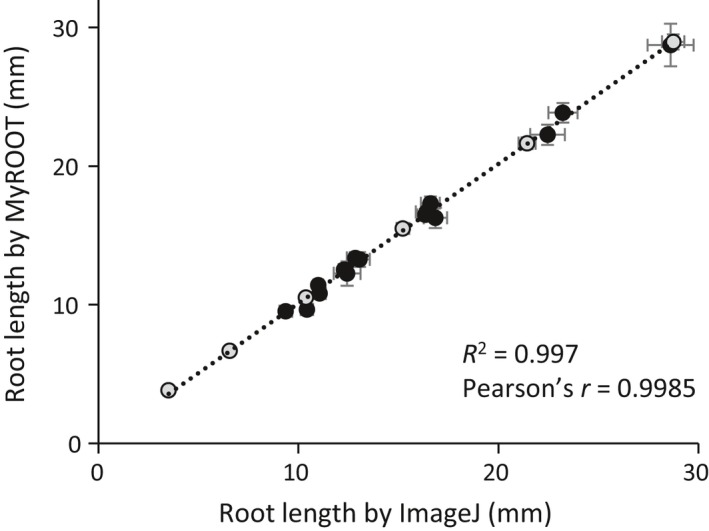
Validation of root length measurements.
Correlation of root length measurements using MyROOT (y axis) and ImageJ (x axis). Each point corresponds to a different experiment (n > 20 in each one): time course data from 3 DAG to 8 DAG seedlings (grey) and BR‐related mutants in control and osmotic stress conditions (black, Fabregas et al., 2018). Errors bars indicate the standard error. For the time course experiment, seedlings that were not measured by MyROOT in at least four time points were discarded.
We also evaluated the time required by MyROOT to determine root lengths, and compared it with the time needed for manual measurements using ImageJ, as it is widely used for the analysis of a low number of plates as a routine task in many plant biology laboratories. Importantly, we found that MyROOT reduces the time required to measure one plate by approximately half (Figure S3).
When using MyROOT for high‐throughput experiments, the analysis of a batch of images can be done automatically after setting the optimal parameters for adapting to the imaging conditions of the experiment. The time required for the analysis of one row of seedlings of different plates was evaluated. MyROOT spends approximately 1 min per image when the hypocotyl detection is not performed and 1 min more if it is performed. Importantly, this process is completely automatic and does not require the user intervention. The accuracy of the batch processing was evaluated by comparing the results of the analysis of 10 different plates using MyROOT by single upload followed by individual setting of the optimal parameters and using MyROOT for a batch analysis of all of them automatically (Figure S4). The correlation obtained between both methods was positive (R 2 = 0.996, Pearson's r = 0.9981), therefore confirming that the batch processing option can be performed without losing accuracy in the final measurements.
Hypocotyl detection
One of the main advantages of MyROOT is its ability to identify hypocotyls of growing seedlings. This characteristic is important for accurately determining the start point of each root. The hypocotyl detection process is based on visual features extracted (appearance and color) from the image. These features were used to generate a hypocotyl model by introducing 1259 hypocotyls of seedlings of different ages and characteristics and 7915 samples with background information (see Experimental procedures). The learned model is able to determine whether a given sample is a hypocotyl or not. To extract visual features, we implemented the histogram of oriented gradient (HOG) (Dalal and Triggs, 2005) method. The HOG method is based on the orientation of the contours in the image, and generates a histogram that represents the appearance/shape of the sample. For extracting color features, color distribution histograms representing the amount of color in a given sample area are used (Figure 4a). To train the model, we implemented a linear support vector machine classifier that uses appearance and color features from the hypocotyl images. This classifier generates the best hyperplane that classifies samples as positive (hypocotyls) and negative (no hypocotyls) examples. During the hypocotyl detection stage, the sliding window approach (Glumov et al., 1995) is used to perform an exhaustive search for hypocotyls. Finally, by keeping the highest scored windows as true positives, polynomial regression is used to define a curve that passes through all the detected hypocotyls. Although the user can manually insert the location of the hypocotyls, this curve enables the position of undetected hypocotyls to be estimated, and therefore corrects the curve tracing. The intersection between the hypocotyl detection curve and each root is used to define the root start point.
Figure 4.
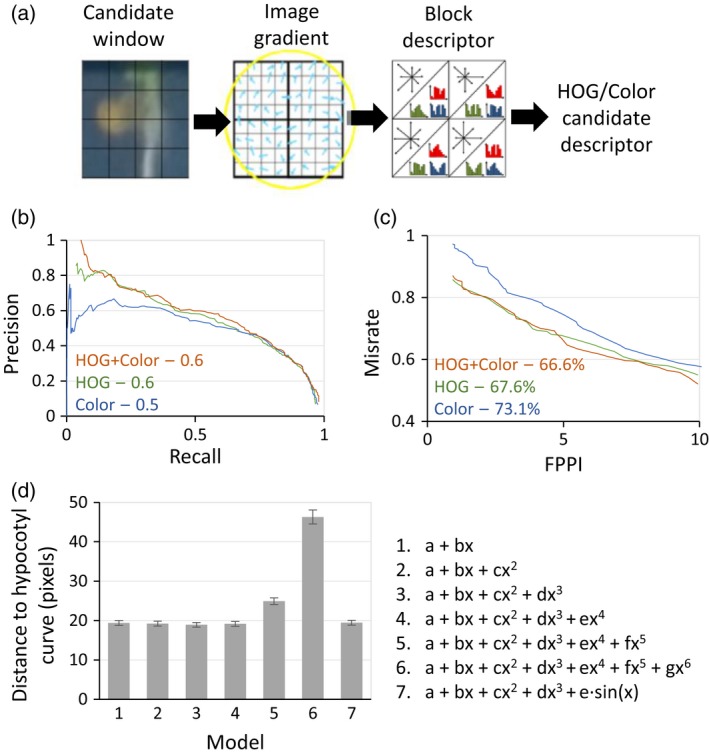
Hypocotyl detection method and validation.
(a) Scheme of the hypocotyl detection method. A candidate window is defined as a square area inside the image. To describe a candidate, appearance/shape (HOG) and color information are extracted. Appearance information is extracted to calculate the gradient of the image (i.e., the direction of the contours within the image at each pixel). Histograms of Oriented Gradient (HOG) and the histograms of color are calculated over regular spaced, non‐overlapping cells inside the candidate window (forming the block descriptor). Finally, all color/HOG cell histograms are concatenated to obtain the candidate window description. (b) Precision‐Recall curve for three different models of hypocotyl detection (HOG, Color and HOG + Color). The curve is obtained by changing the threshold that defines the frontier between positive and negative samples. For each threshold, the precision (well classified ratio) and the recall (poor classified ratio) were calculated. The area under the curve represents the robustness of the classifier, with a higher value indicating greater robustness (a higher well classified ratio to poor classified ratio over the entire range of the classifier). (c) False Positives Per Image (FPPI) curve for three different models of hypocotyl detection (HOG, Color and HOG+Color). The curve plots the miss rate against the FPPI. In this way, the average miss rate over a specific FPPI range (1–10) represents the sensitivity of the classifier to not miss good samples and keep the false positive ratio low. (d) The average distance in pixels between the real hypocotyl position and the point of intersection between the root and the polynomial regression curves, for polynomial regression curves of orders 1–6 and an extra model including a sine component. Error bars indicate the standard error.
We first evaluated our hypocotyl detection process in terms of different hypocotyl detection models. Both the precision‐recall curve (Figure 4b) and the number of false positives per image (FPPI; Figure 4c) were calculated for three different models that differ in the type of feature they use for describing hypocotyls: only color information, only appearance information (via HOG features), or both types of information (HOG + color).
Upon analyzing the precision‐recall curve of each model, we found the HOG + color model to be the most robust (Figure 4b). In the case of FPPI, the lowest miss rate was also found when using the HOG + color model (Figure 4c). These results indicated that when considering both color and appearance (i.e., the HOG + color model), a higher number of hypocotyls were identified than when using only one of the features. Therefore, this validates our MyROOT method because it incorporates both HOG and color information.
Next, we evaluated the influence of different regression curve models on the root measurement refinement used to set up the limits of individual roots (Figure 4d). To create these curves, a regression upon the detected hypocotyls was performed. To define which regression model gives the better fit, we tested different polynomial models that were evaluated in terms of the average distance (in pixels) between the real hypocotyl position and the point of intersection between the root and the regression curve (Figure 4d). The results indicated that when using a hypocotyl regression curve of order 4, a good balance between accuracy and flexibility that is able to account for small changes in hypocotyl position is reached. Therefore, we chose to employ this regression curve in our software.
The use of the hypocotyl detection method permits the fine identification of the starting point of the root (Figure 5a–d). Whereas, depending on the user judgement, this option can be skipped, therefore reducing the time of the measurement process but losing accuracy in the final root length results (Figure 5e). We compared the root length measurements of two plates, one containing seedlings with standard hypocotyls (Col‐0 wild type plants) and other with shorter hypocotyls and roots (Col‐0 wild type in osmotic stress conditions), using and skipping the hypocotyl detection step (Figure 5a–d). In both plates, when using the method, only the primary root is measured (Figure 5a, c), whereas when it is not used, some parts of the hypocotyl are measured too (Figure 5b,d). When not using the hypocotyl detection method, we only found statistically significant differences in the root length of the shorter seedlings, as the proportion of hypocotyl length measured significantly increased the overall root length measurement (Figure 5e, n > 30). These results highlighted the importance of the hypocotyl detection process for accurately measuring the root length, but also point to just using it when the experiment requires high precision.
Figure 5.
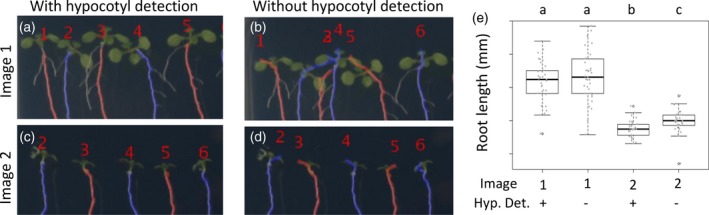
Evaluation of hypocotyl detection method for the root length measurements using MyROOT.
(a–d) Qualitative analysis of the hypocotyl detection method in two different images. (e) Root length measurement of seedling grown in two different plates (showed in (a–d)) using and not using the hypocotyl detection method. Different letters indicate statistically significant differences (P‐value <0.05; Student's t‐test, n > 30).
Comparison of MyROOT with available root softwares
The choice of software is usually based in a balance between the appropriateness of the characteristics of the software to the experimental design, the accuracy of the measurements obtained and the time required for the analysis (Table S1). We compared the accuracy and the time spent by MyROOT with BRAT and EZ‐Rhizo, the two most similar software tools, in the quantification of primary root length of two independent plates containing Arabidopsis seedlings (Figure S4 and Table S2).
We first compared the root length obtained with the three softwares with the ImageJ results. The absolute difference of mean root length between the measurements obtained with the softwares and with ImageJ show that MyROOT differs 1.39 mm and 0.22 mm for plates 1 and 2 respectively. With regard to this parameter, our results indicated the better performance of MyROOT in comparison with BRAT (15.08 mm and 1.77 mm) and to EZ‐Rhizo (2.67 mm and 2.42 mm) (Table S2).
Root detection on the plate was similar between MyROOT (> 90%) and EZ‐Rhizo (> 96%), yet MyROOT provided more accurate measurements (Figure S5 and Table S2). In addition, due to the incorporation of the hypocotyl detection method, MyROOT requires less user intervention to clearly indicate the roots, this is reflected in a reduction in the time spent for the analysis. We spent around 3 min to analyze each plate when using MyROOT, 0.5 min with BRAT and 15 min with EZ‐Rhizo (Table S2). Some seedlings on the plates analyzed had overlapping hypocotyls. We found that MyROOT was able to identify these and correctly indicate the shoot−root junction in cases with higher precision than EZ‐Rhizo and BRAT, which presented a more basic algorithm for the hypocotyl detection based only on color and shoot border curvature information, respectively. These observations highlight the utility and importance of the hypocotyl detection method incorporated in MyROOT and its capacity to identify the individual seedlings and the precise starting point of each root.
Overall, MyROOT fills a specific gap in root phenotyping by allowing a precise, fast and semi‐automatic quantification of primary root length of seedlings on a plate and a batch of plates.
Discussion
In this study, we presented MyROOT software for the quantification of plant root length. Despite the existence of other software (Table S1), MyROOT covers a gap in analysis of Arabidopsis seedling not previously addressed. The determination of root length in such accuracy is key in the study of plant growth and developmental processes, in which small root differences can lead to the identification of important genes (Benfey et al., 1993; Li et al., 2001; Mouchel et al., 2004; Rodrigues et al., 2009). We found that the implementation of primary root phenotyping algorithms in a platform using independent, semi‐automatic and user‐friendly software to accurately measure root length achieved by using MyROOT will replace the current manual and time‐consuming tools such as ImageJ.
MyROOT gives the most precise root length measurements when compared with similar software BRAT and EZ‐Rhizo (Figure S5 and Table S2). Importantly, the accuracy is maintained both in the manual and in the batch processing mode of MyROOT (Figures 3 and S4), being therefore suitable for high‐throughput experiments. Under our experimental conditions, only BRAT operates in a faster manner, whereas the final results are less accurate (Figure S5 and Table S2). This can be explained because of the limited control that BRAT offers for the adjustment of its internal parameters by the users to adapt to different imaging conditions, which may result in low root detection rates (Table S2). Conversely, MyROOT easily allows the modification of different thresholds (scale and root mask threshold and hypocotyl detection method) to define the optimal parameters for the analysis.
Another novel feature of MyROOT compared with existing softwares is the ability to automatically identify the scale by detecting a ruler over the imaged plate; therefore being able to automatically adapt to different imaging conditions and settings; and therefore being able to work independently from specific hardware set ups (Table S1).
Importantly, MyROOT is the only software that uses machine learning‐based algorithms to identify Arabidopsis hypocotyls, which allows its identification in different mutants and experimental conditions even when they are overlapped or present different morphologies. In exceptional cases in which the hypocotyls are not automatically identified, or when the software is used for the analysis of other plant species, they can be manually indicated by simply pointing over them.
In addition to the automatic processing of several images, MyROOT allows the user supervision during all the process. It displays intermediate results during the analysis and allows the modification of different parameters to get the optimal results. Despite that MyROOT only indicates the primary root length, the output is also saved in rsml software that allows its compatibility with other software that can determine other aspects of root architecture such as curvature or branching.
Overall, this article advances the utility of MyROOT for determination of Arabidopsis root length in a precise, fast and simple manner. It incorporates powerful algorithms to identify scale and seedlings over standard images of agar plates. These are incorporated in a user‐friendly graphical interface that allows supervision and manipulation during the different steps of the analysis.
Finally, MyROOT is a modularly designed software consisting of a group of specialized algorithms able to detect and analyze measuring tape, detect roots, track roots in a bottom‐up fashion and detect hypocotyls. Therefore, any improvement to any of these components, or new algorithms to determine other features, can be easily included in subsequent versions of MyROOT. Examples of future improvements that could be included are the development of daily growth‐monitoring algorithms that permit the detection of abnormal root growth patterns, analysis of root system architecture beyond the primary root, and identification of hypocotyls from other plant species. In the future, upgraded versions of our software could consist of a completely automatic operation connected to high‐throughput facilities for large‐scale characterization of root traits.
Conclusion
MyROOT is a software capable of semiautomatically measuring the length of the primary root of Arabidopsis seedlings. It automatically recognizes the scale of the image, and detects the hypocotyls and root tips from young seedlings growing vertically in agar plates. This information is then used to accurately calculate the root length of each individual plant. This software was designed in such a way that only a simple image of the plate is required for analysis. Importantly, MyROOT is even able to recognize hypocotyls of different ages and morphologies, and can therefore be applied in a large range of experiments.
Here, our validation experiments demonstrated the high precision of measurements made with MyROOT, thereby proving that this software can be used within the research community to perform high‐throughput experiments in a less time‐consuming manner.
Experimental procedures
Plant material and growth conditions
Arabidopsis thaliana Col‐0 seeds were surface sterilized with a 5‐min incubation in 1.5% sodium hypochlorite, followed by five washes in distilled sterile water. Seeds were stratified for 48 h at 4°C in the dark to synchronize germination. Seeds were sown in 12 × 12‐cm plates containing half‐strength Murashige and Skoog (½MS) medium without sucrose and supplemented with vitamins. Seeds were distributed individually in the plate in two rows with around 15 seeds per row. The plates were incubated for 3–8 days vertically oriented under long day conditions (16 h of light and 8 h of dark) at 22°C and 60% relative humidity.
Statistical analysis
The comparison between the root length measurements using MyROOT and ImageJ was evaluated by performing a regression curve and calculating the Pearson correlation coefficient. The comparison between the root length measurements using and not using the hypocotyl detection method was evaluated using Student's t‐test. This test was selected due to the unequal number of seedlings detected under each condition.
Plant Imaging and computer settings
Images were taken with a D7000 Nikon camera. The pre‐defined image acquisition conditions consist of placing the camera 50 cm above the plate with an illuminated support and the following settings: aperture 13, shutter speed 10, ISO 100 and Zoom ×35 magnification. The plates were placed face down on a black surface and with a ruler (at least 1 cm long) horizontally positioned on top (Figure S1). The images were saved in JPEG format (size between 2.5 and 2.7 MB per image). MyROOT and ImageJ were run in an Intel® Core™ i7‐6700 CPU computer.
Hypocotyl detection model
The software was trained to identify hypocotyls by using 1259 positive examples (hypocotyls) and 7915 background and negative examples (parts of the image that did not contain hypocotyls). The positive samples corresponded to Col‐0 wild‐type, bri1‐116, and a transgenic line overexpressing BRI1‐GFP, which have morphologically different hypocotyls as shown in González‐Garcia et al. (2011).
Availability of data and materials
MyROOT has been developed in MATLAB (version 8.3.0.532. Natick, Massachusetts: The MathWorks Inc., 2014). It will be made available to the plant sciences community through the Plant Image Analysis website (plant‐image‐analysis.org; Lobet et al., 2013) as a standalone executable application. The executable application together with the datasets generated during the current study (from Figures 3, 5 and S4) are available in the [Zenodo] repository, [https://doi.org/10.5281/zenodo.2552250].
Conflict of Interest
The authors declare no conflicts of interest.
Author Contributions
AIC‐D conceived the idea. AG and XS developed the algorithms for the method. AG, XS, IB‐P and DB‐E performed the validation experiments. IB‐P and DB‐E acquired the dataset. XS and AIC‐D designed and supervised the study. IB‐P, AG, XS and AIC‐D wrote the manuscript.
Supporting information
Figure S1. Laboratory setup for taking pictures of the plates.
Figure S2. The ruler identification process.
Figure S3. Evaluation of the time required to measure root length.
Figure S4. Validation of MyROOT batch analysis processing.
Figure S5. Comparison of MyROOT, BRAT and EZ‐Rhizo softwares.
Table S1. Comparison of available semi‐automatic softwares for quantification of root traits.
Table S2. Comparison of MyROOT, BRAT and EZ‐Rhizo softwares.
Video S1. Demo video of MyROOT software.
Acknowledgments
We would like to thank Caño‐Delgado Laboratory members for helping with manual root length measurements and comments on the manuscript. AIC‐D is a recipient of a BIO2016‐78150‐P grant funded by the Spanish Ministry of Economy and Competitiveness and Agencia Estatal de Investigación (MINECO/AEI) and Fondo Europeo de Desarrollo Regional (FEDER), and a European Research Council, ERC Consolidator Grant (ERC‐2015‐CoG – 683163). IB‐P is funded by the FPU15/02822 grant from the Spanish Ministry of Education, Culture and Sport. DB‐E is funded by the ERC‐2015‐CoG – 683163 granted to the AIC‐D laboratory. This project has received funding from the European Research Council (ERC) under the European Union's Horizon 2020 Research and Innovation Programme (Grant Agreement No. 683163). This work was supported by the CERCA Programme from the Generalitat de Catalunya. We acknowledge financial support from the Spanish Ministry of Economy and Competitiveness (MINECO), through the ‘Severo Ochoa Programme for Centres of Excellence in R&D’ 2016–2019 (SEV‐2015‐0533)’.
References
- Armengaud, P. , Zambaux, K. , Hills, A. , Sulpice, R. , Pattison, R.J. , Blatt, M.R. and Amtmann, A. (2009) EZ‐Rhizo: integrated software for the fast and accurate measurement of root system architecture. Plant J. 57, 945–956. [DOI] [PubMed] [Google Scholar]
- Arsenault, J. , Poulcur, S. , Messier, C. and Guay, R. (1995) Winrhizo: a root measuring system with a unique overlap correction method. HortScience, 30, 906. [Google Scholar]
- Beemster, G.T. and Baskin, T.I. (1998) Analysis of cell division and elongation underlying the developmental acceleration of root growth in Arabidopsis thaliana. Plant Physiol. 116, 1515–1526. [DOI] [PMC free article] [PubMed] [Google Scholar]
- Benfey, P.N. , Linstead, P.J. , Roberts, K. , Schiefelbein, J.W. , Hauser, M.T. and Aeschbacher, R.A. (1993) Root development in Arabidopsis: four mutants with dramatically altered root morphogenesis. Development, 119, 57–70. [DOI] [PubMed] [Google Scholar]
- van den Berg, C. , Willemsen, V. , Hendriks, G. , Weisbeek, P. and Scheres, B. (1997) Short‐range control of cell differentiation in the Arabidopsis root meristem. Nature, 390, 287–289. [DOI] [PubMed] [Google Scholar]
- Cai, J. , Zeng, Z. , Connor, J.N. , Huang, C.Y. , Melino, V. , Kumar, P. and Miklavcic, S.J. (2015) RootGraph: a graphic optimization tool for automated image analysis of plant roots. J. Exp. Bot. 66, 6551–6562. [DOI] [PMC free article] [PubMed] [Google Scholar]
- Caño‐Delgado, A.I. , Metzlaff, K. and Bevan, M.W. (2000) The eli1 mutation reveals a link between cell expansion and secondary cell wall formation in Arabidopsis thaliana. Development, 127, 3395–3405. [DOI] [PubMed] [Google Scholar]
- Clark, R.T. , Famoso, A.N. , Zhao, K. , Shaff, J.E. , Craft, E.J. , Bustamante, C.D. , McCouch, S.R. , Aneshansley, D.J. and Kochian, L.V. (2013) High‐throughput two‐dimensional root system phenotyping platform facilitates genetic analysis of root growth and development. Plant, Cell Environ. 36, 454–466. [DOI] [PubMed] [Google Scholar]
- Dalal, N. and Triggs, B. (2005) Histograms of oriented gradients for human detection. IEEE Computer Society Conference on Computer Vision and Pattern Recognition, 1, 886–893. [Google Scholar]
- Dolan, L. , Janmaat, K. , Willemsen, V. , Linstead, P. , Poethig, S. , Roberts, K. and Scheres, B. (1993) Cellular organisation of the Arabidopsis thaliana root. Development, 119, 71–84. [DOI] [PubMed] [Google Scholar]
- Fabregas, N. , Lozano‐Elena, F. , Blasco‐ Escámez, D. et al (2018) Overexpression of the vascular brassinosteroid receptor BRL3 confers drought resistance without penalizing plant growth. Nat. Commun. 9, 4680. [DOI] [PMC free article] [PubMed] [Google Scholar]
- French, A. , Ubeda‐Tomas, S. , Holman, T.J. , Bennett, M.J. and Pridmore, T. (2009) High‐throughput quantification of root growth using a novel image‐analysis tool. Plant Physiol. 150, 1784–1795. [DOI] [PMC free article] [PubMed] [Google Scholar]
- Glumov, N.I. , Kolomiyetz, E.I. and Sergeyev, V.V. (1995) Detection of objects on the image using a sliding window mode. Opt. Laser Technol. 27, 241–249. [Google Scholar]
- González‐Garcia, M.P. , Vilarrasa‐Blasi, J. , Zhiponova, M. , Divol, F. , Mora‐Garcia, S. , Russinova, E. and Caño‐Delgado, A.I. (2011) Brassinosteroids control meristem size by promoting cell cycle progression in Arabidopsis roots. Development, 138, 849–859. [DOI] [PubMed] [Google Scholar]
- González‐Garcia, M.P. , Pavelescu, I. , Canela, A. , Sevillano, X. , Leehy, K.A. , Nelson, A.D. , Ibanes, M. , Shippen, D.E. , Blasco, M.A. and Caño‐Delgado, A.I. (2015) Single‐cell telomere‐length quantification couples telomere length to meristem activity and stem cell development in Arabidopsis. Cell Rep. 11, 977–989. [DOI] [PMC free article] [PubMed] [Google Scholar]
- Hauser, M.T. , Morikami, A. and Benfey, P.N. (1995) Conditional root expansion mutants of Arabidopsis. Development, 121, 1237–1252. [DOI] [PMC free article] [PubMed] [Google Scholar]
- Ishikawa, H. and Evans, M.L. (1995) Specialized zones of development in roots. Plant Physiol. 109, 725–727. [DOI] [PMC free article] [PubMed] [Google Scholar]
- Iyer‐Pascuzzi, A. , Simpson, J. , Herrera‐Estrella, L. and Benfey, P.N. (2009) Functional genomics of root growth and development in Arabidopsis. Curr. Opin. Plant Biol. 12, 165–171. [DOI] [PMC free article] [PubMed] [Google Scholar]
- Jürgens, G. , Mayer, U. , Busch, M. , Lukowitz, W. and Laux, T. (1995) Pattern formation in the Arabidopsis embryo: a genetic perspective. Philos. Trans. R. Soc. Lond. B Biol. Sci. 350, 7. [DOI] [PubMed] [Google Scholar]
- Kuijken, R.C. , van Eeuwijk, F.A. , Marcelis, L.F. and Bouwmeester, H.J. (2015) Root phenotyping: from component trait in the lab to breeding. J. Exp. Bot. 66, 5389–5401. [DOI] [PubMed] [Google Scholar]
- Le Bot, J. , Serra, V. , Fabre, J. , Draye, X. , Adamowicz, S. and Pages, L. (2010) DART: a software to analyse root system architecture and development from captured images. Plant Soil, 326, 13. [Google Scholar]
- Li, J. , Nam, K.H. , Vafeados, D. and Chory, J. (2001) BIN2, a new brassinosteroid‐insensitive locus in Arabidopsis. Plant Physiol. 127, 14–22. [DOI] [PMC free article] [PubMed] [Google Scholar]
- Lobet, G. (2017) Image analysis in plant sciences: publish then perish. Trends Plant Sci. 22, 559–566. [DOI] [PubMed] [Google Scholar]
- Lobet, G. , Pages, L. and Draye, X. (2011) A novel image‐analysis toolbox enabling quantitative analysis of root system architecture. Plant Physiol. 157, 29–39. [DOI] [PMC free article] [PubMed] [Google Scholar]
- Lobet, G. , Draye, X. and Perilleux, C. (2013) An online database for plant image analysis software tools. Plant Methods, 9, 38. [DOI] [PMC free article] [PubMed] [Google Scholar]
- Lobet, G. , Pound, M.P. , Diener, J. et al (2015) Root system markup language: toward a unified root architecture description language. Plant Physiol. 167, 617–627. [DOI] [PMC free article] [PubMed] [Google Scholar]
- Mouchel, C.F. , Briggs, G.C. and Hardtke, C.S. (2004) Natural genetic variation in Arabidopsis identifies BREVIS RADIX, a novel regulator of cell proliferation and elongation in the root. Genes Dev. 18, 700–714. [DOI] [PMC free article] [PubMed] [Google Scholar]
- Nagel, K.A. , Putz, A. , Gilmer, F. et al (2012) GROWSCREEN‐Rhizo is a novel phenotyping robot enabling simultaneous measurements of root and shoot growth for plants grown in soil‐filled rhizotrons. Funct. Plant Biol. 39, 891–904. [DOI] [PubMed] [Google Scholar]
- Otsu, N. (1979) A threshold selection method from gray‐level histograms. IEEE Trans. Syst. Man Cybern. 9, 5. [Google Scholar]
- Pace, J. , Lee, N. , Naik, H.S. , Ganapathysubramanian, B. and Lubberstedt, T. (2014) Analysis of maize (Zea mays L.) seedling roots with the high‐throughput image analysis tool ARIA (Automatic Root Image Analysis). PLoS ONE 9, e108255. [DOI] [PMC free article] [PubMed] [Google Scholar]
- Pfister, A. , Barberon, M. , Alassimone, J. et al (2014) A receptor‐like kinase mutant with absent endodermal diffusion barrier displays selective nutrient homeostasis defects. ELife 3, e03115. [DOI] [PMC free article] [PubMed] [Google Scholar]
- Potuschak, T. , Lechner, E. , Parmentier, Y. , Yanagisawa, S. , Grava, S. , Koncz, C. and Genschik, P. (2003) EIN3‐dependent regulation of plant ethylene hormone signaling by two Arabidopsis F box proteins: EBF1 and EBF2. Cell, 115, 679–689. [DOI] [PubMed] [Google Scholar]
- Pound, M.P. , French, A.P. , Atkinson, J.A. , Wells, D.M. , Bennett, M.J. and Pridmore, T. (2013) RootNav: navigating images of complex root architectures. Plant Physiol. 162, 1802–1814. [DOI] [PMC free article] [PubMed] [Google Scholar]
- Ristova, D. , Rosas, U. , Krouk, G. , Ruffel, S. , Birnbaum, K.D. and Coruzzi, G.M. (2013) RootScape: a landmark‐based system for rapid screening of root architecture in Arabidopsis. Plant Physiol. 161, 1086–1096. [DOI] [PMC free article] [PubMed] [Google Scholar]
- Rodrigues, A. , Santiago, J. , Rubio, S. , Saez, A. , Osmont, K.S. , Gadea, J. , Hardtke, C.S. and Rodriguez, P.L. (2009) The short‐rooted phenotype of the brevis radix mutant partly reflects root abscisic acid hypersensitivity. Plant Physiol. 149, 1917–1928. [DOI] [PMC free article] [PubMed] [Google Scholar]
- Slovak, R. , Goschl, C. , Su, X. , Shimotani, K. , Shiina, T. and Busch, W. (2014) A scalable open‐source pipeline for large‐scale root phenotyping of Arabidopsis. Plant Cell, 26, 2390–2403. [DOI] [PMC free article] [PubMed] [Google Scholar]
- Takatsuka, H. and Umeda, M. (2014) Hormonal control of cell division and elongation along differentiation trajectories in roots. J. Exp. Bot. 65, 2633–2643. [DOI] [PubMed] [Google Scholar]
- Ubeda‐Tomas, S. , Swarup, R. , Coates, J. , Swarup, K. , Laplaze, L. , Beemster, G.T. , Hedden, P. , Bhalerao, R. and Bennett, M.J. (2008) Root growth in Arabidopsis requires gibberellin/DELLA signalling in the endodermis. Nat. Cell Biol. 10, 625–628. [DOI] [PubMed] [Google Scholar]
- Verbelen, J.P. , De Cnodder, T. , Le, J. , Vissenberg, K. and Baluska, F. (2006) The root apex of Arabidopsis thaliana consists of four distinct zones of growth activities: meristematic zone, transition zone, fast elongation zone and growth terminating zone. Plant Signal. Behav. 1, 296–304. [DOI] [PMC free article] [PubMed] [Google Scholar]
- Wu, J. , Wu, Q. , Pages, L. , Yuan, Y. , Zhang, X. , Du, M. , Tian, X. and Li, Z. (2018) RhizoChamber‐Monitor: a robotic platform and software enabling characterization of root growth. Plant Methods, 14, 44. [DOI] [PMC free article] [PubMed] [Google Scholar]
- Yazdanbakhsh, N. and Fisahn, J. (2012) High‐throughput phenotyping of root growth dynamics. Methods Mol. Biol. 918, 21–40. [DOI] [PubMed] [Google Scholar]
Associated Data
This section collects any data citations, data availability statements, or supplementary materials included in this article.
Supplementary Materials
Figure S1. Laboratory setup for taking pictures of the plates.
Figure S2. The ruler identification process.
Figure S3. Evaluation of the time required to measure root length.
Figure S4. Validation of MyROOT batch analysis processing.
Figure S5. Comparison of MyROOT, BRAT and EZ‐Rhizo softwares.
Table S1. Comparison of available semi‐automatic softwares for quantification of root traits.
Table S2. Comparison of MyROOT, BRAT and EZ‐Rhizo softwares.
Video S1. Demo video of MyROOT software.
Data Availability Statement
MyROOT has been developed in MATLAB (version 8.3.0.532. Natick, Massachusetts: The MathWorks Inc., 2014). It will be made available to the plant sciences community through the Plant Image Analysis website (plant‐image‐analysis.org; Lobet et al., 2013) as a standalone executable application. The executable application together with the datasets generated during the current study (from Figures 3, 5 and S4) are available in the [Zenodo] repository, [https://doi.org/10.5281/zenodo.2552250].