

Abstract
Objectives
To determine the relationship between objectively measured physical activity (PA) and the gut microbiome among community-dwelling older men.
Design
Cross-sectional study.
Setting
Osteoporotic Fractures in Men (MrOS) cohort participants at Visit 4 (2014-16).
Participants
Eligible men (n=373, mean age 84 y) included participants with 5-day activity assessment with at least 90% wear time and analyzed stool samples.
Measurements
PA was measured with the SenseWear Pro3 Armband and stool samples analyzed for 16S v4 rRNA marker genes using Illumina MiSeq technology. Armband data together with sex, height, and weight were used to estimate total steps, total energy expenditure, and level of activity. 16S data was analyzed using standard UPARSE workflow. Shannon and Inverse Simpson indices were measures of (within-participant) α-diversity. Weighted and unweighted Unifrac were measures of (between-participant) β-diversity. We used linear regression analysis, principal coordinate analysis, zero-inflated Gaussian models to assess association between PA and α-diversity, β-diversity, and specific taxa, respectively, with adjustments for age, race, BMI, clinical center, library size, and number of chronic conditions.
Results
PA was not associated with α-diversity. There was a slight association between PA and β-diversity (in particular the second principal coordinate). Compared to those who were less active, those who had higher step counts had higher relative abundance of Cetobacterium and lower relative abundance of taxa from the genera Coprobacillus, Adlercreutzia, Erysipelotrichaceae CC-115 after multivariable adjustment including age, BMI, and chronic conditions. There was no consistent pattern by phylum.
Conclusion
There was a modest association between levels of PA and specific gut microbes among community-dwelling older men. The observed associations are consistent with the hypothesis that underlying health status and composition of the host microbiome are related.
Key words: Physical activity, gut microbiome, older men, step count, activity monitor
Introduction
The composition of the gut microbiome is influenced by many host and environmental factors, particularly diet, as the microbiome is essential to nutrient digestion, synthesis, and absorption (1, 2, 3, 4). It is also hypothesized that the microbiome is part of a causal pathway linking physical activity (PA) and chronic disease (5;6). Evidence from animal studies suggests that PA is an important modulating factor on gut microbial communities. Active vs. sedentary rodents had greater microbiome diversity (7, 8, 9) as well as a higher prevalence of bacteria associated with better general and metabolic health (10;11). Certain associations between PA and the gut microbiome were not consistent in experimental rodent studies, e.g. some studies found no relationship between exercise and phylum abundance (12), some studies found that Firmicutes was more prevalent in the high exercise group (13;14), and some studies had the opposite finding (7;8). Furthermore, rodent studies use restricted (locked wheel), forced exercise, and controlled feeding protocols that are not readily generalizable to humans.
There have been a few studies examining PA and the gut microbiome in humans. One study found that the microbiome of professional athletes had a greater diversity than those of controls (15), and further differences were also noted in the associated functional profiles (16). Another cross-sectional study of premenopausal women found that women meeting the World Health Organization recommendation for PA had a greater abundance of bacterial species commonly associated with better health status compared with sedentary women (17). Finally, a small longitudinal study among habitually sedentary men and women found that exercise altered the fecal microbiome (18). Previous studies on PA have been limited to younger adults, who exhibited a high variation in PA. Age related changes in diet, activity, multimorbidity and medication use may impact associations between the gut microbiome and PA.
Our aim in this study is to determine the relationship between objectively measured PA and the gut microbiome among community-dwelling older men while adjusting for possible confounding factors.
Methods
From 2000 to 2002, the Osteoporotic Fractures in Men (MrOS) study enrolled 5994 ambulatory communitydwelling men, aged 65 years and older, living in one of six U.S. metropolitan areas. Those with a history of bilateral hip replacement or the inability to walk without the assistance of another person were not eligible to participate (19;20). The institutional review board at each participating institution approved the study protocol and written informed consent was obtained from all participants. Further information about the MrOS cohort can be found at the MrOS Online website (http://mrosdata.sfcc-cpmc.net). All surviving active MrOS participants were invited to participate in a Year 14 visit with 1841 complete clinic visits occurring from May 2014 and May 2016. An ancillary microbiome study invited 1328 men starting in 2015 and 982 participants agreed to provide a stool sample. Sample collection was concurrent with Visit 4 except for those whose visit had already taken place. Participants were queried on antibiotic use (30 days prior to sample collection). A random subsample of specimens (n=599) from these participants were sent to the Alkek Center for Metagenomics and Microbiome Research (CMMR), Baylor College of Medicine in Houston, TX, for microbiome analysis. The analytic sample for the present analysis included those 373 men with 16S sequencing, objective PA measures based on 5 days and 90% wear time and who reported no use of antibiotics within the past month and no use of probiotics, see Figure 1.
Figure 1.
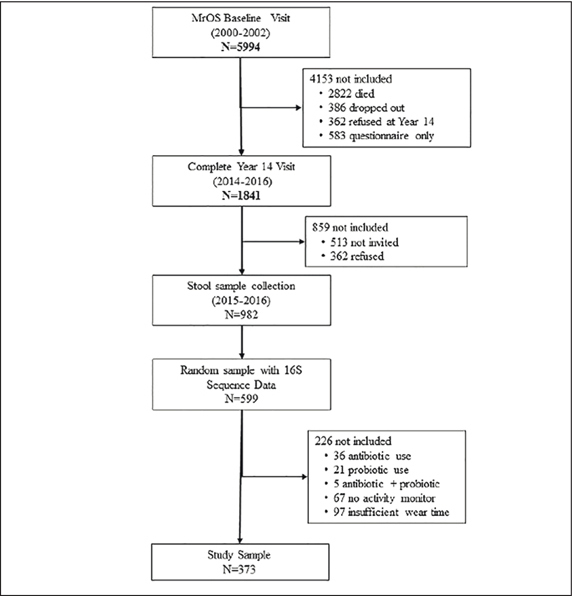
Study Flow Diagram
Objective Physical Activity
Men were instructed to wear the multi-sensor SenseWear® Pro3 Armband (Body Media, Inc., Pittsburgh, PA) on their right arm at all times, including during sleep, for a typical 7-day period following Visit 4 and to remove it only for brief periods for bathing and water activities. The monitor uses a combination of five sensors (2-axis accelerometer, a heat flow sensor, galvanic skin response, skin temperature sensors, and ambient temperature sensors) to collect physiological data (including wear time) in 1-minute epochs. The data collection begins at 12 am (midnight) on the first day the participant is given the armband, and ends with the completion of the last 24-hour period at midnight, with times before and after excluded from the data analysis. We included only participants who completed at least 5 days with 90% wear time. These data served as inputs in proprietary algorithms (Innerview Professional 5.1 software, Body Media, Inc; Pittsburgh, PA) along with height, weight, handedness and smoking status to estimate total step counts per day and total energy expenditure (TEE) in kilocalories per day (kcal/d). The resting metabolic rate (RMR) was estimated using the Harris Benedict equations. Non-wear time was detected by the galvanic and temperature skin sensors. The TEE included both wear time energy (from arm band) and non-wear time energy which was imputed from the RMR and the TEE from the wear time. The sleep interval was determined using proprietary algorithms. PA was also expressed as mean metabolic equivalent of task (METs). Minutes per day while awake spent in sedentary (METs ≤ 1.5), light (METs > 1.5, <3), and at least moderate (METs ≥3) activity were quantified. A validation study comparing the SenseWear® Pro Armband with the criterion method of doubly labeled water showed acceptable levels of agreement with total energy expenditure and strong correlation with measure of active energy expenditure as calculated using a standard equation based on criterion measure of total energy (21). A validation study in older adults demonstrated good concordance between SenseWear® Pro Armband and pedometer measured steps (22). There was a good correlation between minute-by- minute METS measured by the armband and minute-by-minute oxygen consumption in a small study of those with chronic obstructive pulmonary disease (23). Sleep time was reliably measured in a study that also performed polysomnography in patients with sleep apnea and controls (24). Self-reported PA was assessed using the Physical Activity Scale for the Elderly (PASE) (25). Our primary exposure variable was step count, while other measure of objective activity and self-reported activity were secondary exposure variables.
Other measures
Information on demographics, lifestyle, and medical and family history was obtained by questionnaire and interview by trained clinical staff. Race/ethnicity (non-Hispanic white vs. other) was self-identified. Participants were classified into ever smoker (100+ cigarettes) vs. never smokers. Selfreported alcohol intake was divided into three categories; less than 1 drink/week, 1–5 drink/week, 6+ drinks/week. BMI was calculated as kg/m2. Chronic conditions were self-reported at Visit 4 and included myocardial infarction, stroke, congestive heart failure, diabetes, cancer, COPD, rheumatoid arthritis, osteoarthritis, depression, visual impairment, Parkinson's disease, and Alzheimer's disease. A comorbidity index was created summing the total number of self-reported chronic conditions together with fall history and history of hip fracture (26). Participants were asked to bring all current (any use within the past 30 days) prescription medications with them to the clinic. All medications recorded by the clinics were entered into an electronic medications inventory (San Francisco Coordinating Center, San Francisco, CA). Each medication was matched to its Ingredient(s) based on the Iowa Drug Information Service (IDIS) Drug Vocabulary (College of Pharmacy, University of Iowa, Iowa City, IA) (27).
The Block 98.2 MrOS FFQ (NutritionQuest, Berkeley, CA) was completed by participants at home following Visit 4 (28). The questionnaire included 69 individual food item questions and 13 additional questions about food preparation and low-fat foods that were used to refine nutrient calculations. The FFQ included nine categories of frequency responses for foods and beverages and four categories of portion size responses and a one-page supplement to the FFQ was included that inquired about the frequency of consumption and portion sizes (using the same categories) for nine of the most commonly consumed probiotic foods (e.g., yogurt and probiotic drinks). The derivation of dietary patterns in MrOS participants has been described previously (29). Briefly, food groups were constructed using individual food variables from the Visit 4 FFQ based on nutrient similarities, culinary use, and previous studies. A two-factor solution was retained based on eigenvalues and final factor loadings were calculated through varimax rotation. Factor 1 loaded heavily on processed meats, refined grains, potatoes, eggs, sweets, and salty snacks and was designated the Western pattern, similar to derivations in other studies. Factor 2 had high factor loadings for fruits, vegetables, nuts, fish, and chicken and turkey without skin and was designated the prudent pattern, similar to derivations in other studies.
Microbiome sample collection and data processing
Fecal samples were collected at the homes of study participants following Visit 4 using the Omnigene Gut collection kit (OMR-200, DNA Genotek, Ottawa, Canada). The kit is designed for home collection with easy to use protocol and includes non-toxic stabilizing reagent, thus stool DNA is preserved at ambient temperature for up to 60 days. Samples were returned directly to the Portland coordinating center for initial processing to ensure proper collection and then storage at -80 C. Repeat samples were requested for those (2%) which did not pass the initial quality control check, thus all samples analyzed met protocol standards. A random subset of collected samples were indexed and shipped overnight with dry-ice to the Alkek CMMR for characterization of the gut microbiome (taxonomic profiles) by 16S ribosomal RNA (rRNA) gene sequencing as detailed previously (30). Briefly, genomic bacterial DNA was extracted from fecal samples using the MO BIO PowerSoil DNA Isolation Kit (MO BIO Laboratories, Inc, Carlsbad, CA). The 16S v4 rDNA hypervariable region was then amplified using primers 515F and 806R by polymerase chain reaction and sequenced on the MiSeq platform using the 2×250 bp paired-end protocol (Illumina, San Diego, CA). The read pairs were demultiplexed based on their unique molecular barcodes and overlapping reads were merged using Usearch v9.0.2132 (i86linux64).
UParse/Greengenes: The 599 samples for this project were run through the standard UPARSE 16S sequence workflow with 97% clustering and minimum cluster size of 2 to create operational taxonomic units (OTU). Filtered reads were used to generate the OTUs. Reads not passing quality control were kept and used in the step assigning reads to OTUs. Reads were truncated to a max length of 200 bases and filtered for quality control using a MAXEE score of 1 resulting in a total of 27,791,779 reads. The Greengenes 16S rRNA Gene Database version 13.8 (greengenes.lbl.gov) was used for taxonomy prediction down to the lowest level possible so that the unfiltered data included 1913 OTUs of which 163 were classified down to the genus level. The dataset was filtered to only include OTUs with a minimum of 3 reads in at least 3 samples. The filtered OTU data consisted of 1434 OTUs classified to 13 phyla, 24 classes, 37 orders, 61 families, and 114 genera. Finally, the OTU data was resampled to have minimum sample depth of 12,783 reads (corresponding to the minimum library size) and then filtered again to include OTUs with a minimum of 3 reads in at least 3 samples. The rarefied filtered data consisted of 1196 OTUs.
Statistical methods
There are two types of diversity: α-diversity which is a measure the diversity of the microbiome within a given individual and β-diversity which is a measure of the similarity (or dissimilarity) of the microbiomes in different individuals. Diversity measures were estimated based on identified OTUs in the unfiltered data. We used the Shannon index and the Inverse Simpson index as measures of α-diversity (richness/ evenness). The association of bacterial α-diversity and subject phenotypes was assessed using linear regression models and adjusted for age, race, BMI, clinical center, number of chronic conditions, and library size. To look at β-diversity, we used weighted and unweighted Unifrac as a distance measure on the rarefied and log-transformed abundance data (31). Unifrac incorporates phylogenetic differences between organisms in addition to presence/absence (unweighted) and count (weighted) information. β-diversity was summarized using weighted and unweighted principal coordinates analysis (PCoA). PERMANOVA, as implemented by the function adonis in the vegan package (32), was used to test for associations between activity phenotypes and β-diversity. The algorithm uses reduction of dimensionality and iteratively tests associations between blocks of related features (33;34).
To determine the associations between activity phenotypes and specific taxa we first aggregated OTUs by genus level (35). The resulting taxa will have higher prevalence and relative abundance, while still retaining the specificity of genus level assignments. In addition, consideration of genus-level agglomeration reduces the multiplicity of models, therefore impacting power dilution due to correction for multiple testing. The taxa were then included as outcomes if they had a prevalence greater than 10% and a mean relative abundance of at least 10–4, resulting in 78 candidate taxa. To determine the relationship between activity phenotype and individual taxa we used a mixture model based on a zero-inflated Gaussian distribution (metagenomeSeq) (36). We included all basic demographic variables in the fully adjusted models but screened other potential confounders for inclusion. We did not include variables (e.g. smoking, alcohol use, diet) that were not associated with step count, our primary exposure variable. Full models were adjusted for age, race, BMI, clinical center, number of chronic medical conditions, and library size. Finally we present the results based on an initial screen including taxa with unadjusted p<0.05 in the fully adjusted models. Including such taxa is important for hypothesis generation as well as comparisons with other studies. We then computed adjusted p-values for the fully adjusted models using the Benjamini-Hochberg false discovery method using the full set of 78 taxa as described above (genus-level aggregation filtered by prevalence/abundance). Including the results of such adjustment allows for better interpretation and should be used for design of studies which depend on taxa identified in the present study. Analysis was done using Stata 15 and R (3.4.4) with phyloseq (1.22.3), vegan (2.5.2), and metagenomeseq (1.20.1) packages.
Results
There were 373 men (87.9% non-Hispanic white) in the analytic sample (Figure 1, Table 1), with mean (range) age 84.0 (78-98) years and mean (SD) BMI 26.9 (3.8) kg/m2. The mean (SD) daily step count in the study cohort was 4735 (3002) steps/ day with corresponding mean (SD) total energy expenditure of 2210 (400) kcal/day. There was a broad range of step counts with interquartile range from 2520 to 6447 steps and full range from 30 to 18,688 steps. The characteristics of the analytic sample stratified by step count quartile are shown in Table 1. Those with higher total step count (by quartile) were younger, had lower BMI, and had fewer chronic medical conditions than those with lower step count. Other measures of PA varied consistently by step count quartile. In contrast, education, smoking, diet, and α-diversity (Shannon, Inverse Simpson) did not vary by step count quartile.
Table 1.
Baseline characteristics of study cohort stratified by quartile of step counts
| Mean (SD) or N, % | Cohort N=373 | Quartile 1 N=94 | Quartile 2 N=93 | Quartile 3 N=93 | Quartile 4 N=93 |
|---|---|---|---|---|---|
| Age | 84.0 (3.9) | 85.6 (4.4) | 84.8 (4.2) | 83.2 (3.1) | 82.3 (3.0) |
| Body Mass Index | 26.9 (3.8) | 27.7 (4.1) | 27.4 (4.0) | 26.7 (3.3) | 25.7 (3.3) |
| Self-reported PA (PASE score) | 1270 (67.4) | 88.9 (59.7) | 113.4 (55.4) | 147.9 (63.1) | 158.5 (67.8) |
| Total energy expenditure (kcal) | 2211 (400) | 1962 (289) | 2089 (316) | 2293 (332) | 2499 (427) |
| Sedentary time (min) | 851.2 (112.4) | 900.2 (109.3) | 880.1 (90.3) | 838.7 (97.6) | 785.4 (116.0) |
| Active time (min) | 71.6 (59.3) | 24.0 (16.8) | 48.9 (29.4) | 82.0 (41.4) | 132.0 (68.7) |
| Non-Hispanic White | 328 (87.9) | 89, (94.7) | 80 (86.0) | 81 (87.1) | 78 (83.9) |
| College education | 226, 60.6% | 54, 57.5% | 53, 57.0% | 64, 68.8% | 55, 59.1% |
| Regular alcohol intake (1-5 drinks/week) | 96, 25.7% | 22, 23.4% | 25, 26.9% | 25, 26.9% | 24, 25.8% |
| Regular alcohol intake (6+ drinks/week) | 84, 22.5% | 11, 11.7% | 27, 29.0% | 25, 26.9% | 21, 22.6% |
| Ever smoker | 209, 56.0% | 53, 56.4% | 57, 61.3% | 53, 57.0% | 46, 49.5% |
| Comorbidity score | 1.98 (1.37) | 2.45 (1.55) | 1.94 (1.36) | 1.97 (1.22) | 1.58 (1.20) |
| Statin Use | 213, 57.1% | 58, 61.7% | 49, 52.6% | 55, 59.1% | 51, 54.8% |
| Western Dietary score | -0.06 (1.05) | 0.05 (1.09) | 0.02 (1.09) | -0.15 (0.87) | -0.17 (1.15) |
| Prudent Dietary score | 0.01 (1.04) | 0.02 (1.18) | -0.02 (0.93) | -0.02 (0.89) | 0.05 (1.16) |
| Shannon Diversity | 3.4 (0.6) | 3.5 (0.6) | 3.4 (0.6) | 3.4, (0.6) | 3.4 (0.6) |
| Inverse Simpson | 16.3 (9.9) | 15.8 (9.4) | 17.4 (11.5) | 15.5 (8.6) | 16.5 (9.8) |
Bold font indicates association between quartile and variable with p < 0.05; Italic font indicates association between quartile and variable with p <0.001, consistent with correlation of PA measures. Missing variables: alcohol use (n=2), dietary variables (n=7); Q1:30-2499 steps, Q2:2520-4226 steps, Q3: 4339–6447 steps, Q4:6455–18688 steps
In this group of older men, the dominant phyla were Bacteroidetes, Firmicutes, Proteobacteria, and Verrucomicrobia with mean relative abundance of 46.9%, 41.8%, 6.4%, 3.1% respectively, and thus <2% were from other phyla. The dominant OTUs when combined at the genus level (with mean relative abundance of at least 1%) were Bacteroides (33.4%), Faecalibacterium (8.2%), o. Clostridiales (8.0%), f. Ruminococcaceae (7.0%), f. Lachnospiraceae (5.1%), Ruminococcus (3.9%), Parabacteroides (3.9%), Prevotella (3.8%), Akkermansia (3.1%), f. Rikenellaceae (2.7%), f. Enterobacteria (2.6%), Erwinia (1.5%), Blautia (1.3%), Lachnospira (1.2%), Oscillospira (1.2%), and Sutterella (1.1%).
Figure 2 shows α-diversity measures by clinical center, race, and BMI. Higher levels of α-diversity were observed in participants who were non-Hispanic white vs. other race/ ethnic group and also among those with low/normal BMI (vs. overweight/obese). There were no associations observed between any of the PA constructs (self-reported or objective) and either α-diversity measure (Table 2]). These results were consistently null in crude and multivariable analyses
Figure 2.
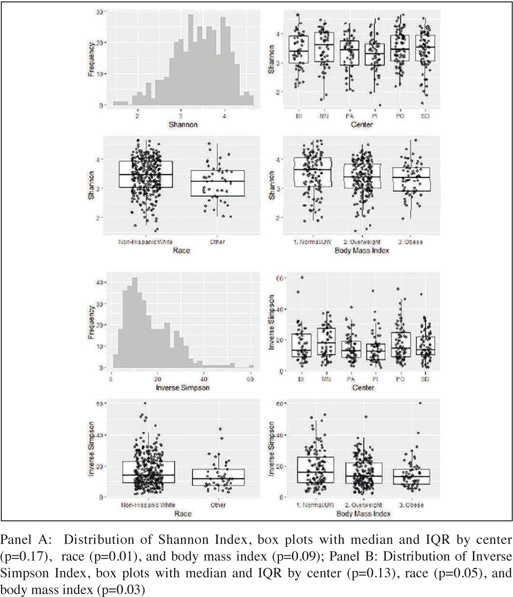
Distributions and Predictors of α-Diversity Measures
Table 2.
Association between Physical Activity (per SD change) and α -Diversity
| Shannon | Inverse Simpson | |||
|---|---|---|---|---|
| Crude | Multivariate | Crude | Multivariate | |
| Step count | 0.00 (-0.06, 0.06) | -0.02 (-0.08, 0.05) | -0.09 (-1.10, 0.92) | -0.57 (-1.68, 0.55) |
| Total energy Expenditure | -0.01 (-0.07, 0.05) | -0.02 (-0.09, 0.04) | -0.52 (-1.53, 0.49) | -0.78 (-1.90, 0.35) |
| Active time | 0.03 (-0.04, 0.09) | 0.00 (-0.07, 0.06) | 0.22 (-0.79, 1.23) | -0.35 (-1.44, 0.74) |
| Non-sedentary time | 0.03 (-0.03, 0.09) | 0.01 (-0.06, 0.07) | 0.32 (-0.69, 1.32) | 0.01 (-1.05, 1.04) |
| Self-reported PA (PASE score) | 0.03 (-0.03, 0.09) | 0.03 (-0.03, 0.10) | -0.07 (-1.08, 0.94) | -0.26 (-1.31, 0.80) |
*all coefficients expressed per SD increase in predictor variables: TEE=400 kcal, step count=3002 steps, PASE score=67, active time 59 min, non-sedentary time=112 min. The outcomes variables (Shannon Index, and Inverse Simpson Index) were not standardized. Multivariate models adjusted for age, race, BMI, clinical center, library size, and # of chronic conditions (fall history, hip fracture, myocardial infarction, stroke, congestive heart failure, diabetes, cancer, COPD, rheumatoid arthritis, osteoarthritis, depression, visual impairment, Parkinson's disease, and Alzheimer's disease).
In contrast to α-diversity findings, step count and self- reported PA were consistently associated with β-diversity as determined by unweighted Unifrac (Figure 3). Men with higher step counts and higher self-reported PA had higher levels of the second principal component factor assessed by unweighted Unifrac. The association between step count and β-diversity was not significant after adjustment for covariates, while the association between self-reported PA and β-diversity remained statistically significant. There was also a marginal association between self-reported PA and weighted Unifrac, however, this association was not present for step count (Figure 3) or other objective PA measures (data not shown).
Figure 3.

The Associations between Quartiles of Steps and Quartiles of Self-reported PA (PASE score) and β-Diversity Principal Coordinate Analysis
When considering taxa-specific associations, measures of PA were related to differences in specific groups of bacteria (OTUs and genera) after multivariable adjustment. Compared to individuals with lower step counts, those who had higher step counts also had higher relative abundances of taxa from the genera Cetobacterium and lower relative abundance of taxa from the genera Coprobacillus, Adlercreutzia, Erysipelotrichaceae CC-115 (at FDR adjusted p ≤ 0.05). The point estimates for beta coefficients were quite modest, ranging between -0.37 and 0.45 and corresponding to fold-changes ranging between 0.77 and 1.36. Those with higher step counts also had a higher relative abundance of Faecalibacterium, Streptophyta, Prevotella, Clostridium, Lachnospira, Peptococcaceae, Paraprevotellaceae, Lachnospiraceae, and lower relative abundance of Alistipes, Clostridia SHA-98, Anaerotruncus, Eggerthella, Megasphaera (albeit at unadjusted p ≤ 0.05). There was no consistent pattern with respect to direction of association and phylum membership. In particular there were positive and negative associations for PA and individual taxa that were members of Bacteroidetes and Firmicutes. In secondary analysis we considered both self-reported PA and other objective measures of PA. Figure 4 shows the association between all PA measures and the taxa associated with step count. The magnitude and direction of the association between PA measures and taxa was roughly concordant. The beta coefficients for TEE and minutes of PA were largely consistent in magnitude and direction with those for step count. The beta coefficients for non-sedentary minutes and self-reported PA also tracked with those for step count but were somewhat discordant, most notably for taxa with fold changes closer to 1 (e.g. Streptophyta). Some differences in fold change magnitude but not direction were noted for PA measures and Paraprevotellaceae with estimated fold changes ranging from 1.21 to 1.72.
Figure 4.
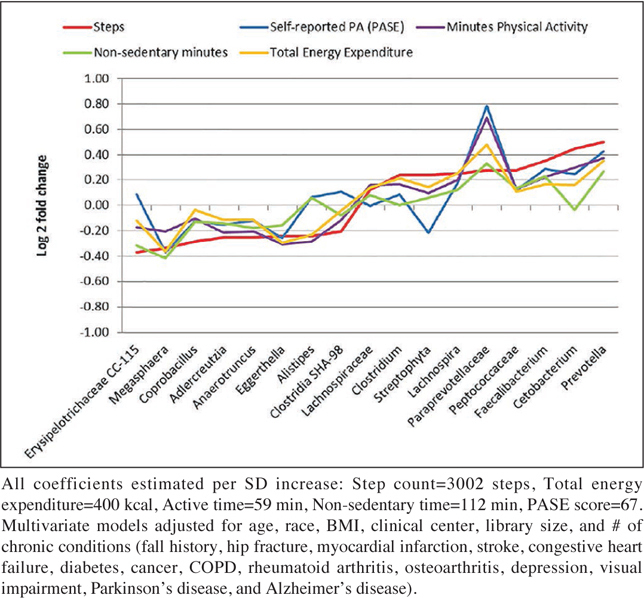
The Association between PA variables and Taxa (Genus-level agglomeration)
Table 3.
The Association between Step Count and Taxa (Genus-level agglomeration)
| (Phylum) OTU | Sequence | Prevalence | Abundance | Beta | p-value | FDR p-value |
|---|---|---|---|---|---|---|
| (F) Erysipelotrichaceae CC-115 | 807548 | 35.9% | 0.00018 | -0.37 | 0.00 | 0.04 |
| (F) Megasphaera | 4410265 | 22.3% | 0.00034 | -0.34 | 0.02 | 0.11 |
| (F) Coprobacillus | 415427 | 57.4% | 0.00014 | -0.29 | 0.00 | 0.04 |
| (A) Adlercreutzia | 631764 | 63.3% | 0.00016 | -0.25 | 0.00 | 0.05 |
| (F) Anaerotruncus | 315223 | 88.5% | 0.00050 | -0.25 | 0.01 | 0.09 |
| (A) Eggerthella | 682726 | 47.7% | 0.00012 | -0.24 | 0.01 | 0.07 |
| (B) Alistipes | 107044 | 65.4% | 0.00066 | -0.24 | 0.04 | 0.21 |
| (F) Clostridia SHA-98 | 836693 | 55.5% | 0.00011 | -0.20 | 0.01 | 0.07 |
| (F) Lachnospiraceae | 975306 | 100.0% | 0.05142 | 0.12 | 0.03 | 0.21 |
| (F) Clostridium | 558420 | 99.5% | 0.00619 | 0.24 | 0.05 | 0.23 |
| (C) Streptophyta | 262379 | 44.5% | 0.00017 | 0.24 | 0.01 | 0.07 |
| (F) Lachnospira | 843553 | 99.7% | 0.01246 | 0.25 | 0.04 | 0.21 |
| (B) Paraprevotellaceae | 157377 | 12.3% | 0.00028 | 0.28 | 0.04 | 0.21 |
| (F) Peptococcaceae | 110317 | 49.3% | 0.00024 | 0.28 | 0.01 | 0.11 |
| (F) Faecalibacterium | 368219 | 100.0% | 0.08248 | 0.35 | 0.01 | 0.09 |
| (Fus) Cetobacterium | 828162 | 12.1% | 0.00101 | 0.45 | 0.00 | 0.00 |
| (B) Prevotella | 568118 | 100.0% | 0.03760 | 0.50 | 0.02 | 0.11 |
*all coefficients expressed per SD increase step count=3002 steps. Table sorted by beta coefficient, with negative value and positive values indicating direction of association (zero = no association). Names are given by initial of phylum [(A) Actinobacteria, (B) Bacteroidetes, (C) Cyanobacteria, (F) Firmicutes, (Fus) Fusobacteria] and lowest taxonomy down to genus. Multivariate models adjusted for age, race, BMI, clinical center, library size, and # of chronic conditions (fall history, hip fracture, myocardial infarction, stroke, congestive heart failure, diabetes, cancer, COPD, rheumatoid arthritis, osteoarthritis, depression, visual impairment, Parkinson's disease, and Alzheimer's disease).
Discussion
We found that measures of PA among community-dwelling older men were related to specific taxa (genera and other OTUs) in the gut microbiome. Compared to those who were less active, those who had higher step counts had higher relative abundance of Cetobacterium and lower relative abundance of taxa from the genera Coprobacillus, Adlercreutzia, Erysipelotrichaceae CC-115. These results were observed after multivariable adjustment including age and chronic conditions, no confounding by sex (men only), and FDR correction. Possible associations not meeting FDR threshold were observed for other sentinel taxa, such as Prevotella, Faecalibacterium, Lachnospira, and Clostridium. Measures of PA were also related to β-diversity as measured by unweighted Unifrac, a method that considers presence/absence but not relative abundance and is therefore more sensitive to taxa with lower prevalence and abundance, i.e. taxa that are not part of the core gut microbiome. Measures of PA were not related to α-diversity and only weakly related to weighted beta diversity, thus suggesting that activity has only a limited effect on variation among core taxa. The associations between PA and taxa were generally concordant regardless of the PA measure.
Previous human studies assessing the relationship between PA and the gut microbiome have been conducted on select populations of younger adults. To our knowledge this is the first study to consider relationships between PA and gut microbiota in a large cohort of older men. This is likely important as other reports have found global shifts in predominant phyla that are associated with age. In particular, a cross-sectional study including age range over the life span showed increased prevalence of Bacteroidetes and Proteobacteria and decreased prevalence of Firmicutes and Actinobacteria among the very old vs. middle aged Japanese adults (37). The relative abundance by phyla in the present study was most similar to the oldest age strata (86-98) in the Japanese study, an age strata similar to the present study.
There are some shifts in taxa abundance that occur with age and therefore associations may be unique to a younger or older cohort, but it is also likely that some taxa are present throughout the life-span and that PA may have similar associations with these taxa. One cross-sectional study of 86 men found clear and consistent differences between the microbiome of 40 professional athletes versus the microbiome of 46 age and sex matched controls (23 low BMI and 23 high BMI) (15). In particular, α-diversity was higher among athletes compared to controls, but did not differ between high and low BMI control groups. Notably, the top six differences in relative abundance between athletes and high BMI control group were in the Firmicutes, Ruminococcaceae, S24-7, Succinivibrionaceae, RC9 gut group and Succinivibrio groups, none of which were differentially abundant by step count in the current study. There were 40 taxa that were more prevalent in athletes in comparison with the low BMI group, of which the top six fold changes were for Prevotellaceae, Erysipelotrichaceae, S24-7, Succinivibrionaceae, Prevotella and Succinivibrio groups, none of which were differentially abundant by step count in the present study at nominal level. The comparison of professional athletes vs. either control group is not likely to be generalizable, particular for comparisons within a group of older men. We note however that exact replication may also fail due to data processing and naming of taxa, for example Erysipelotrichaceae includes Coprobacillus and CC-115 and therefore the present finding may well partially confirm previous results.
A second study based on the same select group of male athletes and controls found that the differences at the taxa level, some of which occur in the present study, were also associated with differences in the functional capacity and associated pathways (e.g. amino acid biosynthesis and degradation, carbohydrate metabolism, vitamin biosynthesis) (16). Notably, the altered functional capacity of the microbiome among athletes was further evident in a higher production of short-chain fatty acids. While there were very clear differences between athletes and controls, the differences may not be wholly attributable to PA per se, since the dietary intake and requirements of athletes is also necessarily different from the control group. In another cross-sectional study of younger women, Bressa et al found that women with higher vs lower PA had a higher relative abundance of Faecalibacterium prausnitzii measured by quantitative PCR, a finding consistent with the present study (17). Bressa et al also found between group differences for 11 OTUs when analyzed at the genus level, but none of these findings were replicated in the present study. We note however that some discrepancies might be due to slightly different taxonomic names, e.g. Bressa found that PA was related to higher relative abundance of Paraprevotella while the present study found that PA was related to higher relative abundance of Paraprevotellaceae, an OTU only identified down to the level of family. Bressa et al used the same Greengenes reference database, however the clustering of OTUs is sample dependent thus the combination of clustering and matching may result in different names (terminal taxa) for a given sequence. Other findings from Bressa et al were that weighted β-diversity differed between active vs sedentary women but that α-diversity and unweighted β-diversity did not differ between groups.
A recent longitudinal study (18) assessed the changes in microbiome over a 6 week period among lean and obese sedentary men and women exposed to 3-week intervention of moderate to vigorous activity with a 3 week washout period following the intervention. While there was no formal control group, the experimental design included dietary control (i.e. specified diet prior to sample collection) while other factors could be controlled for using repeated measures among individuals. The exercise intervention successfully altered PA level, cardio-respiratory fitness, and body composition. There were concurrent longitudinal changes in weighted β-diversity which varied slightly by body mass index. Since Bressa et al was a longitudinal study, changes in microbial composition could be matched with changes in metabolic profile. Notably, those who were lean had an increase in both fecal short-chain fatty acids (SCFAs), particularly butyrate, and a concurrent increase in related microbial taxa (Lachnospiraceae, Clostridiales, Roseburia, Lachnospira, Faecalibacterium) which then reversed after exercise wash-out period and return to sedentary activity. This small longitudinal study also suggests a possible effect modification by body size for the association between PA and the host microbiome. For those who were obese, improvement in cardio-respiratory fitness was associated with increases in Lachnospira, Veillonella, Paraprevotella, and Barnesiella, and decreases in Ruminococcus, Eggerthella, Dorea, Coprobacillus, Bifidobacterium, and f. Bifidobacteriaceae but without the concurrent association with fecal butyrate. In our study higher PA was associated with a greater prevalence of Faecalibacterium and Lachnospira (unadjusted p ≤ 0.05). Butyrate is the preferred energy source of colon epithelial cells stimulating normal growth and apoptosis (38). Butyrate is also implicated in mucin production and protein expression thus preserving the integrity of the gut barrier (39). Short chain fatty acids (SCFA) are also implicated in the modulation of the immune response including IL-6, IL-8, TNF-α, and NF-KB (40;41). Our cross-sectional findings are partially consistent with the longitudinal findings of Allen et al, suggesting that the hypothesized mechanisms relating PA and SCFA producing bacteria might also be present in this cohort of older men. Since the present study is cross-sectional, we cannot determine a causal relationship between microbiome and activity, and thus the positive association between relative abundance of Faecalibacterium, Lachnospira, Prevotella, Clostridium and activity could be attributable to underlying health state that is influenced by both exposure variables, although we did adjusted for underlying multimorbidity.
The strengths of the present study are the large sample of community-dwelling older men who have a stool sample and the comprehensive assessment of risk factors including objective measures of PA. The advanced age of the study participants enables a comprehensive assessment of the microbiome in late life. However, our study has limitations. There was no control of either diet or physical activity. Our study has a cross-sectional observational design, and this lack of temporal association limits inference on causality. In addition, we cannot completely exclude the possibility of selection bias and residual confounding. The generalizability of the present study is limited to healthy community-dwelling very old men (mean age 84 years). We note that Claesson et al found notable differences between community-dwelling and nursing home residents (4) leaving open effect modification by residential status. The cohort was also mostly non-Hispanic white with notable differences in α-diversity by race/ethnicity, thus leaving open potential effect modification by race/ ethnicity. While the present study is larger than many of the previous studies relating PA and the microbiome there are still issues concerning sample size. The study population was a select and generally healthy group of older men and most participants fell within a limited range of light and moderated PA. Thus future study is needed to determine associations between PA and microbiome parameters, with larger samples and/or more variation in phenotype. The present study was limited to 16S profiling, and thus limiting the interpretation, with further study necessary to identify taxa down to genus and species and to determine functional repertoire including SCFA production.
In conclusion, there was a modest association between levels of PA and specific gut microbes among community-dwelling older men. The observed associations are consistent with the hypothesis that underlying health status and composition of the host microbiome are related, however the directionality of this association is uncertain and needs to be further elucidated by longitudinal studies.
Acknowledgments
The Osteoporotic Fractures in Men (MrOS) Study is supported by National Institutes of Health funding. The following institutes provide support: the National Institute on Aging (NIA), the National Institute of Arthritis and Musculoskeletal and Skin Diseases (NIAMS), the National Center for Advancing Translational Sciences (NCATS), and NIH Roadmap for Medical Research under the following grant numbers: U01 AG027810, U01 AG042124, U01 AG042139, U01 AG042140, U01 AG042143, U01AG042145, U01 AG042168, U01 AR066160, and UL1 TR000128. This manuscript is also the result of work supported with resources and use of facilities of the Minneapolis VA Health Care System. The views expressed in this article are those of the authors and do not necessarily reflect the position or policy of the U.S. Department of Veterans Affairs or the United States government.
Conflicts of interest
Drs. Langsetmo, Orwoll, Ensrud, Cauley, and Shikany have received NIH funding as noted above. Dr. Langsetmo reports grants from Abbott outside the submitted work. Dr. Johnson reports personal fees from Nestlé Health Science, grants from General Mills Inc., outside the submitted work. Dr. Orwoll reports grants from Lilly, grants from Nordic Biosciences, grants from Mereo Biopharma, other from Bayer, outside the submitted work. Drs. Ryan Demmer, Fino, Hoffman, Shmagel, Meyer have no disclosures.
Ethical standards
The institutional review board at each participating institution approved the study protocol and written informed consent was obtained from all participants.
References
- 1.Zhernakova A, Kurilshikov A, Bonder MJ, Tigchelaar EF, Schirmer M, Vatanen T, Mujagic Z, Vila AV, Falony G, Vieira-Silva S, Wang J, Imhann F, Brandsma E, Jankipersadsing SA, Joossens M, Cenit MC, Deelen P, Swertz MA, Weersma RK, Feskens EJ, Netea MG, Gevers D, Jonkers D, Franke L, Aulchenko YS, Huttenhower C, Raes J, Hofker MH, Xavier RJ, Wijmenga C, Fu J. Population-based metagenomics analysis reveals markers for gut microbiome composition and diversity. Science. 2016;352:565–569. doi: 10.1126/science.aad3369. 10.1126/science.aad3369 PubMed PMID: 27126040, PMCID 5240844. [DOI] [PMC free article] [PubMed] [Google Scholar]
- 2.Xu Z, Knight R. Dietary effects on human gut microbiome diversity. Br J Nutr. 2015;113:S1–S5. doi: 10.1017/S0007114514004127. 10.1017/S0007114514004127 PubMed PMID: 25498959. [DOI] [PMC free article] [PubMed] [Google Scholar]
- 3.David LA, Maurice CF, Carmody RN, Gootenberg DB, Button JE, Wolfe BE, Ling AV, Devlin AS, Varma Y, Fischbach MA, Biddinger SB, Dutton RJ, Turnbaugh PJ. Diet rapidly and reproducibly alters the human gut microbiome. Nature. 2014;505:559–563. doi: 10.1038/nature12820. 10.1038/nature12820 PubMed PMID: 24336217. [DOI] [PMC free article] [PubMed] [Google Scholar]
- 4.Claesson MJ, Jeffery IB, Conde S, Power SE, O’Connor EM, Cusack S, Harris HM, Coakley M, Lakshminarayanan B, O’Sullivan O, Fitzgerald GF, Deane J, O’Connor M, Harnedy N, O’Connor K, O’Mahony D, van SD, Wallace M, Brennan L, Stanton C, Marchesi JR, Fitzgerald AP, Shanahan F, Hill C, Ross RP, O’Toole PW. Gut microbiota composition correlates with diet and health in the elderly. Nature. 2012;488:178–184. doi: 10.1038/nature11319. 10.1038/nature11319 PubMed PMID: 22797518. [DOI] [PubMed] [Google Scholar]
- 5.Weir T. Exercise: The Next Frontier in Microbiota Research. Exerc Sport Sci Rev. 2017;45:4–5. doi: 10.1249/JES.0000000000000097. 10.1249/JES.0000000000000097 PubMed PMID: 27801725. [DOI] [PubMed] [Google Scholar]
- 6.Cerda B, Perez M, Perez-Santiago JD, Tornero-Aguilera JF, Gonzalez-Soltero R, Larrosa M. Gut Microbiota Modification: Another Piece in the Puzzle of the Benefits of Physical Exercise in Health. Front Physiol. 2016;7:51. doi: 10.3389/fphys.2016.00051. 10.3389/fphys.2016.00051 PubMed PMID: 26924990, PMCID 4757670. [DOI] [PMC free article] [PubMed] [Google Scholar]
- 7.Evans CC, LePard KJ, Kwak JW, Stancukas MC, Laskowski S, Dougherty J, Moulton L, Glawe A, Wang Y, Leone V, Antonopoulos DA, Smith D, Chang EB, Ciancio MJ. Exercise prevents weight gain and alters the gut microbiota in a mouse model of high fat diet-induced obesity. PLoS One. 2014;9:e92193. doi: 10.1371/journal.pone.0092193. 10.1371/journal.pone.0092193 PubMed PMID: 24670791, PMCID 3966766. [DOI] [PMC free article] [PubMed] [Google Scholar]
- 8.Denou E, Marcinko K, Surette MG, Steinberg GR, Schertzer JD. High-intensity exercise training increases the diversity and metabolic capacity of the mouse distal gut microbiota during diet-induced obesity. Am J Physiol Endocrinol Metab. 2016;310:E982–E993. doi: 10.1152/ajpendo.00537.2015. 10.1152/ajpendo.00537.2015 PubMed PMID: 27117007, PMCID 4935139. [DOI] [PMC free article] [PubMed] [Google Scholar]
- 9.Choi JJ, Eum SY, Rampersaud E, Daunert S, Abreu MT, Toborek M. Exercise attenuates PCB-induced changes in the mouse gut microbiome. Environ Health Perspect. 2013;121:725–730. doi: 10.1289/ehp.1306534. 10.1289/ehp.1306534 PubMed PMID: 23632211, PMCID 3672930. [DOI] [PMC free article] [PubMed] [Google Scholar]
- 10.Campbell SC, Wisniewski PJ, Noji M, McGuinness LR, Haggblom MM, Lightfoot SA, Joseph LB, Kerkhof LJ. The Effect of Diet and Exercise on Intestinal Integrity and Microbial Diversity in Mice. PLoS One. 2016;11:e0150502. doi: 10.1371/journal.pone.0150502. 10.1371/journal.pone.0150502 PubMed PMID: 26954359, PMCID 4783017. [DOI] [PMC free article] [PubMed] [Google Scholar]
- 11.Batacan RB, Fenning AS, Dalbo VJ, Scanlan AT, Duncan MJ, Moore RJ, Stanley D. A gut reaction: the combined influence of exercise and diet on gastrointestinal microbiota in rats. J Appl Microbiol. 2017;122:1627–1638. doi: 10.1111/jam.13442. 10.1111/jam.13442 PubMed PMID: 28276612. [DOI] [PubMed] [Google Scholar]
- 12.Welly RJ, Liu TW, Zidon TM, Rowles J I, Park YM, Smith TN, Swanson KS, Padilla J, Vieira-Potter VJ. Comparison of Diet versus Exercise on Metabolic Function and Gut Microbiota in Obese Rats. Med Sci Sports Exerc. 2016;48:1688–1698. doi: 10.1249/MSS.0000000000000964. 10.1249/MSS.0000000000000964 PubMed PMID: 27128671, PMCID 4987217. [DOI] [PMC free article] [PubMed] [Google Scholar]
- 13.Kang SS, Jeraldo PR, Kurti A, Miller ME, Cook MD, Whitlock K, Goldenfeld N, Woods JA, White BA, Chia N, Fryer JD. Diet and exercise orthogonally alter the gut microbiome and reveal independent associations with anxiety and cognition. Mol Neurodegener. 2014;9:36. doi: 10.1186/1750-1326-9-36. 10.1186/1750-1326-9-36 PubMed PMID: 25217888, PMCID 4168696. [DOI] [PMC free article] [PubMed] [Google Scholar]
- 14.Petriz BA, Castro AP, Almeida JA, Gomes CP, Fernandes GR, Kruger RH, Pereira RW, Franco OL. 6/21/2014 Exercise induction of gut microbiota modifications in obese, non-obese and hypertensive rats. BMC Genomics. 2014;15:511. doi: 10.1186/1471-2164-15-511. 10.1186/1471-2164-15-511 PubMed PMID: 24952588, PMCID 4082611. [DOI] [PMC free article] [PubMed] [Google Scholar]
- 15.Clarke SF, Murphy EF, O’Sullivan O, Lucey AJ, Humphreys M, Hogan A, Hayes P, O’Reilly M, Jeffery IB, Wood-Martin R, Kerins DM, Quigley E, Ross RP, O’Toole PW, Molloy MG, Falvey E, Shanahan F, Cotter PD. Exercise and associated dietary extremes impact on gut microbial diversity. Gut. 2014;63:1913–1920. doi: 10.1136/gutjnl-2013-306541. 10.1136/gutjnl-2013-306541 PubMed PMID: 25021423. [DOI] [PubMed] [Google Scholar]
- 16.Barton, W, Penney, NC, Cronin, O, Garcia-Perez, I, Molloy, MG, Holmes, E, Shanahan, F, Cotter, PD, O’Sullivan, O, The microbiome of professional athletes differs from that of more sedentary subjects in composition and particularly at the functional metabolic level, Gut, 2017 [DOI] [PubMed]
- 17.Bressa C, Bailen-Andrino M, Perez-Santiago J, Gonzalez-Soltero R, Perez M, Montalvo-Lominchar MG, Mate-Munoz JL, Dominguez R, Moreno D, Larrosa M. 2017. Differences in gut microbiota profile between women with active lifestyle and sedentary women. PLoS One. 2017;12:e0171352. doi: 10.1371/journal.pone.0171352. 10.1371/journal.pone.0171352 PubMed PMID: 28187199, PMCID 5302835. [DOI] [PMC free article] [PubMed] [Google Scholar]
- 18.Allen, JM, Mailing, LJ, Niemiro, GM, Moore, R, Cook, MD, White, BA, Holscher, HD, Woods, JA, Exercise Alters Gut Microbiota Composition and Function in Lean and Obese Humans, Med Sci Sports Exerc, 2017 [DOI] [PubMed]
- 19.Orwoll E, Blank JB, Barrett-Connor E, Cauley J, Cummings S, Ensrud K, Lewis C, Cawthon PM, Marcus R, Marshall LM, McGowan J, Phipps K, Sherman S, Stefanick ML, Stone K. Design and baseline characteristics of the osteoporotic fractures in men (MrOS) study—a large observational study of the determinants of fracture in older men. Contemp Clin Trials. 2005;26:569–585. doi: 10.1016/j.cct.2005.05.006. 10.1016/j.cct.2005.05.006 PubMed PMID: 16084776. [DOI] [PubMed] [Google Scholar]
- 20.Blank JB, Cawthon PM, Carrion-Petersen ML, Harper L, Johnson JP, Mitson E, Delay RR. Overview of recruitment for the osteoporotic fractures in men study (MrOS) Contemp Clin Trials. 2005;26:557–568. doi: 10.1016/j.cct.2005.05.005. 10.1016/j.cct.2005.05.005 PubMed PMID: 16085466. [DOI] [PubMed] [Google Scholar]
- 21.Mackey DC, Manini TM, Schoeller DA, Koster A, Glynn NW, Goodpaster BH, Satterfield S, Newman AB, Harris TB, Cummings SR. Validation of an armband to measure daily energy expenditure in older adults. J Gerontol A Biol Sci Med Sci. 2011;66:1108–1113. doi: 10.1093/gerona/glr101. 10.1093/gerona/glr101 PubMed PMID: 21734231. [DOI] [PMC free article] [PubMed] [Google Scholar]
- 22.Colbert LH, Matthews CE, Havighurst TC, Kim K, Schoeller DA. Comparative validity of physical activity measures in older adults. Med Sci Sports Exerc. 2011;43:867–876. doi: 10.1249/MSS.0b013e3181fc7162. 10.1249/MSS.0b013e3181fc7162 PubMed PMID: 20881882, PMCID 3303696. [DOI] [PMC free article] [PubMed] [Google Scholar]
- 23.Van Remoortel H, Raste Y, Louvaris Z, Giavedoni S, Burtin C, Langer D, Wilson F, Rabinovich R, Vogiatzis I, Hopkinson NS, Troosters T. Validity of six activity monitors in chronic obstructive pulmonary disease: a comparison with indirect calorimetry. PLoS One. 2012;7:e39198. doi: 10.1371/journal.pone.0039198. 10.1371/journal.pone.0039198 PubMed PMID: 22745715, PMCID 3380044. [DOI] [PMC free article] [PubMed] [Google Scholar]
- 24.Sharif MM, Bahammam AS. Sleep estimation using BodyMedia’s SenseWear armband in patients with obstructive sleep apnea. Ann Thorac Med. 2013;8:53–57. doi: 10.4103/1817-1737.105720. 10.4103/1817-1737.105720 PubMed PMID: 23440703, PMCID 3573559. [DOI] [PMC free article] [PubMed] [Google Scholar]
- 25.Washburn RA, Smith KW, Jette AM, Janney CA. The Physical Activity Scale for the Elderly (PASE): development and evaluation. J Clin Epidemiol. 1993;46:153–162. doi: 10.1016/0895-4356(93)90053-4. 10.1016/0895-4356(93)90053-4 PubMed PMID: 8437031. [DOI] [PubMed] [Google Scholar]
- 26.Rillamas-Sun E, LaCroix AZ, Bell CL, Ryckman K, Ockene JK, Wallace RB. The Impact of Multimorbidity and Coronary Disease Comorbidity on Physical Function in Women Aged 80 Years and Older: The Women’s Health Initiative. J Gerontol A Biol Sci Med Sci. 2016;71(1):S54–S61. doi: 10.1093/gerona/glv059. 10.1093/gerona/glv059 PubMed PMID: 26858325, PMCID 5865533. [DOI] [PMC free article] [PubMed] [Google Scholar]
- 27.Pahor M, Chrischilles EA, Guralnik JM, Brown SL, Wallace RB, Carbonin P. Drug data coding and analysis in epidemiologic studies. Eur J Epidemiol. 1994;10:405–411. doi: 10.1007/BF01719664. 10.1007/BF01719664 PubMed PMID: 7843344. [DOI] [PubMed] [Google Scholar]
- 28.Boucher B, Cotterchio M, Kreiger N, Nadalin V, Block T, Block G. Validity and reliability of the Block98 food-frequency questionnaire in a sample of Canadian women. Public Health Nutr. 2006;9:84–93. doi: 10.1079/phn2005763. 10.1079/PHN2005763 PubMed PMID: 16480538. [DOI] [PubMed] [Google Scholar]
- 29.Rogers TS, Harrison S, Judd S, Orwoll ES, Marshall LM, Shannon J, Langsetmo L, Lane NE, Shikany JM. Dietary patterns and longitudinal change in hip bone mineral density among older men. Osteoporos Int. 2018;29:1135–1145. doi: 10.1007/s00198-018-4388-x. 10.1007/s00198-018-4388-x PubMed PMID: 29450584, PMCID 6842326. [DOI] [PMC free article] [PubMed] [Google Scholar]
- 30.Abrahamson M, Hooker E, Ajami NJ, Petrosino JF, Orwoll ES. Successful collection of stool samples for microbiome analyses from a large community-based population of elderly men. Contemp Clin Trials Commun. 2017;7:158–162. doi: 10.1016/j.conctc.2017.07.002. 10.1016/j.conctc.2017.07.002 PubMed PMID: 29250605, PMCID 5726580. [DOI] [PMC free article] [PubMed] [Google Scholar]
- 31.Lozupone C, Knight R. UniFrac: a new phylogenetic method for comparing microbial communities. Appl Environ Microbiol. 2005;71:8228–8235. doi: 10.1128/AEM.71.12.8228-8235.2005. 10.1128/AEM.71.12.8228-8235.2005 PubMed PMID: 16332807, PMCID 1317376. [DOI] [PMC free article] [PubMed] [Google Scholar]
- 32.Oksanen, J, Blanchet, FG, Friendly, M, Kindt, R, Legendre, P, McGlinn, D, Minchin, PR, O’Hara, RB, Simpson, GL, Solymos, P, Stevens, MH, Szoecs, E, Wagner, H, Community Ecology Package, 2018
- 33.Anderson MJ. A new method for non-parametric multivariate analysis of variance. Austral Ecology. 2001;26:32–46. [Google Scholar]
- 34.McArdle BH, Anderson MJ. Fitting multivariate models to community data: A comment on distance-based redundancy analysis. Ecology. 2001;82:290–297. 10.1890/0012-9658(2001)082[0290:FMMTCD]2.0.CO;2 [Google Scholar]
- 35.McMurdie PJ, Holmes S. phyloseq: an R package for reproducible interactive analysis and graphics of microbiome census data. PLoS One. 2013;8:e61217. doi: 10.1371/journal.pone.0061217. 10.1371/journal.pone.0061217 PubMed PMID: 23630581, PMCID 3632530. [DOI] [PMC free article] [PubMed] [Google Scholar]
- 36.Paulson JN, Stine OC, Bravo HC, Pop M. Differential abundance analysis for microbial marker-gene surveys. Nat Methods. 2013;10:1200–1202. doi: 10.1038/nmeth.2658. 10.1038/nmeth.2658 PubMed PMID: 24076764, PMCID 4010126. [DOI] [PMC free article] [PubMed] [Google Scholar]
- 37.Odamaki T, Kato K, Sugahara H, Hashikura N, Takahashi S, Xiao JZ, Abe F, Osawa R. Age-related changes in gut microbiota composition from newborn to centenarian: a cross-sectional study. BMC Microbiol. 2016;16:90. doi: 10.1186/s12866-016-0708-5. 10.1186/s12866-016-0708-5 PubMed PMID: 27220822, PMCID 4879732. [DOI] [PMC free article] [PubMed] [Google Scholar]
- 38.Scheppach W. Effects of short chain fatty acids on gut morphology and function. Gut. 1994;35:S35–S38. doi: 10.1136/gut.35.1_suppl.s35. 10.1136/gut.35.1_Suppl.S35 PubMed PMID: 8125387, PMCID 1378144. [DOI] [PMC free article] [PubMed] [Google Scholar]
- 39.Wrzosek L, Miquel S, Noordine ML, Bouet S, Joncquel Chevalier-Curt M, Robert V, Philippe C, Bridonneau C, Cherbuy C, Robbe-Masselot C, Langella P, Thomas M. Bacteroides thetaiotaomicron and Faecalibacterium prausnitzii influence the production of mucus glycans and the development of goblet cells in the colonic epithelium of a gnotobiotic model rodent. BMC Biol. 2013;11:61. doi: 10.1186/1741-7007-11-61. 10.1186/1741-7007-11-61 PubMed PMID: 23692866, PMCID 3673873. [DOI] [PMC free article] [PubMed] [Google Scholar]
- 40.Cushing K, Alvarado DM, Ciorba MA. Butyrate and Mucosal Inflammation: New Scientific Evidence Supports Clinical Observation. Clin Transl Gastroenterol. 2015;6:e108. doi: 10.1038/ctg.2015.34. 10.1038/ctg.2015.34 PubMed PMID: 26312412, PMCID 4816278. [DOI] [PMC free article] [PubMed] [Google Scholar]
- 41.Macfarlane GT, Macfarlane S. Fermentation in the human large intestine: its physiologic consequences and the potential contribution of prebiotics. J Clin Gastroenterol. 2011;45:S120–S127. doi: 10.1097/MCG.0b013e31822fecfe. 10.1097/MCG.0b013e31822fecfe PubMed PMID: 21992950. [DOI] [PubMed] [Google Scholar]