

Abstract
Inflammatory mechanisms contribute substantially to secondary tissue injury after brain ischemia. Regulatory T cells (Tregs) are key endogenous modulators of postischemic neuroinflammation. We investigated the potential of histone deacetylase inhibition (HDACi) to enhance Treg potency for experimental stroke in mice. HDACi using trichostatin A increased the number of Tregs and boosted their immunosuppressive capacity and interleukin (IL)-10 expression. In vivo treatment reduced infarct volumes and behavioral deficits after cortical brain ischemia, attenuated cerebral proinflammatory cytokine expression, and increased numbers of brain-invading Tregs. A similar effect was obtained using tubastatin, a specific inhibitor of HDAC6 and a key HDAC in Foxp3 regulation. The neuroprotective effect of HDACi depended on the presence of Foxp3+ Tregs, and in vivo and in vitro studies showed that the anti-inflammatory cytokine IL-10 was their main mediator. In summary, modulation of Treg function by HDACi is a novel and potent target to intervene at the center of neuroinflammation. Furthermore, this novel concept of modulating endogenous immune mechanisms might be translated to a broad spectrum of diseases, including primary neuroinflammatory and neurodegenerative disorders.
Introduction
Postischemic neuroinflammation has come into the focus of stroke research because inflammatory cascades contribute substantially to secondary brain damage (Dirnagl, 2004; Wang et al., 2007; Iadecola and Anrather, 2011) Among the various leukocyte populations invading the brain after stroke (Wang et al., 2007; Liesz et al., 2011b), T cells have been identified as particularly potent in mediating secondary tissue loss after brain ischemia (Shichita et al., 2009; Liesz et al., 2011b).
On the other hand, immunological reactions after tissue damage are tightly controlled by active regulatory mechanisms to avoid secondary tissue damage (Nathan, 2002). Regulatory T cells (Tregs) are a specialized T-cell subpopulation that maintains self-tolerance under physiological conditions (Sakaguchi, 2004) and prevents overactivation of the immune system in systemic and CNS inflammatory diseases (McGeachy et al., 2005). Recently, we identified an important neuroprotective immunomodulatory role of endogenous Tregs in stroke (Liesz et al., 2009a). This protective effect is mediated by interleukin (IL)-10, which reduces the microglial cell activation and neurotoxic cytokine secretion induced by invading leukocytes. Use of this potent endogenous mechanism by directly augmenting Tregs or their downstream signaling pathways has been proposed as a promising therapeutic concept because it may circumvent some of the problems encountered in previously unsuccessful anti-inflammatory stroke trials (Macrez et al., 2011; Brait et al., 2012). Indeed, targeting Tregs as the endogenous orchestrators of the postischemic immune response may be more effective than blocking only a particular inflammatory pathway (Eltzschig and Eckle, 2011; Iadecola and Anrather, 2011). The development and suppressive function of Tregs were tightly bound to the expression of their specific transcription factor, Foxp3 (Fontenot et al., 2003; Sakaguchi, 2004). Recent insights into the regulatory function of epigenetic activation at the Foxp3 gene locus have made it possible to experimentally induce Tregs (Tao et al., 2007).
Here, we investigate the potential of histone deacetylase inhibition (HDACi) to modulate postischemic neuroinflammation by boosting Treg and thereby improve stroke outcome as a paradigm of secondary neuroinflammation in sterile brain injury.
Materials and Methods
Animals
The study was conducted in accordance with national guidelines for the use of experimental animals, and the protocols were approved by German governmental committees (Regierungspraesidium Karlsruhe, Germany). We used age-matched male mice (C57BL/6J, 10–12 weeks old, 23–25 g body weight, Charles River Laboratories) unless stated otherwise. Tgε26 and Rag2−/− mice were bred in the core animal facility of the University of Heidelberg under specified pathogen-free conditions. Foxp3.LuciDTR-4 mice were bred at the central animal facility of the German Cancer Research Center under specified pathogen-free conditions. IL-10-GFP tiger mice were purchased from The Jackson Laboratory.
Reagents and administration
Trichostatin A (TsA; Alexis Biochemicals) and tubastatin A (TubA; Cayman Chemical) were dissolved in DMSO as stock solutions (trichostatin A: 2 mg/ml; tubastatin A: 20 mg/ml). Before administration, the stock solution was freshly diluted in saline and injected intraperitoneally in a total volume of 500 μl per mouse. The administered dose was always 1 mg/kg body weight of trichostatin A and 10 or 50 mg/kg tubastatin A, respectively. Control animals received an injection of DMSO diluted in saline at the same concentration as in the treatment groups. Mice received daily treatment starting 3 d before middle cerebral artery occlusion (MCAO).
Treg depletion
For Foxp3+ Treg depletion in Foxp3.LuciDTR-4 mice, we injected mice intraperitoneally with 15 ng/g body weight of active diphtheria toxin (Sigma-Aldrich) in PBS at the time points indicated in the experimental protocol (see Fig. 4c,f).
Figure 4.
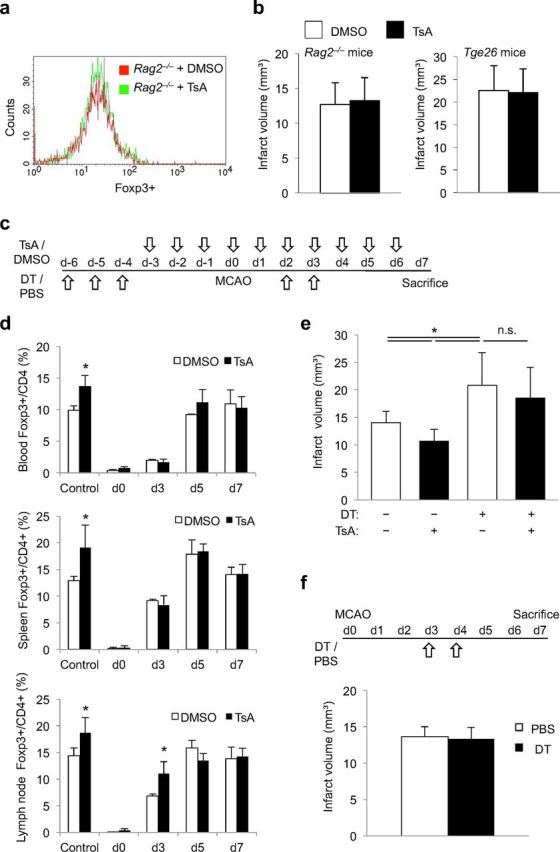
Reduction of infarct volume and neuroinflammation by HDACi is Treg dependent. a, Lymphocyte-deficient Rag2−/− mice were treated with TsA or control (DMSO). The representative histogram plot of the FACS analysis shows equal Foxp3 expression in the two treatment groups. b, Infarct volumes did not differ significantly between DMSO-treated control mice (white bars) and TsA-treated animals (black bars) in lymphocyte-deficient Rag2−/− mice (left, n = 12 per group, p = 0.67) and in lymphocyte- and NK cell-deficient Tgε26 mice (right, n = 7 per group, p = 0.89). c, Schematic overview of the treatment protocol for Treg depletion by DT injection and TsA treatment in Foxp3.LuciDTR-4 mice. d, Foxp3+ cell counts were determined by FACS analysis of blood, spleen, and mesenteric lymph nodes of control animals (PBS and DMSO treatment, no Treg depletion), and Treg-depleted animals (DT injected) receiving TsA or DMSO, respectively. Cell counts of Foxp3+ cells are presented as the percentage of the total CD4+ cell population and were measured at the indicated time points according to the treatment protocol shown above (three individual experiments per time point and treatment group). *Significant difference (p < 0.05) between DMSO and TsA treatment at the respective time point. e, Infarct volumes at 7 d after MCAO in control animals (PBS and DMSO treated) and in Treg-depleted mice (DT injection) receiving either DMSO or TsA according to the treatment protocol shown above (n = 18, two individual experiments; ANOVA, p = 0.008). Infarct volumes did not differ between DMSO- and TsA-treated animals after Treg-depletion (DT+). f, Mice received either DT injections for Treg depletion or PBS control treatment at days 3 and 4 after MCAO induction. Infarct volumes at 7 d after MCAO did not differ significantly (n = 10, p = 0.65).
Experimental stroke model
Experimental brain ischemia was induced by permanent transcranial coagulation of the MCA distal to the lenticulostriatal arteries. Mice were anesthetized with 1.0–2.0% halothane in O2/N2O. After making a 1 cm skin incision between the left eye and ear, a burr hole was drilled through the temporal skull. The dura mater was removed and the MCA was occluded permanently using a bipolar electrocoagulation forceps (ERBOTOM, ERBE). For laser Doppler measurements, we placed the probe (P403, Perimed) 3 mm lateral and 1 mm posterior to the bregma, and determined relative perfusion units (Periflux4001, Perimed). Only animals in which relative cerebral blood flow dropped to below 25% of the preischemic baseline after MCAO were included in the analysis. Sham operation was performed in the same manner as for MCAO but without coagulating the exposed MCA. During the operation, body temperature was kept at 37°C using a feedback-controlled heating pad. After suturing the skin lesion, the mice were placed in a cage under an infrared heating lamp until recovery from anesthesia. The overall mortality in the coagulation model was <5% during the 7 d observation period.
Assessment of infarct volume
We anesthetized the mice and perfused them transcardially with 20 ml of normal saline. We removed the brains from the skull and froze them immediately in isopentane (−20°C). We cut 20-μm-thick coronal cryosections every 400 μm, stained the sections using a standard cresyl violet staining protocol, scanned them at 600 dpi, and analyzed the infarct area on each section (ImageJ). The Swanson method was applied to indirectly measure the infarct area and to correct for cortical swelling: [ischemic area] = [cortex area of the contralateral side] − [nonischemic cortex area of the ipsilateral side]. The total infarct volume was determined by integrating measured areas and distances between sections.
Functional outcome test
For the “forelimb use asymmetry test,” mice were placed in a transparent glass cylinder (8 cm in diameter) and videotaped for 5 min. To assess independent use of left or right forelimb, we scored (1) contact of the cylinder wall with one forelimb during a full rear and (2) landing with only one forelimb at the cylinder bottom after a full rear using a video player with slow motion and frame-by-frame capabilities (VLC Media Player). At least 20 independent contacts were counted for one forelimb, and each experiment was performed twice, with a 1 h break for the mouse between testing. Forelimb use asymmetry was expressed as a ratio of right- and left-sided, independent forelimb use.
Flow cytometry
We collected blood samples and secondary immunological organs at various time points after MCAO for flow cytometric analysis of leukocyte subpopulations. We used a previously published protocol for quantitative FACS analysis and the respective gating strategy of leukocyte subpopulations infiltrating the brain (Liesz et al., 2011a,b). We stained single-cell suspensions for anti-mouse CD3 (17A2), CD4 (RM 4–5), CD25 (7D4), Foxp3 (FJK-16s), B220 (RA3–6B2), NK1.1 (PK136), Gr-1 (RB6–8C5), CD11b (M1/70), MHC-II (M5/114.15.2), and the appropriate isotype control antibody by following the manufacturer's protocols (eBioscience). We performed flow cytometry on a Becton Dickinson FACSCalibur and analyzed the data with CellQuest Pro software. Flow cytometric analysis of intracellular cytokine expression of the T-cell subpopulation was performed as previously described (Liesz et al., 2009a). Briefly, splenocytes were primed for 48 h with CD3- and CD28-specific antibodies without additionally polarizing the culture medium to detect interferon (IFN)-γ or by adding IL-4 and IL-2 (both 10 ng/μl; eBioscience) to the culture medium to detect IL-10 expression. Then, we restimulated cells for 5 h with ionomycin, phorbol 12-myristate 13-acetate (PMA), and brefeldin A before cell permeabilization and staining according to the manufacturer's protocol (Becton Dickinson). For analysis of IL-10 production by brain isolated leukocytes, cells were stimulated with PMA and ionomycin in the presence of GolgiStop (Becton Dickinson) for 4 h, and afterward were stained for CD3 (145–2C11), CD68 (FA-11), and IL-10 (JES5–16E3) using a Fix/Perm kit for cell permeabilization (Becton Dickinson).
Treg suppression assay
We isolated CD4+CD25+ cells from spleens derived from animals treated in vivo for 3 d with TsA or controls using a commercial MACS kit (Mouse Treg isolation kit, Miltenyi). CD4+CD25− cells were isolated from naive control animals by using the same kit and were labeled with carboxyfluorescein succinimidyl ester (CFSE; CFSE cell proliferation kit, Invitrogen). We stimulated 5 × 10⁵ CD4+CD25− effector cells with anti-CD3 (0.1 μg/ml; clone: 145–2C11) in coculture with 5 × 10⁵ irradiated splenic antigen-presenting cells and in the presence of various concentrations of CD4+CD25+ Tregs. Suppression of effector T-cell (Teff) proliferation was assessed at 72 h by analyzing the CFSE dilutions. Datasets were analyzed and processed for depiction in Figure 1d by using Flowjo 4.2 software (TreeStar). The percentage of Teff suppression was calculated as the difference in proliferating Teff cells under varying ratios of Teff/Treg compared with proliferation in pure Teff cultures.
Figure 1.

HDACi treatment increases Treg number and function and reduces infarct volumes. a, b, Animals were treated daily with 1 mg/kg TsA and the percentage of Foxp3+ cells within the CD4+ population was measured by flow cytometry in blood (a) and spleen (b). Each bar consists of n = 6 animals from three individual experiments. *p < 0.05 between naive control animals and the indicated group. c, Mean fluorescence intensity (MFI) for Foxp3 was calculated for the CD4+Foxp+ population in spleens 3 d after daily TsA or DMSO treatment. d, e, Animals were treated in vivo with TsA (1 mg/kg) or DMSO (control) for 3 d. Suppressive capacity of Tregs (CD25+) isolated from controls or TsA-treated animals was tested in vitro by analysis of responder T cells (Tresp, CD25−), which were isolated from naive untreated animals. d, Representative plots from the same experiment for treatment and control groups with fitted peaks for cell proliferation analysis by Flowjo software as used for suppression assay analysis. x-axis, CFSE fluorescence intensity (log); y-axis, cell number (lin). e, The graph depicts the percentage of suppression of Tresp proliferation compared with pure Tresp cell culture (0:1) at various concentrations of cocultured Tregs in both treatment groups. Tregs from TsA-treated mice showed a significantly increased suppressive function at 1:2 and 1:4 Treg/Tresp ratio compared with Tregs isolated from control animals. Data from seven individual experiments, n = 8 animals per experiment. *p < 0.05 between naive control animals and the indicated group. f, Representative cresyl violet-stained brain stacks of 20-μm-thick coronal brain sections (every 400 μm) of brains 7 d after brain ischemia in animals treated with DMSO (control) or TsA (1 mg/kg). g, Infarct volumes were measured 7 d after MCAO in DMSO-treated (white bars, control) and HDACi-treated (black bars, TsA) animals. TsA-treated animals had significantly smaller infarct volumes (n = 12 per group, 2 individual experiments).
RT-PCR
RNA was isolated from the two cerebral hemispheres using the RNeasy kit (Qiagen) or from isolated splenic Tregs using a commercial MACS kit (Mouse Treg isolation kit, Miltenyi). Samples were isolated from the animals after treatment according to the protocol and from the sham groups 24 h after the sham operation. Reverse transcription was performed with the High Capacity complementary DNA Archive Kit, and real-time PCR was performed with SYBR-Green assays on an ABI7500 real-time PCR system (Applied Biosystems). Primers were purchased as ready-to-use primer sets for each gene (SA Biosciences). All assays were run in duplicate. A linear dilution–amplification curve was obtained from diluted pooled samples. Using this curve, the expression of each gene was quantified relative to the expression of the housekeeping gene encoding for peptidylprolylisomerase A (cyclophilin), according to the relative standard curve method.
Western blot analysis
Tubulin and histone H3 acetylation.
Three days after in vivo treatment with TubA at the indicated dose, spleens were split in half. One half was homogenized in RIPA buffer for further analysis of tubulin expression. For histone Western blot analysis, acidic extraction using Triton X-100 buffer was performed. Protein concentrations were determined by BCA protein assays. Lysates were electrophoresed, transferred to nitrocellulose membranes, and blocked with milk (5%) for total proteins or with BSA (5%) for acetylated proteins. Blots were incubated with primary antibodies anti-H3 (ab1793), anti-acetylated H3 (ab10812), anti-tubulin (ab4074), and anti-acetylated tubulin (ab24610; all from Abcam). Peroxidase-conjugated goat anti-rabbit and rat anti-mouse secondary antibodies were used, respectively, and blots were developed by standard chemiluminescence protocols.
STAT3 Western blot.
Brain tissues from the whole infarcted hemispheres were homogenized in ice-cold RIPA buffer and 10% protease inhibitor cocktail (Sigma-Aldrich). After centrifugation, the supernatant was collected, and the protein concentration of each sample was determined in triplicate using Bradford reagent. Lysates underwent electrophoresis and then were transferred to nitrocellulose membranes. After blocking, blots were incubated with the following primary antibodies:rabbit anti-STAT3 (catalog #9132), anti-pSTAT3 (Tyr705, catalog #9131), and anti-pSTAT3 (Ser727, catalog #9134; all from Cell Signaling Technology). Blots were stained with rabbit anti-actin antibody (Sigma-Aldrich) to confirm equal loading and transfer. Peroxidase-conjugated goat anti-rat antibody was used as secondary antibody, and blots were detected using a standard chemical luminescence method. Serum-starved HeLa cell extracts served as nonphosphorylated negative controls (Cell Signaling Technology); IFN-α-treated HeLa cell extracts were used as positive controls for pSTAT3 (Tyr705).
Immunohistology
For immunofluorescence staining of CD3 and CD68, sections were fixed in 4% paraformaldehyde (PFA). After blocking, the sections were incubated with either monoclonal hamster anti-mouse-CD3e (eBioscience) or monoclonal rat anti-mouse-CD68 (AbD Serotec) at 4°C overnight and then incubated with corresponding Cy3-conjugated secondary antibodies (Jackson ImmunoResearch). Images were captured automatically with a 40× magnification (0.23 μm/pixel) on a NanoZoomer 2.0-HT scan system (Hamamatsu Photonics); two independent researchers blinded to the treatment groups then analyzed consecutive images acquired in high-power fields. For analysis of IL-10 (GFP) expression from IL-10-GFP reporter mice, we obtained images from six high-power fields in the peri-infarct region surrounding the ischemic core and in corresponding regions of the contralateral hemisphere, converted the images into gray scale, and measured the mean gray value of the images (ImageJ, version 1.43u).
Combination of histochemistry and in situ hybridization
Dual labeling for CD3 protein and IL-10 mRNA was accomplished to determine expression of IL-10 transcripts in T cells. After first incubating the brain slices with the primary antibody, they were incubated with biotinylated secondary antibodies and then were exposed to chromagen 3,3′-diaminobenzidine tetrahydrochloride (0.05%) and 0.003% hydrogen peroxide (H2O2). Thereafter, tissues were desiccated under vacuum, fixed in 4% PFA, digested by proteinase K, acetylated in 0.25% acetic anhydride in 0.1 m triethanolamine, and briefly dehydrated in ethanol solutions. After drying, hybridization mixture was spotted on each slide, sealed under a coverslip, and incubated at 60°C overnight. Coverslips were removed; the slides were rinsed and then digested by RNAseA, rinsed in descending concentrations of SSC, and dehydrated again. Sections were exposed to an x-ray film (Kodak) for 3 d at 4°C, defatted in xylene, and dipped into NTB nuclear emulsion (Kodak). Slides were exposed for 15 d, developed in D19 developer (Kodak) for 3.5 min at 15°C, and fixed in Rapid Fixer (Kodak) for 5 min.
cRNA probe synthesis and preparation
The PCRII topoplasmids containing the full-length coding sequence of the mouse IL- 10 cDNA were cloned and linearized with EcoRV for the antisense riboprobes. Radioactive cRNA copies were synthesized, unincorporated nucleotides were removed, and a solution with a concentration of 107 cpm of probe was spotted on the slides.
Statistical analysis
All values in bar graphs are expressed as the mean ± SD. We analyzed infarct volumes by two-tailed Student's t test between two groups and ANOVA for multiple comparisons with post hoc Tukey's test, respectively, after validating the normal distribution of these datasets (Kolmogorov–Smirnov test). For the remaining data, we used a two-tailed Wilcoxon rank-sum test for comparison between two groups; for three and more groups, we applied the Kruskal–Wallis H test with Dunn's post hoc testing, using GraphPad Prism 5 software. p < 0.05 was considered statistically significant for all tests.
Results
HDACi increases Treg function and ameliorates neuroinflammation
Daily treatment of mice with the HDACi TsA resulted in a sustained increase in the CD4+/Foxp3+ Treg ratio within the total CD4+ T-helper cell population. The Foxp3/CD4 ratio was significantly higher beginning 24 h after first treatment in the blood (Fig. 1a) and after 3 d of daily treatment in the spleen (Fig. 1b) than in control animals. Not only was the proportion of Tregs within the CD4+ population increased, but Foxp3 expression per Treg was also significantly higher in spleens after daily TsA treatment for 3 d as indicated by Foxp3 mean fluorescence intensity (Fig. 1c). Moreover, we detected a significant increase in the suppressive capacity of Tregs following TsA treatment (Fig. 1d,e), in accordance with a previous report (Tao et al., 2007). Treatment with TsA resulted in a significantly decreased infarct volume compared with control animals 7 d after inducing MCAO (Fig. 1f,g). We additionally tested the effect of TubA, a newly developed, specific inhibitor of HDAC6 (Butler et al., 2010), which is the main HDAC involved in Foxp3 regulation and Treg function (de Zoeten et al., 2011). At a dose of 10 mg/kg, and even more pronounced at a dose of 50 mg/kg (daily for 3 d), tubastatin A induced a significant increase in tubulin but not H3 histone acetylation, indicating the specificity of this drug for HDAC6 substrates (Fig. 2a). We detected a dose-dependent effect of TubA treatment on Foxp3 mRNA (Fig. 2b) and protein (Fig. 2c) expression; however, only the higher dose significantly increased Foxp3 expression in spleens after daily treatment for 3 d. Daily treatment with 50 mg/kg TubA resulted in significantly smaller infarct volumes (Fig. 2d) and improved behavioral motor deficits assessed by the forelimb use asymmetry test (Fig. 2e,f) compared with control animals.
Figure 2.
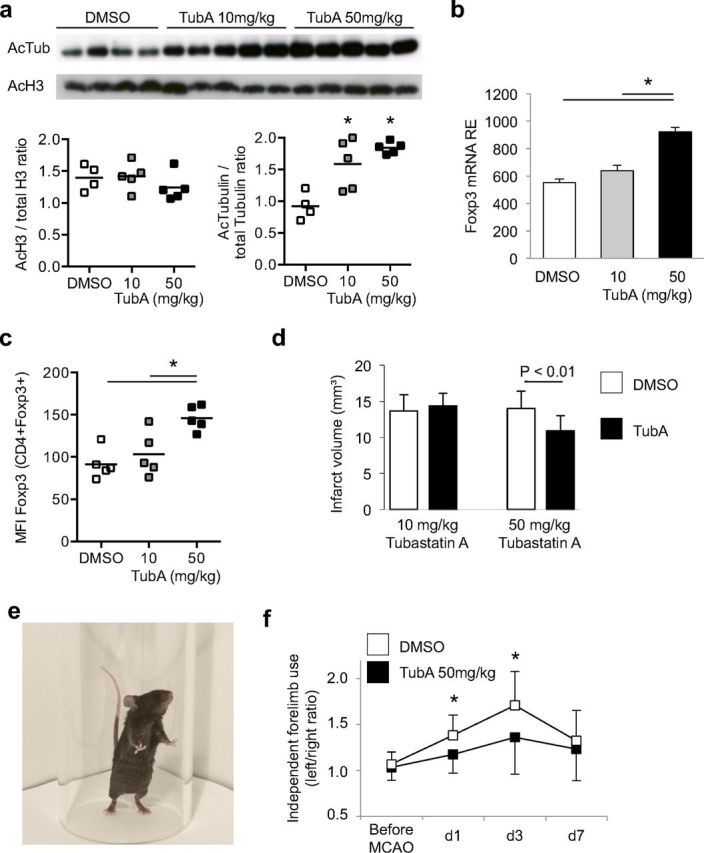
HDAC6-specific inhibition increases neuroprotective Foxp3 expression. a, Acetylation of histone H3 and the HDAC6-specific substrate tubulin was analyzed by Western blot after 3 d of daily treatment with DMSO, 10 or 50 mg/kg TubA. Representative blots are shown for acetylated tubulin (55 kDa) and H3 (15 kDa). TubA treatment significantly (*p < 0.05, ANOVA) increased the ratio of acetylated/total tubulin but had no effect on H3 acetylation. b, Mice were treated daily for 3 d with DMSO or TubA at the indicated dose, and Foxp3 mRNA expression was measured in Tregs isolated from spleens. High-dose treatment with TubA (50 mg/kg), but not the lower dose, induced an increase in Foxp3 mRNA expression (n = 5 per group, *p < 0.05 between indicated groups). c, Corresponding to mRNA expression, Foxp3 protein expression measured by mean fluorscence intensity (MFI) in CD4+Foxp3+ Treg cells was significantly increased in animals treated with high-dose TubA (n = 5 per group, *p < 0.05 between indicated groups). d, Mice received treatment with the HDAC6-specific HDACi TubA at a dose of 10 mg/kg (left) or 50 mg/kg (right). Only the high dose resulted in significant infarct volume reduction compared with control animals (n = 15 per group, three individual experiments). e, f, Behavioral deficits after experimental stroke were assessed by the forelimb use asymmetry test. Results are presented as the ratio of independent left/right forelimb use during spontaneous rearing and landing movements in a glass cylinder. High-dose TubA treatment significantly reduced motor deficits at day 1 (d1) and d3 after stroke induction compared with DMSO-treated control animals.
Animals treated with TsA presented with significantly lower cerebral expression levels of the proinflammatory marker cytokines tumor necrosis factor (TNF)-α and IL-1β (Fig. 3a), which were previously shown to be neurotoxic after experimental brain ischemia (Rothwell and Luheshi, 2000; Yilmaz et al., 2006; Liesz et al., 2009a). In contrast, cerebral expression of the anti-inflammatory cytokine IL-10 was significantly increased by TsA treatment at 3 and 5 d after MCAO in both hemispheres compared with control animals (Fig. 3a). Flow cytometric analysis of brain-invading leukocytes (Fig. 3b,c) revealed that the numbers of most invading leukocyte subsets and especially of CD3+ T cells, B cells, and NK cells were not altered at 5 d after MCAO (Fig. 3c) except for the absolute number of Foxp3+ Tregs and the proportion of these cells in the CD3+ T-cell population, which were specifically increased by TsA treatment (Fig. 3d). Together, these data support a selective effect of TsA on the expansion of Foxp3+ regulatory cells and the suppression of poststroke upregulation of inflammatory cytokine expression.
Figure 3.
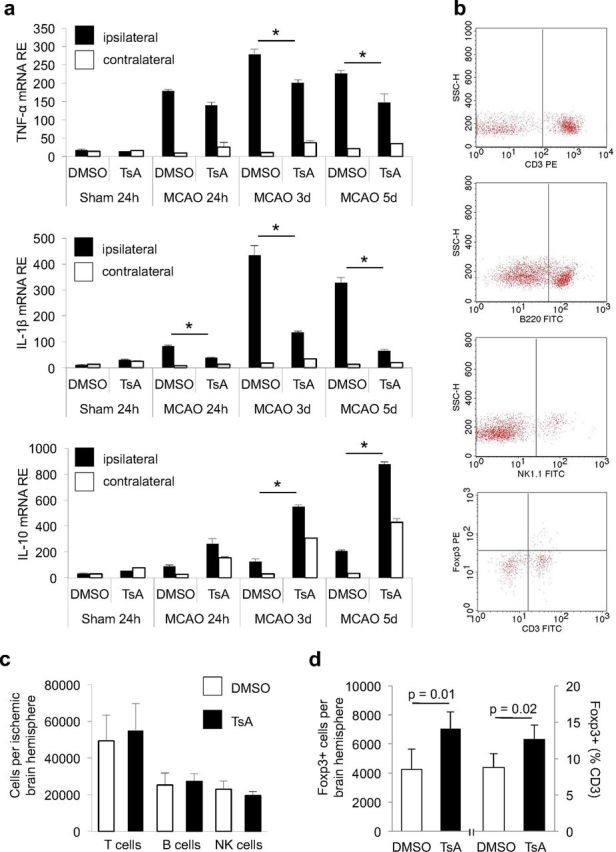
Effects of HDACi treatment on humoral and cellular neuroinflammation. a, RNA expression of the proinflammatory cytokines TNF-α and IL-1β, and of the anti-inflammatory cytokine IL-10 was measured by RT-PCR at the indicated time points after MCAO in ipsilateral (ischemic, white bars) and contralateral (nonischemic, black bars) hemispheres of DMSO- and TsA-treated mice. Data are depicted as relative expression values normalized to the housekeeping gene Ppia (n = 10 per group, two individual experiments). b, Cell numbers were measured quantitatively by flow cytometry of brain homogenates of the total ischemic hemisphere at 5 d after MCAO. Representative original FACS plots for T cells (CD3), B cells (B220), and NK cells (NK1.1), and Foxp3+CD3+ Tregs after sorting for lymphocytes by scattergram analysis and CD45+ expression. c, Cell numbers of total invading CD45+ leukocytes and the T-cell (CD3+), B cell (B200+), and NK-cell (panNK+) populations did not differ between DMSO-treated (control, white bars) and TsA-treated (black bars) animals; three individual experiments, two to three brains pooled per group and experiment. d, The absolute number of Foxp3+ cells per ischemic hemisphere was significantly increased in TsA-treated animals compared with DMSO-treated controls (left side). Also the relative proportion of Foxp3+ cells within the CD3+ T-cell population was significantly increased by HDACi (right side). Five individual experiments, three to four brains pooled per group and experiment.
The neuroprotective TsA effect is mediated by Tregs
HDAC inhibitors have pleiotropic effects beyond lymphocyte modulation, and therefore we examined the impact of the presence of lymphocytes for the observed protective effects. We treated T-cell- and B-cell-deficient Rag2−/− mice or T-cell- and NK-cell-deficient Tge26 mice with TsA. As expected, we did not detect the induction of Foxp3+ cells in Rag2−/− mice (Fig. 4a). Moreover, TsA treatment did not affect infarct volumes in either of the lymphocyte-deficient mouse strains 7 d after MCAO (Fig. 4b).
To determine whether the neuroprotective effect of TsA depends specifically on the presence of Tregs, we used the previously characterized model of diphteria toxin (DT)-mediated selective Treg depletion in Foxp3.LuciDTR-4 mice (Suffner et al., 2010). Mice were treated with DT or PBS for 3 consecutive days followed by treatment for 3 d with TsA or control, and MCAO was induced on the next day (Fig. 4c). This treatment reduced CD4+Foxp3+ cell numbers by ∼80–90% at the time of MCAO induction, similarly in DMSO- and TsA-treated animals (Fig. 4d). In accordance with our previous report (Liesz et al., 2009a), Treg depletion significantly increased infarct volume 7 d after MCAO in this paradigm too (Fig. 4e); this is in contrast to a brief report in which a similar transgenic DT model was used (Ren et al., 2011). DT treatment of Foxp3.LuciDTR-4 mice on day 3 and day 4 did not result in increased infarct volumes at 7 d after MCAO compared with control animals in which Tregs were not depleted (Fig. 4f). Thus, the immunosuppressive properties of Tregs are crucial within the first 3 d after brain ischemia. Importantly, TsA treatment in the Foxp3.LuciDTR depletion model had no effect on Foxp3+ expression except for a transient increase in Foxp3 expression lymph nodes at day 3 (Fig. 4d) and did not significantly reduce infarct volumes compared with Treg-depleted and DMSO-treated controls (Fig. 4e).
An important mechanism of delayed infarct growth induced by Treg depletion in our previous experiments was the increase in proinflammatory cytokine expression (Liesz et al., 2009a). Consistent with these findings, postischemic cerebral expression of IL-1β, IL-17, TNF-α, and IFN-γ was also augmented after DT-mediated Treg depletion (Fig. 5). In contrast to the marked reduction in poststroke cytokine expression induced by TsA in naive mice (Fig. 3a), TsA treatment in Treg-depleted mice only significantly reduced the excess production of TNF-α and IFN-γ at 3 d after MCAO. Overall, these findings indicate a crucial role for Tregs in TsA-induced neuroprotection and immunomodulation after brain ischemia.
Figure 5.

HDACi does not reduce neuroinflammation in Treg-deficient animals. Cerebral RNA expression for proinflammatory cytokines was measured by RT-PCR at the indicated time points in three groups. Foxp3.LuciDTR-4 mice received either DT for Treg depletion or control injections and were treated with DMSO or TsA according to the treatment protocol shown in Figure 4c. Data are shown as relative expression (RE) for mRNA of IL-1β, IL-17, TNF-α, and IFN-γ in the ipsilateral (ischemic, black bars) and contralateral (nonischemic, white bars) hemispheres. Horizontal lines indicate significant differences between groups at the respective time point (n = 5 per group, two to three individual experiments).
Interleukin-10 overexpression by T cells is the main effector of immunosuppression by HDACi
We further analyzed the mechanisms underlying the immunosuppressive effect of HDACi on poststroke neuroinflammation. Previous reports indicated an anti-inflammatory effect of HDACi with suppression of proinflammatory cytokines and upregulation of IL-10 expression (Tao et al., 2007; Lucas et al., 2009). Furthermore, IL-10 is a major anti-inflammatory mediator in poststroke neuroinflammation (Spera et al., 1998; Liesz et al., 2009a). Therefore, we assessed IL-10 expression in T cells after in vivo treatment for 3 d with TsA or DMSO. TsA-treated mice showed significantly higher IL-10 expression in both Foxp3+ Tregs (Fig. 6a) and in the total CD4+ T-helper cell population (Fig. 6b). In contrast, IFN-γ production did not differ in Teff (CD25−) from TsA- or DMSO-treated mice that were restimulated in vitro in the absence of CD25+ Tregs (Fig. 6c). These findings already suggested that TsA boosts IL-10 expression in T-helper cells and predominantly in Tregs, and that its suppressive effect on Teff depends on the presence of Tregs. We further investigated this phenomenon in experiments in which IL-10 was antagonized. Again, mice were treated in vivo for 3 d with TsA or DMSO, and splenocytes were restimulated in vitro to detect IFN-γ production by flow cytometry. During this in vitro restimulation, neutralizing anti-IL-10 antibodies or control IgG antibodies were added to the culture medium (Fig. 6d). CD4+ T cells from TsA-treated animals exhibited significantly less IFN-γ expression than did cells from control animals under normal, nonpolarizing culture conditions (Fig. 6e). In contrast, IFN-γ expression was higher in CD4+ T cells that were stimulated together with neutralizing IL-10 antibodies than under normal culture conditions, and TsA- and DMSO-treated animals no longer differed in terms of IFN-γ-expressing cells within the CD4+ T-cell population (Fig. 6e).
Figure 6.
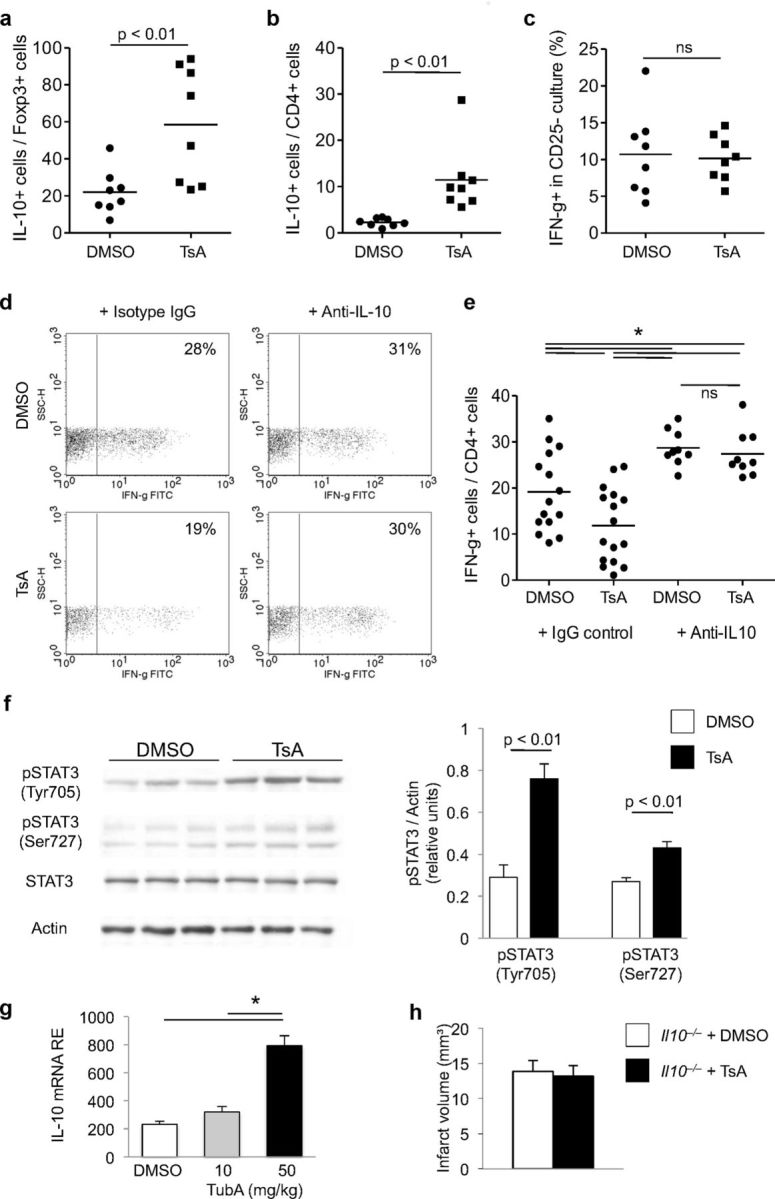
IL-10 is the main Treg-derived mediator of the anti-inflammatory HDACi effect. a–c, Flow cytometric analysis of intracellular protein expression of IL-10 (a, b) or IFN-γ (c) in splenocytes derived from animals treated in vivo with DMSO or TsA. Data are depicted as the relative proportion of cytokine-expressing cells per Foxp3+ cell population (a), total CD4+ T-helper cell population (b), and CD25− T-effector cell population (c). Dots represent individual mice; horizontal lines mark the median of each group (n = 8–9, three to four individual experiments). d, e, Representative original dot plots (d) and statistical analysis (e; ANOVA with Tukey's post hoc testing) of intracellular flow cyometry for IFN-γ expression per total CD4+ T-helper cell population (shown as percentage) from mice treated in vivo with DMSO or TSA and splenocytes treated in vitro with isotype control antibody (IgG control) or anti-IL10 neutralizing antibodies. CD4+ splenocytes from TsA-treated mice produced less IFN-γ than those from DMSO-treated control animals; however, when IL-10 was neutralized in vitro, no difference could be detected. Dots represent individual mice; horizontal lines mark the median of each group (n = 16, IgG control; n = 9, Anti-IL10; three to six individual experiments). f, Representative original Western blots for total STAT3 (STAT3), phosphorylated tyrosine705 (Tyr705) and serine727 (Ser727) STAT3 residues, and actin loading control from brain homogenates of three DMSO-treated and three TsA-treated mice at 5 d after MCAO. Each lane represents protein samples from the same individual. Analysis of phosphorylated STAT3 protein expression (Tyr705 and Ser727) normalized to actin from DMSO-treated (control) and HDACi-treated (TsA) mice 5 d after MCAO (n = 9 per group, three individual experiments). g, Relative IL-10 mRNA expression (RE) was analyzed in splenic Tregs after 3 d of daily treatment with either DMSO or TubA at the indicated dose. Only high-dose TubA treatment resulted in significantly increased IL-10 expression in isolated Tregs. h, Infarct volumetry at 7 d after MCAO of IL-10-deficient transgenic Il10−/− mice treated with DMSO or TsA. No significant difference of infarct size was detected (n = 10 per group, two individual experiments, p = 0.45).
To unveil the biological significance of IL-10 overexpression in the in vivo setting of neuroinflammation after ischemic stroke, we analyzed signal transducers and activators of transcription 3 (STAT3) phosphorylation. STAT3 is a key molecule involved in intracellular signal transduction after extracellular binding of IL-10 to its receptor via STAT3 phosphorylation and translocation to the nucleus (Fickenscher et al., 2002; Murray, 2006). Phosphorylation of STAT3 at Tyr705 and also at Ser727 was significantly higher in brain homogenates of TsA-treated animals than in controls, while overall expression of STAT3 was unchanged between treatment groups (Fig. 6f). These findings, together with increased IL-10 expression after TsA treatment, indicate that TsA treatment activates intracellular IL-10 downstream pathways. We also detected significantly increased cerebral IL-10 mRNA expression after high-dose (50 mg/kg) treatment with the HDAC6-specific HDACi tubastatin A compared with controls (DMSO) and to low-dose treatment (Fig. 6g). The important role of IL-10 for mediating the neuroprotective HDACi effect was underscored by experiments in IL-10 knock-out mice that were treated with TsA or DMSO. Seven days after MCAO, infarct volumes did not differ between treatment groups in Il10−/− mice (Fig. 6h).
T cells are the main source of HDACi-boosted interleukin-10 production
Our previous experiments had shown the importance of Tregs and IL-10 as mediators of HDACi-mediated neuroprotection. Indeed, the kinetics, source, and distribution of cerebral IL-10 expression after stroke had barely been characterized; therefore, we used IL-10-GFP reporter mice (IL10-GFP) in these experiments as IL-10-producing cells can be monitored by EGFP knocked into the IL-10 gene. While only very low IL-10 expression (i.e., EGFP fluorescence) was detected in brains of nonischemic animals, GFP fluorescence could be detected 24 h later and was strongly augmented 5 d after brain ischemia. IL-10 expression was localized at the border zone surrounding the infarct (Fig. 7). To characterize the differential kinetics and cellular source of IL-10 expression, we performed flow cytometric analysis of intracellular IL-10 protein expression in T cells and monocytes at 1, 3, and 7 d after MCAO (Fig. 8a). This analysis revealed an early increase of IL-10-producing CD68+ monocytes peaking at 3 d after MCAO, while the migration of IL-10-producing T cells was delayed and peaked only at 7 d after MCAO (Fig. 8a). Moreover, TsA treatment significantly increased the IL-10-GFP fluorescence intensity in the ischemic hemisphere at 5 d after stroke (Fig. 8b). We costained IL-10-GFP with CD3+ for T cells and CD68+ for monocytes invading the ischemic brain at day 5 (Fig. 8c). Quantitative analysis revealed that CD68+ monocytes constituted the majority of IL-10-producing cells. However, only 12% of monocytes, but as many as 45% of CD3+ T cells, produced IL-10. Interestingly, using flow cytometry to detect the proportion of IL-10-producing cells in the CD68+ and CD3+ population, we detected similar IL-10 production in both populations with ∼7–8% IL-10+ cells (Fig. 8a). This discrepancy might be due to the fundamental methodological differences of stimulated cell analysis for flow cytometry and visualization of intrinsic IL-10 production in the IL-10-GFP reporter mice. Moreover, TsA treatment significantly increased IL-10 expression selectively in the CD3+ T-cell population (control: 45.5 ± 7.8%; TsA: 87.8 ± 7.1%; n = 5, p < 0.01), while it remained unchanged within the CD68+ monocyte population (Fig. 8c). Using in situ hybridization for IL-10 mRNA in combination with CD3 histochemistry as a confirmatory method, we also found IL-10 expression in T cells at the mRNA level (Fig. 8d).
Figure 7.
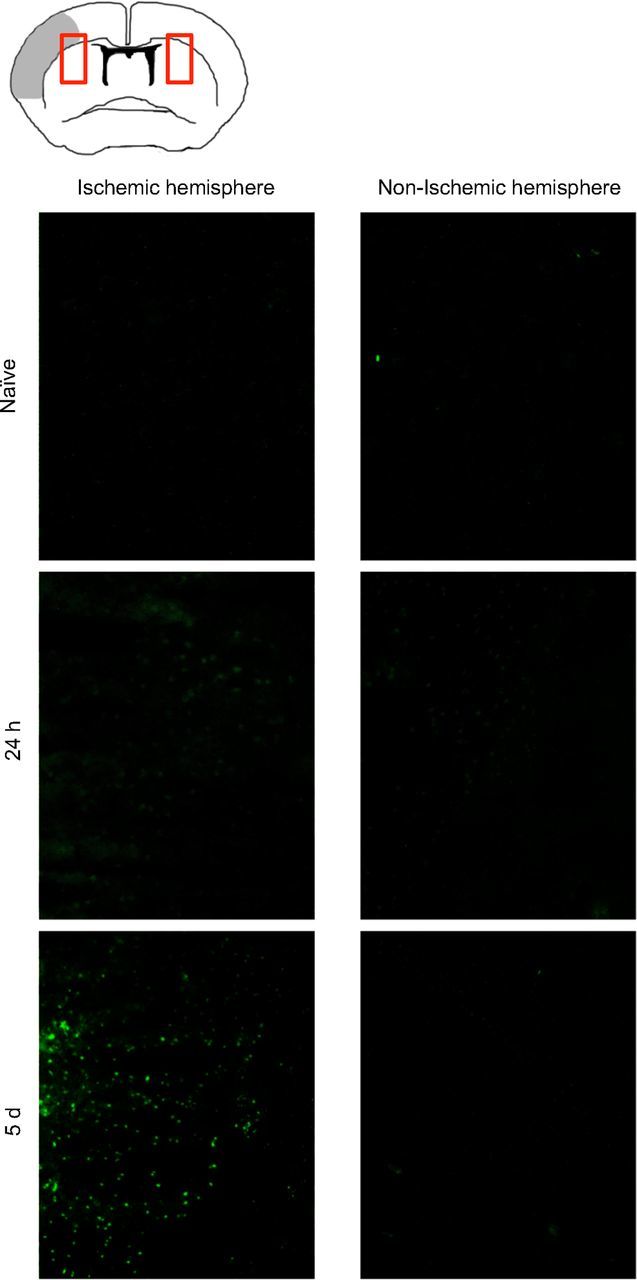
IL-10 expression is delayed after ischemia in the peri-infarct area. Representative images from indicated fields of view (see red boxes in schematic image) of coronal brain sections at the bregma at 24 h and 5 d after brain ischemia (gray area in the schematic overview indicates infarct core) and naive IL-10-GFP tiger mice. Sections were not stained or otherwise enhanced with fluorescence; GFP expression represents IL-10-expressing cells in the peri-infarct area of the IL-10 reporter mice.
Figure 8.
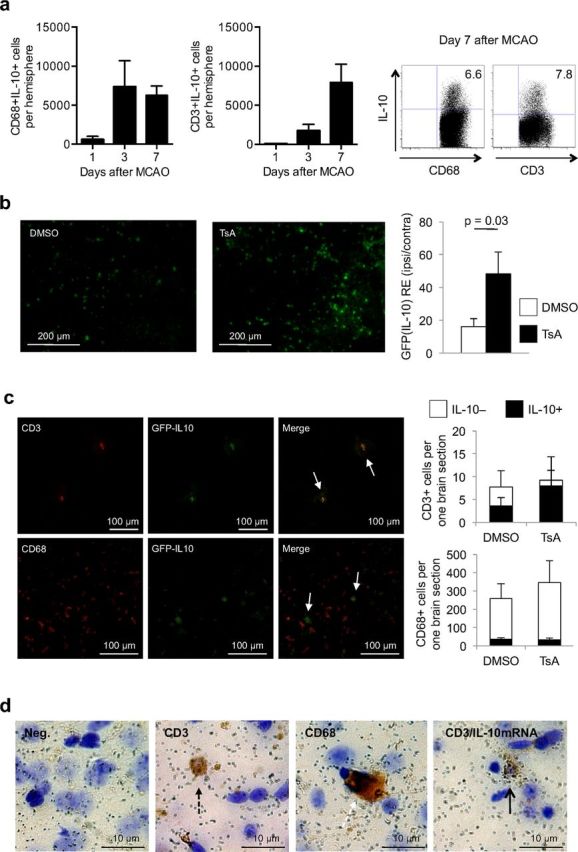
T cells are the main source of increased IL-10 production in HDACi-treated mice after stroke. a, Flow cytometric analysis of intracellular IL-10-expressing CD68+ monocytes (left) and CD3+ T cells (middle) at the indicated time points (absolute cell number per one ischemic hemisphere, three individual experiments, two to three pooled animals per experiment). Right, Representative dot plots of CD68+IL10+ and CD3+IL10+ cells, respectively, 7 d after MCAO induction. b, Representative images from the peri-infarct region at the site of the bregma (left) and statistical analysis (right) of mean GFP (IL-10) intensity of the ischemic hemispheres normalized to values of corresponding regions of the nonischemic hemisphere from TsA- and DMSO-treated IL-10-GFP reporter mice [n = 5 per group, mean of six regions each (see Materials and Methods), two individual experiments]. c, Left, Representative images at the border zone surrounding the infarct from IL-10-GFP reporter mice for naive GFP (IL10) expression, costaining for CD3 or CD68 and the corresponding overlay image at 5 d after brain ischemia. Arrows depict CD3 or CD68 and GFP (IL-10) double-positive cells, respectively. Right, Analysis of GFP (IL10) expression in colocalization with CD68+ monocytes (left) and CD3+ T cells (right) in TsA- and DMSO-treated mice. Cell numbers are indicated as absolute cell numbers per one section of the total ischemic hemisphere at the location of the bregma. Open bars, IL-10-negative cells; black bars, IL-10-positive cells (n = 6 per group). d, Representative images of brain sections analyzed for IL-10 mRNA expression by in situ hybridization for IL-10 mRNA and costained for T cells and CD68+ monocytes. Images depict negative immunohistological staining with silver grain background signal (left), a single positive CD3+ T cell (broken black arrow), a single positive CD68+ monocyte (broken white arrow), and a T cell (black arrow) double-positive for CD3 (brown staining) and IL-10 expression (silver grain cluster).
Discussion
Secondary neuroinflammation after brain ischemia shares many pathways with primary neuroinflammatory, traumatic, and neurodegenerative diseases, thereby opening new opportunities for translational approaches and novel therapeutic interventions (Zipp and Aktas, 2006). This is the first study to investigate Tregs and their downstream effectors as central targets of immunomodulatory therapy for secondary neuroinflammation after acute brain injury. The main findings of our study are that HDAC inhibitors are potent inducers of Foxp3 expression and enhance the cerebral anti-inflammatory function of Tregs. Treatment with HDACi reduces the infarct volume by suppressing the T-cell-dependent proinflammatory reaction to tissue damage in the brain. The main mechanism of the HDACi-mediated cerebroprotective effect is the increase in IL-10-production, which constrained postischemic cerebral inflammatory gene upregulation.
Previous immunomodulatory therapeutic approaches in stroke mainly attempted to block selective deleterious inflammatory pathways, including early cytokine messengers (e.g., IL-1) and leukocyte invasion, and many of these putative immunotherapies failed because alternative or redundant inflammatory mechanisms compensated for this (Crosio et al., 2011; Liesz et al., 2011a; Frangogiannis, 2012). The conceptual approach of the present study was different in that we targeted Tregs, the endogenous master switch of inflammation under physiological and pathological conditions (Shevach et al., 2006; Liesz et al., 2009a). Beyond the utilization of their multitargeted intrinsic signaling pathways, therapeutic modulation of Tregs may have the advantage of not aggravating systemic immunosuppression, which might be deleterious in the face of increased susceptibility to infections after stroke (Meisel et al., 2005; Chamorro et al., 2007). Tregs function by downregulating activated inflammatory cascades in their target cells (Sakaguchi et al., 2010); thus, boosting Treg function improves the ability to limit an overactivation of the immune response. In contrast, many immunosuppressive agents downregulate the resting immune system, inducing a potentially harmful immune dysfunction. In the experiments using the Foxp3.LuciDTR-4 animal models for Treg depletion, we confirm our previous findings using antibody-mediated Treg depletion or selective adoptive lymphocyte transfer (Liesz et al., 2009a) on the critical role of Tregs in modulating postischemic neuroinflammation. In contrast to a recent report that proposes a negative impact of Treg cells on infarct outcome in the acute phase after stroke in a model of large ischemic brain injury (Kleinschnitz et al., 2013), we and others (Ren et al., 2011; Stubbe et al., 2013) did not detect a significant effect of Treg depletion in models of extensive brain infarction. Throughout this study, therefore, we used a model of permanent distal MCAO, resulting in moderately sized infarct volumes of ∼15% of the hemisphere and inducing robust postischemic neuroinflammation (Zhou et al., 2013), which corresponds to the majority of human strokes (Carmichael, 2005; Howells et al., 2010).
HDAC inhibitors represent a class of compounds that interfere with the function of HDACs, which are important regulators of epigenetic modification, cell cycle, and transcription (de Ruijter et al., 2003). Most of the currently used HDAC inhibitors are nonspecific inhibitors of several of the 18 known mammalian HDACs. Trichostatin A is the most potent known HDAC inhibitor and serves as the reference substance in HDACi research. HDAC inhibitors potently induce Foxp3 expression in regulatory cells, improve Foxp3-DNA binding, reduce Foxp3 turnover by ubiquitination, and also convert naive T cells to a regulatory phenotype (Tao et al., 2007; Akimova et al., 2010). On the other hand, inhibition of HDACs is a rather unselective means of interfering with epigenetic modification, and the resulting effect crucially depends on the choice of the HDACi substance, the investigated target organ, and the disease model. To increase target specificity of HDACi, current research is focusing on developing selective HDAC inhibitors such as tubastatin A, which is ∼7000-fold more selective for HDAC6 than other HDACs and may avoid the cytotoxic side effects of pan-HDACi (Butler et al., 2010). HDAC6 has been shown to be the predominant type of HDAC involved in the regulatory function of Tregs (Kalin et al., 2012). Our study is the first to demonstrate cerebroprotective properties of this new drug in secondary neuroinflammation.
Our present findings (re-)discovered IL-10 to be not only a major signaling molecule of Tregs but also a key immunoregulatory cytokine and a promising therapeutic mediator in stroke. In previous studies, systemic or intracerebroventricular IL-10 administration reduced neuroinflammation and improved outcome after brain ischemia (Frenkel et al., 2005; Liesz et al., 2009a). However, these approaches either were invasive or have been discouraged by concerns that increased systemic IL-10 concentrations may be associated with infectious complications after stroke (Chamorro et al., 2006). Moreover, the biology of IL-10 signaling in the ischemic brain was barely characterized. We demonstrated that IL-10-producing cells are topographically localized in the peri-infarct region and analyzed the cellular source. While monocytes are the major IL-10 producers after brain ischemia, HDAC inhibitors induced IL-10 production predominantly in brain-infiltrating T cells. Additionally, administration of HDAC inhibitors increased the phosphorylation of STAT3, which is a key transcription factor activated by IL-10 and results in the inhibition of proinflammatory cascades and upregulation of neurotrophic factors (Planas et al., 2006; Murray, 2007). Surprisingly, we did not detect an increased infarct volume in IL-10 knock-out animals compared with wild-type animals, which might be attributed to alternative, compensating cytokine pathways and might limit the value of this transgenic animal model. However, we did not detect a difference in stroke outcome between control and HDACi-treated Il10−/− mice, further supporting the role of IL-10 for the HDACi-mediated effect.
The limitation of HDACi for acute stroke treatment is that it boosts Treg function and thereby limits secondary neuroinflammation only after a delay. The pretreatment protocol used throughout this study cannot be readily translated into a treatment for acute stroke. Moreover, potential immunosuppressive side effects in case of bacterial infections or an immunosuppressive syndrome after extensive brain lesion (Liesz et al., 2009b) have not been tested. However, acute stroke models are good for investigating secondary neuroinflammation in sterile brain tissue lesions. The results obtained in this study need to be considered as proof-of-principle experiments for a novel treatment approach and the new insights concerning modulation of neuroinflammation will need to be translated to autoimmune brain diseases and other diseases such as recurrent stroke, brain trauma, and neurodegeneration. Interestingly, acute (ischemic and traumatic), primary neuroinflammatory, and neurodegenerative brain diseases have common inflammatory mechanisms by which brain tissue damage is induced (Zipp and Aktas, 2006). Tregs have been shown to be key immune modulators not only after acute brain injuries but also in neurodegenerative diseases via the same mechanisms (Reynolds et al., 2007; Liesz et al., 2009a). The experimental stroke model offers the opportunity to investigate neuroinflammation as a paradigmatic model of secondary neuroinflammation after brain tissue injury.
Together, HDAC inhibitors are cerebroprotective by increasing Foxp3 expression and thereby boosting the number and suppressive capacity of Tregs. The key mechanism of this neuroprotective therapy is increased IL-10 production and its broad effect on diverse immune pathways. Considering the common pathways of secondary tissue loss and remodeling by inflammatory pathways in diverse acute and chronic diseases, these findings in the experimental stroke model represent a proof-of-principle for Treg-targeted therapy.
Footnotes
This work was supported by grants from the FRONTIER Excellence Initiative and the German Research Foundation to R.V. The authors thank N. Grabe (BioQuant, Tissue Imaging and Analysis Center, Heidelberg, Germany) for support in histological imaging; J. Suffner for assistance in performing experiments in Foxp3.LuciDTR-4 mice; and Lina Frischbier for technical assistance.
The authors declare no competing financial interests.
References
- Akimova T, Ge G, Golovina T, Mikheeva T, Wang L, Riley JL, Hancock WW. Histone/protein deacetylase inhibitors increase suppressive functions of human FOXP3+ Tregs. Clin Immunol. 2010;136:348–363. doi: 10.1016/j.clim.2010.04.018. [DOI] [PMC free article] [PubMed] [Google Scholar]
- Brait VH, Arumugam TV, Drummond GR, Sobey CG. Importance of T lymphocytes in brain injury, immunodeficiency, and recovery after cerebral ischemia. J Cereb Blood Flow Metab. 2012;32:598–611. doi: 10.1038/jcbfm.2012.6. [DOI] [PMC free article] [PubMed] [Google Scholar]
- Butler KV, Kalin J, Brochier C, Vistoli G, Langley B, Kozikowski AP. Rational design and simple chemistry yield a superior, neuroprotective HDAC6 inhibitor, tubastatin A. J Am Chem Soc. 2010;132:10842–10846. doi: 10.1021/ja102758v. [DOI] [PMC free article] [PubMed] [Google Scholar]
- Carmichael ST. Rodent models of focal stroke: size, mechanism, and purpose. NeuroRx. 2005;2:396–409. doi: 10.1602/neurorx.2.3.396. [DOI] [PMC free article] [PubMed] [Google Scholar]
- Chamorro A, Amaro S, Vargas M, Obach V, Cervera A, Torres F, Planas AM. Interleukin 10, monocytes and increased risk of early infection in ischaemic stroke. J Neurol Neurosurg Psychiatry. 2006;77:1279–1281. doi: 10.1136/jnnp.2006.100800. [DOI] [PMC free article] [PubMed] [Google Scholar]
- Chamorro A, Urra X, Planas AM. Infection after acute ischemic stroke: a manifestation of brain-induced immunodepression. Stroke. 2007;38:1097–1103. doi: 10.1161/01.STR.0000258346.68966.9d. [DOI] [PubMed] [Google Scholar]
- Crosio C, Valle C, Casciati A, Iaccarino C, Carrì MT. Astroglial inhibition of NF-kappaB does not ameliorate disease onset and progression in a mouse model for amyotrophic lateral sclerosis (ALS) PLoS One. 2011;6:e17187–e17187. doi: 10.1371/journal.pone.0017187. [DOI] [PMC free article] [PubMed] [Google Scholar]
- de Ruijter AJ, van Gennip AH, Caron HN, Kemp S, van Kuilenburg AB. Histone deacetylases (HDACs): characterization of the classical HDAC family. Biochem J. 2003;370:737–749. doi: 10.1042/BJ20021321. [DOI] [PMC free article] [PubMed] [Google Scholar]
- de Zoeten EF, Wang L, Butler K, Beier UH, Akimova T, Sai H, Bradner JE, Mazitschek R, Kozikowski AP, Matthias P, Hancock WW. Histone deacetylase 6 and heat shock protein 90 control the functions of Foxp3(+) T-regulatory cells. Mol Cell Biol. 2011;31:2066–2078. doi: 10.1128/MCB.05155-11. [DOI] [PMC free article] [PubMed] [Google Scholar]
- Dirnagl U. Inflammation in stroke: the good, the bad, and the unknown. Ernst Schering Res Found Workshop. 2004:87–99. doi: 10.1007/978-3-662-05426-0_5. [DOI] [PubMed] [Google Scholar]
- Eltzschig HK, Eckle T. Ischemia and reperfusion—from mechanism to translation. Nat Med. 2011;17:1391–1401. doi: 10.1038/nm.2507. [DOI] [PMC free article] [PubMed] [Google Scholar]
- Fickenscher H, Hör S, Küpers H, Knappe A, Wittmann S, Sticht H. The interleukin-10 family of cytokines. Trends Immunol. 2002;23:89–96. doi: 10.1016/S1471-4906(01)02149-4. [DOI] [PubMed] [Google Scholar]
- Fontenot JD, Gavin MA, Rudensky AY. Foxp3 programs the development and function of CD4(+)CD25(+) regulatory T cells. Nat Immunol. 2003;4:330–336. doi: 10.1038/ni904. [DOI] [PubMed] [Google Scholar]
- Frangogiannis NG. Regulation of the inflammatory response in cardiac repair. Circ Res. 2012;110:159–173. doi: 10.1161/CIRCRESAHA.111.243162. [DOI] [PMC free article] [PubMed] [Google Scholar]
- Frenkel D, Huang Z, Maron R, Koldzic DN, Moskowitz MA, Weiner HL. Neuroprotection by IL-10-producing MOG CD4+ T cells following ischemic stroke. J Neurol Sci. 2005;233:125–132. doi: 10.1016/j.jns.2005.03.022. [DOI] [PubMed] [Google Scholar]
- Howells DW, Porritt MJ, Rewell SS, O'Collins V, Sena ES, van der Worp HB, Traystman RJ, Macleod MR. Different strokes for different folks: the rich diversity of animal models of focal cerebral ischemia. J Cereb Blood Flow Metab. 2010;30:1412–1431. doi: 10.1038/jcbfm.2010.66. [DOI] [PMC free article] [PubMed] [Google Scholar]
- Iadecola C, Anrather J. The immunology of stroke: from mechanisms to translation. Nat Med. 2011;17:796–808. doi: 10.1038/nm.2399. [DOI] [PMC free article] [PubMed] [Google Scholar]
- Kalin JH, Butler KV, Akimova T, Hancock WW, Kozikowski AP. Second-generation histone deacetylase 6 inhibitors enhance the immunosuppressive effects of Foxp3+ T-regulatory cells. J Med Chem. 2012;55:639–651. doi: 10.1021/jm200773h. [DOI] [PubMed] [Google Scholar]
- Kleinschnitz C, Kraft P, Dreykluft A, Hagedorn I, Göbel K, Schuhmann MK, Langhauser F, Helluy X, Schwarz T, Bittner S, Mayer CT, Brede M, Varallyay C, Pham M, Bendszus M, Jakob P, Magnus T, Meuth SG, Iwakura Y, Zernecke A, et al. Regulatory T cells are strong promoters of acute ischemic stroke in mice by inducing dysfunction of the cerebral microvasculature. Blood. 2013;121:679–691. doi: 10.1182/blood-2012-04-426734. [DOI] [PMC free article] [PubMed] [Google Scholar]
- Liesz A, Suri-Payer E, Veltkamp C, Doerr H, Sommer C, Rivest S, Giese T, Veltkamp R. Regulatory T cells are key cerebroprotective immunomodulators in acute experimental stroke. Nat Med. 2009a;15:192–199. doi: 10.1038/nm.1927. [DOI] [PubMed] [Google Scholar]
- Liesz A, Hagmann S, Zschoche C, Adamek J, Zhou W, Sun L, Hug A, Zorn M, Dalpke A, Nawroth P, Veltkamp R. The spectrum of systemic immune alterations after murine focal ischemia: immunodepression versus immunomodulation. Stroke. 2009b;40:2849–2858. doi: 10.1161/STROKEAHA.109.549618. [DOI] [PubMed] [Google Scholar]
- Liesz A, Sun L, Zhou W, Schwarting S, Mracsko E, Zorn M, Bauer H, Sommer C, Veltkamp R. FTY720 reduces post-ischemic brain lymphocyte influx but does not improve outcome in permanent murine cerebral ischemia. PLoS One. 2011a;6:e21312–e21312. doi: 10.1371/journal.pone.0021312. [DOI] [PMC free article] [PubMed] [Google Scholar]
- Liesz A, Zhou W, Mracskó É, Karcher S, Bauer H, Schwarting S, Sun L, Bruder D, Stegemann S, Cerwenka A, Sommer C, Dalpke AH, Veltkamp R. Inhibition of lymphocyte trafficking shields the brain against deleterious neuroinflammation after stroke. Brain. 2011b;134:704–720. doi: 10.1093/brain/awr008. [DOI] [PubMed] [Google Scholar]
- Lucas JL, Mirshahpanah P, Haas-Stapleton E, Asadullah K, Zollner TM, Numerof RP. Induction of Foxp3+ regulatory T cells with histone deacetylase inhibitors. Cell Immunol. 2009;257:97–104. doi: 10.1016/j.cellimm.2009.03.004. [DOI] [PubMed] [Google Scholar]
- Macrez R, Ali C, Toutirais O, Le Mauff B, Defer G, Dirnagl U, Vivien D. Stroke and the immune system: from pathophysiology to new therapeutic strategies. Lancet Neurol. 2011;10:471–480. doi: 10.1016/S1474-4422(11)70066-7. [DOI] [PubMed] [Google Scholar]
- McGeachy MJ, Stephens LA, Anderton SM. Natural recovery and protection from autoimmune encephalomyelitis: contribution of CD4+CD25+ regulatory cells within the central nervous system. J Immunol. 2005;175:3025–3032. doi: 10.4049/jimmunol.175.5.3025. [DOI] [PubMed] [Google Scholar]
- Meisel C, Schwab JM, Prass K, Meisel A, Dirnagl U. Central nervous system injury-induced immune deficiency syndrome. Nat Rev Neurosci. 2005;6:775–786. doi: 10.1038/nrn1765. [DOI] [PubMed] [Google Scholar]
- Murray PJ. Understanding and exploiting the endogenous interleukin-10/STAT3-mediated anti-inflammatory response. Curr Opin Pharmacol. 2006;6:379–386. doi: 10.1016/j.coph.2006.01.010. [DOI] [PubMed] [Google Scholar]
- Murray PJ. The JAK-STAT signaling pathway: input and output integration. J Immunol. 2007;178:2623–2629. doi: 10.4049/jimmunol.178.5.2623. [DOI] [PubMed] [Google Scholar]
- Nathan C. Points of control in inflammation. Nature. 2002;420:846–852. doi: 10.1038/nature01320. [DOI] [PubMed] [Google Scholar]
- Planas AM, Gorina R, Chamorro A. Signalling pathways mediating inflammatory responses in brain ischaemia. Biochem Soc Trans. 2006;34:1267–1270. doi: 10.1042/BST0341267. [DOI] [PubMed] [Google Scholar]
- Ren X, Akiyoshi K, Vandenbark AA, Hurn PD, Offner H. CD4+FoxP3+ regulatory T-cells in cerebral ischemic stroke. Metab Brain Dis. 2011;26:87–90. doi: 10.1007/s11011-010-9226-6. [DOI] [PMC free article] [PubMed] [Google Scholar]
- Reynolds AD, Banerjee R, Liu J, Gendelman HE, Mosley RL. Neuroprotective activities of CD4+CD25+ regulatory T cells in an animal model of Parkinson's disease. J Leukoc Biol. 2007;82:1083–1094. doi: 10.1189/jlb.0507296. [DOI] [PubMed] [Google Scholar]
- Rothwell NJ, Luheshi GN. Interleukin 1 in the brain: biology, pathology and therapeutic target. Trends Neurosci. 2000;23:618–625. doi: 10.1016/S0166-2236(00)01661-1. [DOI] [PubMed] [Google Scholar]
- Sakaguchi S. Naturally arising CD4(+) regulatory T cells for immunologic self-tolerance and negative control of immune responses. Annu Rev Immunol. 2004;22:531–562. doi: 10.1146/annurev.immunol.21.120601.141122. [DOI] [PubMed] [Google Scholar]
- Sakaguchi S, Miyara M, Costantino CM, Hafler DA. FOXP3+ regulatory T cells in the human immune system. Nat Rev Immunol. 2010;10:490–500. doi: 10.1038/nri2785. [DOI] [PubMed] [Google Scholar]
- Shevach EM, DiPaolo RA, Andersson J, Zhao DM, Stephens GL, Thornton AM. The lifestyle of naturally occurring CD4+ CD25+ Foxp3+ regulatory T cells. Immunol Rev. 2006;212:60–73. doi: 10.1111/j.0105-2896.2006.00415.x. [DOI] [PubMed] [Google Scholar]
- Shichita T, Sugiyama Y, Ooboshi H, Sugimori H, Nakagawa R, Takada I, Iwaki T, Okada Y, Iida M, Cua DJ, Iwakura Y, Yoshimura A. Pivotal role of cerebral interleukin-17-producing gammadeltaT cells in the delayed phase of ischemic brain injury. Nat Med. 2009;15:946–950. doi: 10.1038/nm.1999. [DOI] [PubMed] [Google Scholar]
- Spera PA, Ellison JA, Feuerstein GZ, Barone FC. IL-10 reduces rat brain injury following focal stroke. Neurosci Lett. 1998;251:189–192. doi: 10.1016/S0304-3940(98)00537-0. [DOI] [PubMed] [Google Scholar]
- Stubbe T, Ebner F, Richter D, Engel O, Randolf Engel O, Klehmet J, Royl G, Meisel A, Nitsch R, Meisel C, Brandt C. Regulatory T cells accumulate and proliferate in the ischemic hemisphere for up to 30 days after MCAO. J Cereb Blood Flow Metab. 2013;33:37–47. doi: 10.1038/jcbfm.2012.128. [DOI] [PMC free article] [PubMed] [Google Scholar]
- Suffner J, Hochweller K, Kühnle MC, Li X, Kroczek RA, Garbi N, Hämmerling GJ. Dendritic cells support homeostatic expansion of Foxp3+ regulatory T cells in Foxp3.LuciDTR mice. J Immunol. 2010;184:1810–1820. doi: 10.4049/jimmunol.0902420. [DOI] [PubMed] [Google Scholar]
- Tao R, de Zoeten EF, Ozkaynak E, Chen C, Wang L, Porrett PM, Li B, Turka LA, Olson EN, Greene MI, Wells AD, Hancock WW. Deacetylase inhibition promotes the generation and function of regulatory T cells. Nat Med. 2007;13:1299–1307. doi: 10.1038/nm1652. [DOI] [PubMed] [Google Scholar]
- Wang Q, Tang XN, Yenari MA. The inflammatory response in stroke. J Neuroimmunol. 2006;184:53–68. doi: 10.1016/j.jneuroim.2006.11.014. [DOI] [PMC free article] [PubMed] [Google Scholar]
- Yilmaz G, Arumugam TV, Stokes KY, Granger DN. Role of T lymphocytes and interferon-gamma in ischemic stroke. Circulation. 2006;113:2105–2112. doi: 10.1161/CIRCULATIONAHA.105.593046. [DOI] [PubMed] [Google Scholar]
- Zhou W, Liesz A, Bauer H, Sommer C, Lahrmann B, Valous N, Grabe N, Veltkamp R. Postischemic brain infiltration of leukocyte subpopulations differs among murine permanent and transient focal cerebral ischemia models. Brain Pathol. 2013;23:34–44. doi: 10.1111/j.1750-3639.2012.00614.x. [DOI] [PMC free article] [PubMed] [Google Scholar]
- Zipp F, Aktas O. The brain as a target of inflammation: common pathways link inflammatory and neurodegenerative diseases. Trends Neurosci. 2006;29:518–527. doi: 10.1016/j.tins.2006.07.006. [DOI] [PubMed] [Google Scholar]