

Abstract
Mounting evidence points to a role for endogenous reactive oxygen species (ROS) in cell signaling, including in the control of cell proliferation, differentiation, and fate. However, the function of ROS and their molecular regulation in embryonic mouse neural progenitor cells (eNPCs) has not yet been clarified. Here, we describe that physiological ROS are required for appropriate timing of neurogenesis in the developing telencephalon in vivo and in cultured NPCs, and that the tumor suppressor p53 plays a key role in the regulation of ROS-dependent neurogenesis. p53 loss of function leads to elevated ROS and early neurogenesis, while restoration of p53 and antioxidant treatment partially reverse the phenotype associated with premature neurogenesis. Furthermore, we describe that the expression of a number of neurogenic and oxidative stress genes relies on p53 and that both p53 and ROS-dependent induction of neurogenesis depend on PI3 kinase/phospho-Akt signaling. Our results suggest that p53 fine-tunes endogenous ROS levels to ensure the appropriate timing of neurogenesis in eNPCs. This may also have implications for the generation of tumors of neurodevelopmental origin.
Introduction
It has become increasingly clear during recent years that mammalian cells use reactive oxygen species (ROS) to control cell signaling during cell proliferation, differentiation, migration, and cytoskeletal reorganization (Ushio-Fukai, 2006; D'Autréaux and Toledano, 2007; Giorgio et al., 2007). Importantly, modulation of cellular redox state is a key mechanism that regulates the balance between self-renewal and differentiation in dividing glial progenitor cells (Smith et al., 2000). More recent evidence also indicated that ROS are involved in the regulation of stem cell homeostasis and that disturbances in redox control can lead to defects in stem cell maintenance in multiple tissues (Chuikov et al., 2010; Le Belle et al., 2011). However the role of ROS as well as their molecular regulation in embryonic neural stem cell (NSC) biology remain obscure. A better insight into this issue could have implications also for cancer development as well as for aging, where ROS act as signals able to influence differentiation and cellular life span.
Given that the transcription factor (TF) and tumor suppressor p53 has been shown in some cell types to possess an antioxidant function (Sablina et al., 2005) and to regulate adult neural stem cells self-renewal (Gil-Perotin et al., 2006; Meletis et al., 2006) or olfactory bulb neurogenesis (Armesilla-Diaz et al., 2009), we reasoned that ROS and p53 might control essential signaling pathways in telencephalic embryonic mouse neural progenitor cells (eNPCs). Therefore, in the present manuscript, we questioned whether ROS and p53-dependent fine-tuning of ROS might influence eNPC self-renewal and differentiation.
Indeed, our findings propose a role for p53 in the fine-tuning of progenitor cell ROS levels, which in turn regulate the appropriate timing of the neurogenic program. In addition, we show that p53 regulates neurogenic and oxidative stress gene expression programs and that both p53 and ROS-dependent neurogenesis depend on PI3K/phospho-Akt (P-Akt) signaling.
Materials and Methods
Animals.
B6.129S2-Trp53tm1Tyj/J and B6.129P2-Trp53tm1Brn/J × B6.Cg-Tg(Nes-cre)1Kln/J and B129 S2 TRP53II mice were purchased from The Jackson Laboratory and maintained as heterozygous breeding pairs. Mice were kept and experiments were conducted according to national and European Union laboratory animal standards on the project license granted by local authorities.
Mouse neural progenitor cell culture.
Neural progenitor cell cultures were prepared from heterozygous breedings. Embryos were genotyped using the following oligo pairs: B129 S2 TRP53II, oIMR0013 forward, CTTGGGTGGAGAGGCTATTC, neo cassette; oIMR0014 reverse, AGGTGAGATGACAGGAGATC, neo cassette; oIMR0036 forward, ATAGGTCGGCGGTTCAT; p53 oIMR0037 reverse, CCCGAGTATCTGGAAGACAG; p53B6/129 P2-Trp53loxP-B6.Cg(SJL)-Tg (Nes-cre)1Kln, oIMR8543 forward, GGTTAAACCCAGCTTGACCA, transgene; oIMR8544 reverse, GGAGGCAGAGACAGTTGGAG, transgene; oIMR1084 forward, GCGGTCTGGCAGTAAAAACTATC, transgene; oIMR1085 reverse, GTGAAACAGCATTGCTGTCACTT, transgene; oIMR7338 forward, CTAGGCCACAGAATTGAAAGATCT, internal positive control; oIMR7339 reverse, GTAGGTGGAAATTCTAGCATCATCC, internal positive control.
Telencephalons of embryonic day 13 (E13) embryos were dissected and dissociated. Neural progenitor cells were maintained as floating neurospheres in F-12/DMEM (1:1), 2% B27 without vitamin A (Invitrogen), 20 ng/ml bFGF-2 and EGF (both from Millipore), 5 μg/ml heparin (Sigma), 1% Pen-Strep (Invitrogen), and 2 mm l-Gln (Invitrogen; neurosphere medium) in normoxic cell culture conditions (5% CO2, 20% O2, >95% humidity). Cells were passaged every 7 d using accutase (Millipore).
In pretreatments, neurospheres were exposed to 1 μm H2O2 (Sigma), 10 μm LY294002 (Cayman Chemical), or 1 mm N-acetyl cysteine (Sigma). Medium was changed back to normal differentiation medium after pretreatments to differentiate cells. In p53 overexpression experiments, dissociated NPCs were transduced with adenoviruses (Ad)-GFP and Ad-GFP-p53 and progenitor cells overexpressed proteins for 18 h before cells were processed for experiments. All experiments were performed before the fifth passage and repeated two to six times.
Differentiation of neural progenitor cells.
Neural progenitor cells were dissociated using accutase (Millipore) and plated on poly-d-lysine-coated (15 μg/ml; Sigma) and laminin-coated (15 μg/ml; Millipore) glass coverslips or wells in differentiation medium containing 1% FCS, 2% B27 supplement, 1% Pen-Strep, and 2 mm l-Gln (Invitrogen). Cells were allowed to differentiate for 3–7 d before being lysed for RNA extraction or immunoblotting, or fixation for immunocytochemistry.
Immunoblotting.
Telencephalons were lysed in lysis buffer (20 mm HEPES, pH 7.4, 2 mm EGTA, 50 mm β-glycerolphosphate, 50 mm NaF, 1 mm benzamidine, 1% Triton X-100, 1% SDS, 1 mm DTT) in the presence of complete protease and phosphatase inhibitors (Roche). Samples were prepared according to standard immunoblot protocols. They were separated by SDS-PAGE and transferred to nitrocellulose membranes. Five percent nonfat milk-blocked membranes were incubated with primary antibodies overnight at 4°C, washed three times, and incubated with HRP-conjugated secondary antibodies for 1 h at room temperature, washed, and detected using an enhanced chemiluminescence detection kit (Thermo Fisher Scientific) and GE Healthcare Hyperfilm ECL. In vitro cultured NPCs were lysed in SDS-PAGE sample buffer and immunoblotted as described above. The following primary antibodies were used: rabbit anti-phospho-S473Akt (1:1000) and rabbit anti-cleaved caspase3 (1:400; Cell Signaling Technology); mouse anti-BIII-tubulin (1:1000; Promega); rabbit anti-MAP2 (1:1000), anti-GAD67 (1:500), and rabbit anti-GFAP (1:1000; Millipore); rabbit anti-VGLUT2 (Synaptic Systems); goat anti-doublecortin (1:1000; Santa Cruz Biotechnology); mouse anti-β-actin (1:5000; Sigma); and rabbit anti-sestrin2 (1:1000; ProteinTech Group).
Microarray analysis.
Total RNA from E13 wild-type and p53−/− neurospheres, three embryos for each genotype, was extracted with Trizol (Invitrogen) according to the manufacturer's protocol. Affymetrix Mouse Genome 430 2.0 Array from triplicate samples was performed at the Microarray GeneChip Facility at Universitäts Klinikum (Tübingen, Germany). Data processing and analysis were performed according to standard procedures (GC-RMA, RMA, MAS5). Genes differentially expressed were selected based on a two-fold change cut-off and significant statistical difference (ANOVA with Bonferroni's correction). Gene functional and pathway analysis was performed with David and Ingenuity software. The full list of the dysregulated genes is available as an Excel worksheet upon request.
Quantitative real-time PCR.
RNA from cell and tissue samples was isolated using Trizol reagent (Invitrogen). One microgram of total RNA was treated with amplification grade DNase I (Invitrogen) as described by the manufacturer to eliminate possible genomic DNA contamination. RNA samples were reverse transcribed with SuperScript II reverse transcriptase and Oligo(dT)12–18 primers (Invitrogen), after which cDNA was diluted 25-fold with nuclease-free water, and quantitative real-time (qRT)-PCR reactions were prepared using Absolute qPCR SYBR Low Rox Mix (Thermo Fisher Scientific). qRT-PCR was run by the 7500 Fast Real-Time PCR System (Applied Biosystems) with a standard fast mode and additional melt curve stage. A relative quantification analysis was applied using the ΔΔCt method, with β-actin as an endogenous control. The following primer pairs were used: Sesn2 forward, TAGCCTGCAGCCTCACCTAT; Sesn2 reverse, GATTTTGAGGTTCCGTTCCA; p53 forward, ATAGGTCGGCGGTTCAT; p53 reverse, CCCGAGTATCTGGAAGACAG; p21 Cdkn1a forward, ACGACCTGGGAGGGGACAAG; p21 Cdkn1a reverse, TCCGTTTTCGGCCCTGAGAT; platelet derived growth factor α (Pdgfrα) forward, TCCCTTGGTGGCACACCCTA; PdgfRα reverse, TGTCCCGGCAACAGGTTCTC; Ngn2 forward, GGTTGAATGCAAGCGTGGAAA; Ngn2 reverse, TGTGGCTGATCCTGGCAATG; Dcx forward, CCAAAGGCTTCCCCAACACC; Dcx reverse, TGTGCTTCCGCAGACTTCCA; Pax6 forward, ACCGCCCTCACCAACACGTA; Pax6 reverse, ACTCCGCCCATTCACTGACG; Otx1 forward, AGCGCCCATGCACTCTCATC; Otx1 reverse, ATTGAAGGCGAGCCCAGAGC; Nr2f2 forward, CCAACCAGCCAACACGGTTC; Nr2f2 reverse, TCCCGGATGAGGGTTTCGAT; β-actin forward, ACCCAGGCATTGCTGACAGG; β-actin reverse, GGGGCCGGACTCATCGTACT.
Immunocytochemistry.
Cells were fixed with 4% PFA in PBS at room temperature for 15 min and immunostained according to standard protocols. Primary antibodies used were GFAP (rabbit, 1:1000; Millipore Bioscience Research Reagents), βIII-tubulin (mouse, 1:1000; Promega), p53-CM5 (rabbit, 1:500; Novocastra), Ki67 (mouse, 1:100; BD PharMingen), phospho-H3 (Ser10; rabbit, 1:100; Millipore), and doublecortin and phospho-S473Akt (both rabbit, 1:200; Cell Signaling Technology). Alexa Fluor 488 and Alexa Fluor 568 (Invitrogen) were used 1:2000 as fluorescent secondary antibodies. Axiophot2/Axioplan microscope and AxioVision software 4.8. (Zeiss) were used in imaging. For quantifications, five to eight fields each containing ∼20 neurospheres or 500–1000 differentiating cells were counted. Neurite length of Tuj1+ differentiating neurons was measured using the autoneuron plug-in from the Neurolucida software (MBF Bioscience) from five to eight fields, each containing 500–1000 cells.
Immunohistochemistry.
Brains were fixed in 4% PFA in PBS at 4°C overnight and cryoprotected in 30% saccharose at 4°C overnight, after which they were cut to 18 μm coronal sections and stained according to the protocols described by the manufacturer specifically for each antibody. The primary antibodies used were p53-CM5 (rabbit, 1:500; Novocastra), phospho-H3 (Ser10) and nestin (rabbit and mouse, respectively, 1:100; Millipore), and BrdU (rat, 1:200; Novus Biologicals). Fluorescent secondary antibodies applied were Alexa Fluor 488 and Alexa Fluor 568 at 1:2000 dilution (Invitrogen). An LSM 780 laser scanning confocal microscope together with Zen 2011 software (Zeiss) and an Axiophot 2/Axioplan microscope with AxioVision software 4.8. (Zeiss) were used in imaging. Three to six sections per animal, each separated by 40 μm, and three to six animals per group were examined to quantitate the number of phospho-H3- or BrdU-positive cells.
Endogenous ROS measurement.
ROS indicator chloromethyl 2′7′-dichlorodihydrofluorescein diacetate (CM-H2-DCFDA; Invitrogen) was applied to assess endogenous cellular ROS levels in control and treated neurosphere cultures as well as in ex vivo ROS measurements. For CM-H2-DCFDA staining cells were incubated with 5 μm CM-H2-DCFDA dye in Hibernate-E medium (Invitrogen) for 20 min at 37°C in the cell culture incubator. After washing with PBS, cells were incubated in neurosphere medium in the cell culture incubator for 30 min to allow cellular esterases to hydrolyze acetate groups and to render the dye responsive to oxidation. NPCs were then washed, dissociated with accutase to a single cell suspension and sorted by using CyAnADP fluorescence-activated cell sorting (FACS) and Summit software (DakoCytomation). Additionally, CM-H2-DCFDA-stained cells were incubated with propidium iodide (PI) 4 μg/ml for 30 min in FACS buffer to detect late apoptotic and dead cells, and side and forward scatter were set to eliminate dead and aggregated cells. Nonstained cells were run as a negative control. At least 10,000 cells were counted in each experiment. For E11 ex vivo ROS measurements, the telencephalon was dissected, dissociated to single cells using papain (Worthington), and stained for CM-H2-DCFDA (Invitrogen) as described above. Stained cells were also incubated with propidium iodide 4 μg/ml for 1 h in FACS buffer to detect late apoptotic and dead cells, and FACS was performed as above. Differentiating neural progenitor cells were stained with the ROS-sensitive dye dihydroethidine (DHE; 2 μm; Invitrogen) for 30 min in the cell culture incubator, washed with PBS, and fixed for immunocytochemistry. In vivo ROS levels of B6.129P2-Trp53tm1Brn/J × B6.Cg-Tg(Nes-cre)1Kln/J embryonic telencephalons were examined using DHE (5 mg/kg; Invitrogen). DHE was administered intraperitoneally 1 h before embryos were killed. Brains were dissected, fixed in 4% PFA in PBS and processed for cryocutting. Fluorescence intensity of 18 μm coronal slices was analyzed using ImageJ software. Three to five embryos per genotype were examined.
Flow cytometry.
Immunostaining of NPCs for FACS was performed using the Fix and Perm Kit (Invitrogen). The following antibodies were used: phospho-AktS473 and doublecortin (both rabbit, 1:100; Cell Signaling Technology) and sestrin2 (rabbit, 1:100; ProteinTech Group). Alexa Fluor 488 and Alexa Fluor 633 (Invitrogen) were the fluorescent secondary antibodies, and they were used at 1:1000 dilution. For double staining with CM-H2-DCFDA, NPCs were first stained for CM-H2-DCFDA, whereafter immunostaining was performed. CyAnADP FACS and Summit software (DakoCytomation) were used for FACS and to analyze the data. Sort gates were set by side and forward scatter to eliminate dead and aggregated cells. Nonstained cells were run as a negative control for ROS analysis. Nonspecific IgG/Alexa secondary fluorophore staining was applied to define background staining from positive cells. At least 10,000 cells were counted in each experiment. FACS signal originating form nonstained cells or IgG control was used to set the threshold for analysis. In double stainings, spillover of the fluorescent signal to the other channel used was eliminated by color compensation according to standard procedures.
Ex vivo electroporation and culture.
pEF1/V5-His and pEF1/V5-His-Sesn2 plasmids were used in ex vivo electroporation of embryonic telencephalons. DNA was purified with the Endofree Plasmid Maxi Kit (Qiagen). Two micrograms (2–3 μl) of plasmid in saline with Fast Green (0.05%; Sigma) was microinjected into lateral ventricles of E13 mouse embryos. Five 40 V, 3 ms pulses were used to electroporate DNA. Hemisphere on the side of the positive electrode was used as a control in all experiments. In addition, electroporation of pEF1/V5-His was performed as an additional control. After electroporation, cortices were dissected and placed in growth medium [F-12/DMEM (1:1), 2% B27 (Invitrogen), 1% Pen-Strep, 2 mm l-Gln] in the cell culture incubator (5% CO2, 20% O2, >95% humidity). After 20 h expression, cortices were prepared for ROS measurement by FACS.
In vivo saline, N-acetyl-cysteine, and BrdU injections.
Saline (0.9%; control) or N-acetyl-cysteine (NAC; 67 mg/kg; Sigma) in 0.9% saline was injected intraperitoneally from E10 onward daily to pregnant dams. Embryos were killed at E16, and telencephalons were dissected for ROS staining and snap frozen in liquid nitrogen for further experiments. Three embryos per treatment and genotype were analyzed.
BrdU (150 mg/kg; Sigma) was injected intraperitoneally to pregnant dams 1 h before embryos were killed. Embryonic brains were dissected and prepared for BrdU immunohistochemistry (IHC) as described above. Images were acquired using Axiophot 2/Axioplan microscope and AxioVision software 4.8 (Zeiss). Three to six animals per group, three sections per animal, each separated by 40 μm, were quantitated.
Statistical analysis.
Data are expressed as mean ± SEM and, in some cases when indicated, as mean ± SD. Data were analyzed by unpaired two-tail Student's t test, including ANOVA, to determine the statistical significance of data sets. Statistical significance is expressed as p < 0.05, p < 0.01, or p < 0.001 by two-tail Student's t test.
Results
p53−/− embryonic NPCs display an increase in cellular ROS levels
To determine whether endogenous ROS levels of in vitro p53−/− NPCs differed from those of wild-type cells, we used FACS and the ROS-sensitive dye DCFDA capable of detecting H2O2, HO·, and ROO· species (Gomes et al., 2005). Cultured p53−/− E13 NPCs derived from either conventional p53 knock-out (Fig. 1A,B) or nestin-cre/loxP-p53 mice (Fig. 1C,D) displayed an increase in cellular ROS relative to wild-type cells, but no increase in cell death when assessed by propidium iodide staining (Fig. 1A,B). Similarly, when the analysis was performed ex vivo on acutely dissociated E11 telencephalons, p53−/− cells showed an increase in ROS (Fig. 1E,F), but no increase in death (data not shown). At this developmental stage, which delineates the beginning of neurogenesis, the great majority of telencephalic NPCs are still proliferative.
Figure 1.

A, FACS for the ROS indicator chloromethyl (CM)-DCFDA and for propidium iodide, which detects dead cells, on cultured E13 NPCs. p53−/− NPCs exhibit an increase in DCFDA, but not in PI staining intensity. Background (nonstained NPCs) signal (gray bars) was used to set the threshold for signal detection. B, Bar graphs of FACS data for CM-DCFDA (A) display mean percentages of DCFDA++ (strongly positive) NPCs ± SEM, from three independent experiments [wild type (wt) DCFDA++, 13% (±0.9 SEM); p53−/− DCFDA++ 36% (±2.1 SEM); ★★★p < 0.001, Student's two-tail t test]. C, E13 p53−/− NPCs from nestin-cre/loxP-p53 embryos exhibit in vitro increased DCFDA staining (by FACS) compared to wild-type control. D, The bar graph shows DCFDA++ (strongly positive) FACS data (C) as mean percentages of DCFDA++ cells ± SEM from three independent experiments. E, E11 p53−/− telencephalons exhibit higher ROS ex vivo (mean DCFDA staining intensity by FACS). F, Bar graphs of FACS data (E) show mean percentages ± SEM (wt, N = 3; p53−/−, N = 4; ★p < 0.05, Student's two-tail t test). G, One hour pulse of DHE in in vivo E16 Nes-cre/loxP p53 embryos demonstrates that both the VZ and the cortical plate of p53−/− telencephalons have higher ROS levels compared to wild type. H, The bar graph shows densitometric quantification of DHE signal intensity presented as mean percentage ± SEM (wt, N = 4; p53−/−, N = 3; VZ–SVZ, ★p < 0.05; cortical plate, ★★p < 0.01, Student's two-tail t test). I, Staining of differentiating E13 (DIV 5) NPCs for the neuronal marker Tuj1 (green), for the ROS indicator DHE (red) and the nuclear dye Hoechst (blue). J, The bar graph shows that the number of DHE+ cells (percentage of total cells as measured by Hoechst-positive cells) is higher in p53−/− NPCs compared to wt. Values represent the mean ± SD from two independent experiments. ★★★p < 0.001 (Student's two-tail t test). K, The bar graph shows that the great majority of young Tuj1+ neurons are also DHE+. Values represent mean percentage ± SD from three independent experiments. Scale bars: 100 μm.
To explore the generation of ROS around the end of mouse telencephalic neurogenesis, DHE was injected to pregnant dams 1 h before killing and densitometric intensity of hydroethidine stained cells emitting red fluorescence upon hydroethidine oxidation was measured on sectioned E16 nestin-cre/loxP-p53 brains. Similarly to p53−/− E11 telencephalons, ROS levels were elevated in E16 embryonic brains (Fig. 1G,H). In the absence of p53, both the E16 ventricular zone (VZ)–subventricular zone (SVZ) and the cortical plate displayed significant increase in hydroethidine staining intensity. Furthermore, DHE staining pattern suggested that high ROS is especially a feature of young neurons, as the outmost layer of the cortical plate was most intensively stained for DHE (Fig. 1G), although pial vasculature is also DHE positive, suggesting caution in data interpretation. In line with this, the great majority of young postmitotic neurons in vitro were double positive for DHE and Tuj1, an early postmitotic neuronal marker (Fig. 1I–K), with p53−/− differentiating NPCs displaying a further increase in the total number of DHE+ cells (Fig. 1J). Hence, these data imply that high ROS is typical for young neurons and the absence of p53 contributes to a further elevation of ROS in proliferating NPCs as well as in newly generated neurons.
The pattern of ROS production parallels the distribution of p53 immunoreactivity in the developing telencephalon. IHC on coronal sections of E11 and E13 mouse telencephalons detected nuclear p53 expression in the germinal zones positive for the proliferative NPC marker nestin (Fig. 2A–C). p53 was expressed equally in the pallial and subpallial proliferative germinal zones, its expression decreasing toward the cortical plate. In line with the in vivo expression pattern, p53 was detected in the nucleus of cultured E13 NPCs (∼20% are strongly p53 positive-high expression; Fig. 2D). Costaining for the pan-proliferative marker Ki67 demonstrated that the vast majority of the p53+ NPCs were also Ki67+ (Fig. 2E). Importantly, there was no staining for p53 in p53−/− NPCs, an indication of the specificity of the antibody. Quantification of p53 mRNA by qRT-PCR showed that p53 mRNA is most abundant in embryonic telencephalons at E13–E16, the period of active expansion of the NPC pool and of neurogenesis, decreasing thereafter considerably (Fig. 2F). Similar quantification in cultured proliferating and differentiating NPCs confirmed that proliferating NPCs have the highest p53 expression level followed by a progressive decrease immediately upon induction of differentiation (Fig. 2G).
Figure 2.

A, Immunohistochemistry for p53 on E11 telencephalons. p53 immunoreactivity is ubiquitous in highly proliferating cells of E11 telencephalons, yet decreasing in the preplate that is at the outmost layer of the telencephalon. Scale bar, 50 μm. B, p53 immunoreactivity is detectable in the germinal zones of E13 mouse telencephalons, where proliferative neural progenitors reside. Notably, the intensity of p53 signal decreases considerably toward the cortical plate. C, Immunohistochemistry for nestin, a marker for proliferative NPCs on E13 telencephalons. The same regions that are strongly immunoreactive for nestin are positive also for p53 (B). D, Co-immunocytochemistry in E13 neurospheres co-stained for the pan-proliferative marker Ki67 and for p53. The great majority of p53+ NPCs are also Ki67+. No detectable p53 immunoreactivity is found in p53−/− neurospheres. Scale bars (C, D): 100 μm. E, The bar graph shows mean percentage (normalized to total number of Hoechst+ cells) ± SEM of Ki67+, p53+, and Ki67+/p53+ double-positive cells in neurospheres. ★★p < 0.01 (Student's two-tail t test). F, The bar graph shows quantification of p53 mRNA during embryonic telencephalic development by quantitative real-time RT-PCR. p53 mRNA is most abundant at E13–E16, that is, during the neurogenic period of telencephalic development, decreasing remarkably thereafter. Mean p53 mRNA expression was normalized to β-actin. Three embryos per developmental stage and genotype were examined. Each experiment was conducted as triplicates. Error bars indicate ±SD. G, p53 in vitro mRNA levels decrease upon differentiation the highest amount of p53 mRNA being expressed in proliferative neurospheres when assessed by quantitative RT-PCR. Data represent mean p53 mRNA expression normalized to β-actin ± SD from two unrelated experiments, each triplicates (★★p < 0.01; ★★★p < 0.001, two-tail t test). wt, Wild type.
Increase in ROS levels is related to initiation of neurogenesis
Next we investigated neural lineage commitment and differentiation potential of in vitro cultured E13 wild-type and p53−/− telencephalic neural progenitor cells in relation to ROS production. Initially, we found by immunocytochemistry for Doublecortin (DCX) on neurospheres that the number of DCX+ progenitors was increased in p53−/− mice (Fig. 3A,B). In accordance with this, differentiating p53−/− E13 NPCs exhibited enhanced expression of neurogenic genes (Fig. 3C–E) and displayed greater extension of neurites, while astrogliogenesis was not affected (Fig. 3F–I). In addition, both GABAergic and glutamatergic differentiation was enhanced in p53−/− cells, as shown by Western blotting for VGLUT2 and GAD65/GAD67 (Fig. 3J,K). Next, we explored neuronal differentiation in vivo on wild-type and p53−/− telencephalons by immunoblotting for neuronal marker proteins. In line with the results in cell culture, expression of the neuroblast marker DCX, as well of the GABAergic neuron marker GAD65/GAD67, was elevated between E13 and E16 (Fig. 3L), whereas astrogliogenesis was not affected, as found by immunoblotting for the astrocyte marker GFAP (data not shown).
Figure 3.
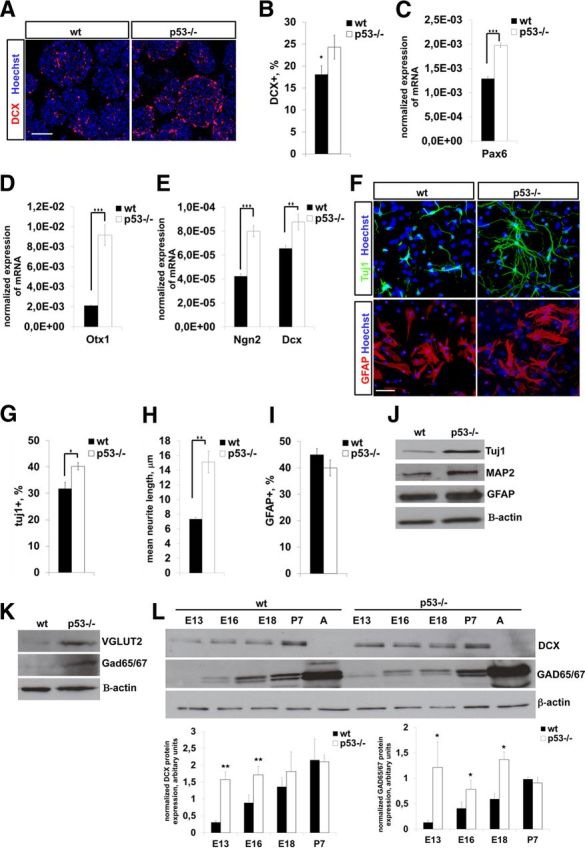
A, Immunostaining of E13 neurospheres for the neuroblast marker DCX (red). Nuclear staining with Hoechst is in blue. B, Quantification of DCX+ NPCs in neurospheres. A greater proportion of p53−/− NPCs are DCX+ compared to wild type (wt). Data are presented as percent mean ± SD of DCX+ cells in neurospheres. C–E, Quantification of mRNA levels for neurogenic genes in cultured neurospheres by qRT-PCR. p53−/− NPCs exhibit increased expression of several genes involved in neurogenesis. Mean mRNA expression normalized to β-actin ± SD is shown. Three independent experiments were conducted, each in triplicate. F, Immunocytochemistry for Tuj1 or GFAP in in vitro differentiating wild-type and p53−/− NPCs (DIV 7). Differentiating cells were stained for the neuronal marker Tuj1 (green) and the astrocyte marker GFAP (red) and with the nuclear dye Hoechst (blue). G, H, p53−/− NPCs generate more Tuj1+ neurons (G) and longer neurites (H) upon differentiation (DIV 7) compared to wild type. Values represent the mean percentage of Tuj1+ neurons (G) or of mean neurite length (H) ± SEM from three independent experiments. I, Quantification of the number of GFAP-positive cells in wild-type and p53−/− differentiating NPC cultures (DIV 7). No difference in astroglial differentiation can be detected between genotypes. Values represent mean percentage of GFAP+ cells when normalized to the total number of cells ± SD from three independent experiments. J, Immunoblotting of differentiating wild-type and p53−/− NPCs (DIV 7) display increased expression of neuronal markers Tuj1 and MAP2, but not of the astroglial marker GFAP. Similar results were obtained in independent experiments. Representative blots are shown. K, Immunoblotting shows that GABAergic (GAD65/GAD67) and glutamatergic (VGLUT2) differentiation is elevated in p53−/− differentiating NPC cultures (DIV 7). Similar results were obtained in independent experiments. Representative blots are shown. L, Immunoblotting of prenatal and postnatal telencephalic lysates for marker proteins as indicated. Three telencephalons were used per developmental stage and genotype. Representative blots and bar graphs with quantitation are shown. ★p < 0.05; ★★p < 0.01; ★★★p < 0.001 (two-tail Student's t test). Scale bars: A, 100 μm; F, 50 μm.
To directly link ROS with neurogenesis, we performed FACS on DCFDA/DCX double-stained progenitors, which demonstrated that the number of DCX+/DCFDA++ p53−/− NPCs was elevated compared to the wild type (Fig. 4A). Importantly, transduction of NPCs with Ad-GFP-p53 reversed the phenotype in p53−/− neurospheres (Fig. 4B,C) and differentiating cells (Fig. 4D–G), leading to a decrease in DCX+ cells in neurospheres and to a decrease in the number of Tuj1+ neurons and in neurite outgrowth in differentiation conditions (Fig. 4D–H) without, however, causing cell death (data not shown).
Figure 4.

A, FACS of DCFDA/DCX double-stained E13 neurospheres. p53−/− NPCs display an increase both in the total number of DCX++ (strongly positive) cells and in the number of DCX/DCFDA double-positive cells. Background (nonstained NPCs and nonspecific IgG) signal (gray bars) was used to set the threshold for signal detection. Three independent experiments with similar results were conducted. A representative experiment is shown. B, C, FACS after Ad-GFP-p53 or control Ad-GFP transduction of E13 p53−/− cultured NPCs shows a decrease in GFP/DCX+ NPCs after Ad-GFP-p53 transduction. The bar graph shows percentage of DCX+/GFP+ double-positive E13 NPCs by FACS (C). Data are the mean percentage of DCX+/GFP+ (strongly positive) double-positive NPCs (DCX+/GFP+ vs GFP+) ± SEM (N = 3). D, Immunocytochemistry for the neuronal marker Tuj1 (red) of Ad-GFP- and Ad-GFP-p53-transduced p53−/− differentiating NPCs (DIV 3). Proliferative NPCs were transduced with adenovirus before being plated for differentiation. Nuclei were stained with Hoechst (blue). E, Immunocytochemistry for the astrocyte marker GFAP (red) and Hoechst (blue) on Ad-GFP- and Ad-GFP-p53-transduced differentiating p53−/− NPCs as in D. Scale bars: 50 μm. F, Quantification of Tuj1+/GFP+ double-positive differentiating neurons (Tuj1+/GFP+ vs GFP+) after Ad-GFP and Ad-GFP-p53 transduction in NPCs. The bar graph shows that overexpression of p53 decreases the number of Tuj1+ neurons generated by differentiating p53−/− NPCs. The data are the mean percentage of Tuj1+/GFP+ double-positive neurons ± SEM from three independent experiments. G, The bar graph shows that Ad-GFP-p53 transduction decreases mean neurite length of Tuj1+/GFP+ double-positive differentiating p53−/− neurons compared to GFP expressing control neurons. Values represent mean neurite length (in micrometers) ± SD from two independent experiments. H, Quantification of GFAP+ astrocytes in Ad-GFP- and Ad-GFP-p53-transduced differentiating E13 NPCs. p53 overexpression does not affect astrogliogenesis. Mean percentage of GFAP+/GFP+ double-positive cells (GFAP+/GFP+ vs GFP+) ± SEM from two unrelated experiments is shown. ★p < 0.05; ★★p < 0.01 (Student's two-tail t test). wt, Wild type.
The possibility that the increase in DCX+ cells/DCX protein levels was due to increased proliferation of DCX+ cells rather than to the generation of DCX+ cells per se was excluded by a number of experiments. First, immunostaining for the mitosis marker P-H3 or for the pan-proliferative marker Ki67 did not reveal a difference in proliferation between wild-type and p53−/− NPCs (Fig. 5A–D). Second, costaining of wild-type and p53−/− neurospheres for P-H3 and DCX did not detect a significant difference in the proportion of P-H3/DCX double-positive cells (Fig. 5E), indicating that p53 does not play a major role in the proliferation of embryonic NPCs in the presence of EGF and FGF trophic factors. A third line of evidence comes from in vivo studies, where, likewise, we did not detect a difference in NPC proliferation between genotypes when the total number of BrdU+ cells present in the VZ and SVZ of E16 telencephalons was quantitated after a short BrdU pulse (Fig. 5F,G) or when the number of P-H3+ cells was counted in the VZ–SVZ of E13 and E16 telencephalons (Fig. 5H–J). Together, these data imply that if p53 has a role in the regulation of embryonic NPC proliferation, in its absence, other factors are able to compensate for it.
Figure 5.

A, p53−/− NPCs do not exhibit increased proliferation compared to wild type (wt) according to P-H3 immunocytochemistry. E13 neurospheres were immunostained for the mitosis marker P-H3 (green). Nuclei were stained with Hoechst (blue). B, The bar graph shows quantification of P-H3+ cells in wild-type and p53−/− neurospheres (A). Data are presented as mean percentage of P-H3+ cells in neurospheres ± SD from three unrelated experiments. C, Immunostaining of neurospheres for the pan-proliferative marker Ki67 (red) does not reveal differences in proliferation between wild-type and p53−/− NPCs. Nuclei were stained with Hoechst (blue). D, The bar graph shows quantification of Ki67+ cells in wild-type and p53−/− neurospheres (C) in successive passages. Data are presented as mean percentage of Ki67+ cells in neurospheres ± SD from three independent experiments. E, The bar graph shows that proliferating P-H3+/DCX+ p53−/− neurospheres do not display differential proliferation compared to wild type. The percentage of DCX+/P-H3+ double-positive NPCs in neurospheres was normalized to the total number of DCX+ cells. Values represent mean percentage ± SD (N = 3). F, Immunohistochemistry for BrdU (red) on E16 sectioned wild-type and p53−/− telencephalons. Pregnant dams were killed after a 1 h BrdU pulse, and embryonic brains were dissected for IHC. G, Quantification of BrdU+ cells in the VZ–SVZ of E16 wild-type and p53−/− telencephalons does not reveal a difference in the number of S-phase (BrdU+) cells between genotypes. Data show mean percentage of BrdU+ cells ± SEM for VZ–SVZ (3 embryos per genotype and 3 sections per each embryo, successive sections, 40 μm apart). H, I, Immunohistochemistry for P-H3 (green) on E13 coronal sections of wild-type and p53−/− telencephalons. J, Quantification of P-H3+ cells in the VZ and SVZ of E13 wild-type and p53−/− telencephalons does not reveal a difference between genotypes in the percentage of mitotic cells. Data show the mean percentage of P-H3+ cells ± SEM for each germinal zone as indicated when counted from three embryos per genotype and three sections per each embryo (successive sections, 40 μm apart). Scale bars: 100 μm.
To directly functionally link ROS to neurogenesis, we pretreated proliferating neurospheres with H2O2 and found that this promoted generation of Tuj1+ neurons (Fig. 6A,B). Conversely, pre-exposure of NPCs to antioxidant NAC decreased the number of neurons produced upon induction of differentiation and was able to partially revert the phenotype observed in p53−/− cells (Fig. 6C,D). Together, these data imply that cellular redox status has a role in the initiation of neurogenesis. Moreover, they also suggest that the increase in in vitro neurogenesis in p53−/− NPCs presumably results from their enhanced oxidative cellular status. Next, we investigated whether this might also occur in vivo. NAC was administered intraperitoneally daily to pregnant dams since E10, animals were killed at E16, and telencephalic protein lysates were prepared for immunoblotting. Importantly, NAC antioxidant treatment led to a reduction in DCX protein when compared to the vehicle group, suggesting that downregulation of ROS suppresses neurogenesis also in vivo (Fig. 6E).
Figure 6.

A, Immunocytochemistry for the neuronal marker Tuj1 (green) and nuclear stain Hoechst (blue) of 1 μm H2O2 preprimed wild-type (wt) and p53−/− differentiating NPCs (DIV 5). Neurospheres were pretreated with H2O2 in proliferation conditions and plated subsequently for differentiation. B, The bar graph shows that pretreatment of neurospheres with H2O2 increases neurogenic differentiation in wild-type but not in p53-null NPCs. Data represent the mean percentage of Tuj1+ cells normalized to the total number of differentiating cells (Hoechst+ cells) ± SEM from three independent experiments. C, Immunocytochemistry for the neuronal marker Tuj1 (green) and nuclear stain Hoechst (blue) of antioxidant N-acetyl-cysteine (1 mm) pretreated wild-type and p53−/− differentiating NPCs (DIV 5). Neurospheres were pretreated with NAC in proliferation conditions and plated subsequently for differentiation. D, The bar graph shows that pretreatment of proliferative NPCs with antioxidant NAC decreases neurogenic differentiation in p53−/− cells only. Data represent the mean percentage of Tuj1+ cells normalized to the total number of differentiating cells (Hoechst+ cells) ± SEM from three independent experiments. ★★p < 0.01; ★★★p < 0.001 (two-tail t test). E, Immunoblotting of E16 p53−/− telencephalic lysates for neuroblast/immature neuron marker DCX, whose expression is reduced by NAC. Pregnant dams were injected daily from E10 onward, either with control saline or antioxidant NAC. Embryos were killed at E16. Antioxidant treatment decreased the amount of DCX (N = 3). Scale bars: 100 μm.
Neurogenesis and redox regulatory genes are dysregulated in p53−/− neurospheres and telencephalons
Our findings so far imply that p53 deletion facilitates ROS accumulation, and thereby drives neurogenesis and likely contributes to expression of neurogenic genes, whereas, in contrast, antioxidant treatment leads to a decrease in neuronal differentiation in cultured cells and in vivo. To cast some light on the molecular mechanisms potentially responsible for connecting oxidative stress to increased neurogenesis in p53−/− mice, we performed genomewide microarray gene expression analysis on cultured E13 wild-type and p53−/− neurospheres. Microarray analysis proved that several neurogenic genes including Otx1, Ngn2, Nr2f2, and Dcx (Table 1) were upregulated, whereas some others putatively involved in redox regulation were downregulated in p53−/− NPCs (Table 1; all genes p < 0.01). Several classically p53-regulated transcripts were also accordingly differentially expressed lending support to the soundness of the array data. The gene expression array data including fold changes and p values (available in a workable excel sheet upon request) include ∼300 significantly dysregulated genes (two-fold change cut-off) between genotypes.
Table 1.
List of selected differentially regulated genes (p53 null versus wildtype)
| Functional class | Fold change | Up/down |
|---|---|---|
| Oxidative stress | ||
| Sesn2 | 3.1 | Down |
| Dcxr | 24.7 | Down |
| Ephx1 | 2.1 | Down |
| Gpx7 | 2.3 | Up |
| Cox6b2 | 2.2 | Down |
| Wwox | 2 | Up |
| Cyp4f15 | 2.8 | Down |
| Ddit4l | 5.2 | Down |
| Neurogenesis | ||
| Otx1 | 3.4 | Up |
| Dcx | 2.8 | Up |
| Neurog2 | 4.3 | Up |
| Thy1 | 4.2 | Up |
| Nrxn3 | 3.4 | Up |
| Nr2f2 | 2.5 | Up |
| Bhlhe22 (negative regulation) | 4.5 | Down |
| Neurite extension/migration | ||
| Elav14 | 2.8 | Up |
| Prg3 | 2.4 | Up |
| Tagln3 | 3.1 | Up |
| Gdap111 | 2.1 | Up |
| Gdap1 | 2.2 | Up |
| Chl1 | 2.1 | Up |
| GABAergic | ||
| Gad1 | 2.4 | Up |
| Gabra3 | 2.2 | Up |
| Chl1 | 2.1 | Up |
| Glutamatergic | ||
| Grik2 | 2.4 | Up |
| Grin3a | 2 | Up |
| Grin2c | 3 | Up |
| Gria3 | 4.4 | Down |
| Camk2a | 2.5 | Up |
| Cholinergic | ||
| Chrnb1 | 2.7 | Up |
| Dopaminergic | ||
| Moxd1 | 2.2 | Up |
| K+ channels | ||
| Kcnj12 | 2.7 | Down |
| Kcnc1 | 4.8 | Down |
| Kctd4 | 4.7 | Up |
| Dpp10 | 2 | Up |
| Ca2+ channels | ||
| Cacng5 | 4.7 | Down |
Next, we explored the possibility that the increased expression of neurogenic genes might be related to cellular redox status. Indeed, treatment of NPCs with H2O2 or with antioxidant N-acetyl cysteine demonstrated that several of the dysregulated genes, such as Pax6, Otx1, Dcx, and Nr2f2, were responsive to cellular redox balance manipulation (Fig. 7A–F). The expression of p53 target gene and cell cycle regulator p21 was not affected, as opposed to the enhanced expression of Pdgfrα, a classical ROS-responsive gene (Ruef et al., 1998). Thus, we hypothesize that enhanced oxidative conditions may trigger expression of neurogenic genes and thus drive neurogenesis.
Figure 7.

A–F, Expression of genes that promote neurogenesis is responsive to redox regulation when assessed by qRT-PCR (A–D). PdgfRα (E) was used as a ROS regulated positive control (cntr) transcript. Cdkn1a/p21 (F) served as a negative control. The expression of neurogenesis-related genes was measured in neurospheres treated either with 1 μm H2O2 or 1 mm NAC. Data represent mean mRNA expression normalized to β-actin ± SEM from three unrelated experiments, each as triplicates. ★★p < 0.01; ★★★p < 0.001 (two-tail Student's t test).
Four genes putatively related to ROS regulation, Sestrin2 (Sesn2), dicarbonyl/l-xylulose reductase (Dcxr), Epoxide hydrolase 1 (Ephx1), and Redd2/Dditl4 were downregulated in p53−/− NPCs, possibly contributing to the observed increase in ROS (Table 1; Cheong et al., 2009; Malagelada et al., 2011; Son le et al., 2011). Sesn2 was identified previously as being directly regulated by oxidative stress in cancer cells, and it has been linked to a reduction of oxidized peroxiredoxins (Budanov et al., 2002, 2004). First, we confirmed that the expression of Sesn2 in proliferative NPCs is ROS responsive since exogenous ROS induced expression of Sesn2 mRNA (Fig. 8A). Next, we verified the dependence of Sesn2 expression on p53 in our model system by performing qRT-PCR from Ad-GFP-p53- and control Ad-GFP-transduced NPCs. Indeed, transient overexpression of p53 in p53−/− cells induced expression of Sesn2 to a similar level as in wild-type cells (Fig. 8B). Along the same lines, Sesn2 mRNA expression was decreased in p53−/− E13–E16 telencephalons, implying that p53 positively regulates its expression also in vivo (Fig. 8C). Immunoblotting of NPC lysates for Sesn2 demonstrated that p53-null progenitors had lower amount of Sesn2 protein and that p53 overexpression in p53−/− NPCs upon Ad-p53-GFP transduction restored Sesn2 expression to wild-type levels (Fig. 8D). Sesn2 protein was accordingly reduced at E13–E16 in p53−/− telencephalons, as shown by immunoblotting (Fig. 8E).
Figure 8.

A, Expression of Sesn2 mRNA is regulated by ROS. Neurospheres were treated with 1 μm H2O2. H2O2 increased Sesn2 expression by qRT-PCR. Values represent mean Sesn2 mRNA expression normalized to β-actin ± SEM from three unrelated experiments, each as triplicate. B, Expression of Sesn2 mRNA is induced by exogenous p53 expression in p53−/− NPCs. RT-PCR quantification of Sesn2 mRNA from Ad-GFP- and Ad-GFP-p53-transduced proliferative wild-type and p53−/− NPCs. Shown is mean mRNA expression normalized to β-actin ± SD. Independent experiments were conducted in triplicate. C, Sesn2 mRNA is downregulated in E13–E16 p53−/− telencephalons compared to wild type (qRT-PCR). Data represent mean Sesn2 mRNA expression normalized to β-actin ± SD. Three embryos per developmental stage and genotype were examined (each sample in triplicate). D, Immunoblotting for Sesn2 after Ad-GFP and Ad-GFP-p53 infection in p53−/− E13 neurospheres shows that Ad-GFP-p53 induces expression of Sesn2 to the same level as in the wild type. A representative immunoblot is shown. E, Immunoblotting of prenatal telencephalic E11–E16 samples for Sesn2. Sesn2 protein is downregulated in p53−/− telencephalons. Three embryos per developmental stage and genotype were examined. Representative immunoblot is shown. F–H, Expression of exogenous Sesn2 by electroporation decreases ROS in ex vivo E13 telencephalons. ROS of either EF-Sesn2 (G) or EF-empty vector (H) ex vivo electroporated E13 telencephalons were measured by FACS for DCFDA. Plasmid DNA was injected into the lateral ventricle and after 20 h cortices were dissociated to single cells and stained for the ROS indicator DCFDA and FACS was performed. Non-injected hemispheres were used as controls. Data are presented as the mean percentage of DCFDA++ (strongly positive) cells of all cells ± SEM. Two embryos were used for EF-empty vector and five for EF-Sesn2 electroporation. ★p < 0.05; ★★★p < 0.001 (two-tail Student's t test).
To explore the function of Sesn2 in embryonic telencephalons, an ex utero electroporation approach was used. Either an empty vector or a DNA construct encoding Sesn2 was injected into the lateral ventricle of E13 telencephalons. After 22 h, we measured ROS from the hemisphere that was injected with the Sesn2 expression plasmid or with the empty vector, and from the noninjected control hemisphere by FACS. Expression of exogenous Sesn2, which was confirmed by FACS, decreased endogenous ROS compared to the control hemisphere according to the DCFDA ROS indicator (Fig. 8F,G). Nonetheless, no difference in DCFDA staining was detected between the empty plasmid injected hemisphere and the corresponding control hemisphere (Fig. 8H). These data indicate that Sesn2 is able to fine-tune ROS levels in embryonic telencephalons.
PI3K/Akt pathway in p53-dependent neurogenesis
So far, we have shown that p53 modulates ROS levels and expression of genes related to redox regulation, and that ROS accumulation drives neurogenesis in p53−/− mice. In search for further mechanistic insight, we performed knowledge-based pathway analysis on our microarray data, which suggested that the PI3K/Akt pathway, whose activation may be coupled to ROS production in cancer cells (Kamata, 2009), might play a role in p53-dependent regulation of embryonic neurogenic program. Therefore, we postulated that the increase in ROS and DCX+ cells in p53−/− in in vitro NPCs and in vivo might be connected to dysregulation of the PI3K/Akt pathway in p53−/− cells.
We began by investigating whether P-Akt positivity and endogenous ROS levels correlated in neurospheres by performing FACS for P-Akt S473 and the ROS indicator DCFDA in in vitro cultured NPCs. Indeed, p53−/− neural progenitors displayed an increase in the number of P-Akt++ cells, which correlated with DCFDA staining intensity (Fig. 9A). Extension of this analysis to in vitro differentiating NPCs confirmed that the proportion of P-Akt+ cells was higher in p53−/−, in line with the increased number of Tuj1+ neurons produced by differentiating p53−/− cells (Fig. 9B,C). Conversely, overexpression of p53 in p53−/− NPCs by Ad-p53-GFP transduction led to a substantial decrease in the number of P-Akt+ cells (Fig. 9D,E). This was paralleled by a reduction of DCX+ NPCs upon p53 overexpression (Fig. 4B,C).
Figure 9.
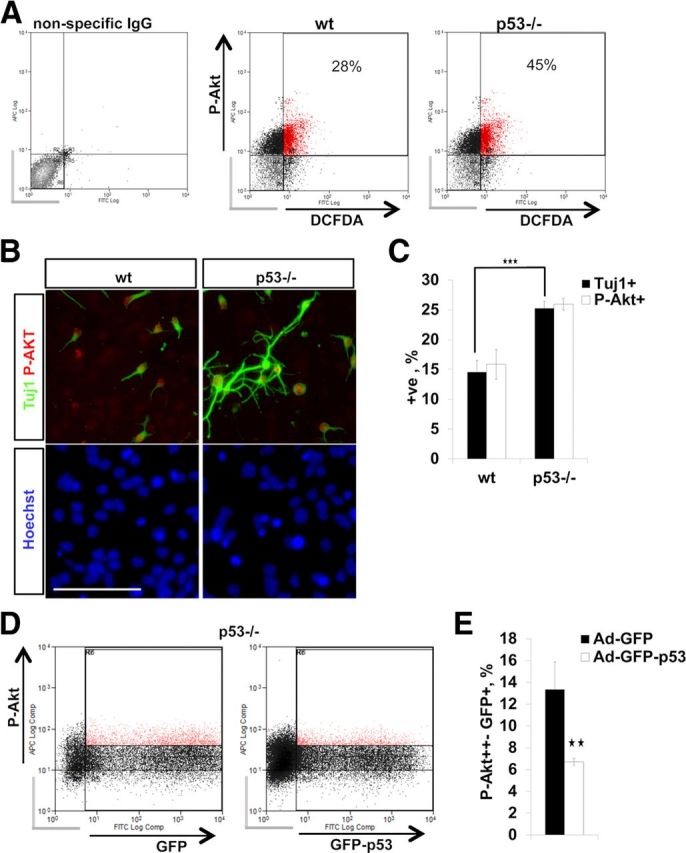
A, FACS of E13 in vitro NPCs for the ROS indicator DCFDA and for P-Akt. p53−/− NPCs exhibit an increase in P-Akt/DCFDA double-positive cells and an increase in the total number of P-Akt+ NPCs. Background signal (nonspecific IgG-stained NPCs; gray bars) was used to set the threshold for signal detection. Percentages show P-AKT/DCFDA double-positive cells. Three independent experiments with similar results were performed. A representative experiment is shown. B, Double immunocytochemistry for Tuj1/Akt phospho-S473 on differentiating wild-type (wt) and p53−/− NPCs (DIV 5). Scale bar, 100 μm. C, The bar graph shows quantification of P-Akt- and Tuj1-positive cells (B). p53−/− differentiating NPCs display an increase in both P-Akt- and Tuj1-positive cells. Data represent the mean percentage of positive cells ± SD from three independent experiments. D, FACS for P-Akt after transduction of p53−/− NPCs with Ad-GFP-p53 or control Ad-GFP (18 h). E, The bar graph shows a decrease in the number of P-Akt+ NPCs after Ad-GFP-p53 transduction compared to control Ad-GFP. Values represent the mean percentage of GFP+/P-Akt+ strongly double-positive cells normalized to GFP+ cells ± SEM from three independent experiments. Gray bars indicate cells not positive for GFP+/P-Akt. ★★p < 0.01; ★★★p < 0.001 (two-tail Student's t test).
Next, we examined the effect of the pharmacological inhibition of the PI3K/Akt pathway on NPC lineage commitment. Pretreatment of p53−/− neurospheres in proliferation conditions with LY294002, a PI3K inhibitor, decreased the number of DCX+ cells, suggesting that the increase in DCX expression in p53−/− NPCs was at least partially due to elevated PI3K/Akt signaling (Fig. 10A,B). Consistently, pretreatment also reduced the number of Tuj1+ neurons generated upon differentiation (Fig. 10C,D). However, p53−/− progenitors displayed a more modest decrease in neuronal differentiation in response to LY pretreatment (Fig. 10C,D). This is reminiscent of the H2O2 prepriming of proliferating p53−/− NPCs that did not show a similar increase in neuronal differentiation as wild-type cells (Fig. 6A,B). Thus, it seems that p53−/− NPCs are “already primed” to a neuronal fate by their more oxidative cellular environment and higher P-Akt levels such that transient inhibition of the PI3K/Akt signaling is unable to turn them away from neuronal fate. This may indicate long-term changes in the signaling involving Akt in such a way that the proliferation phase largely determines subsequent signaling in postmitotic young neurons. In line with this, treatment of neurospheres in proliferation conditions with LY had a long-lasting negative affect on the number of P-Akt+ cells produced upon differentiation (Fig. 10C,E).
Figure 10.
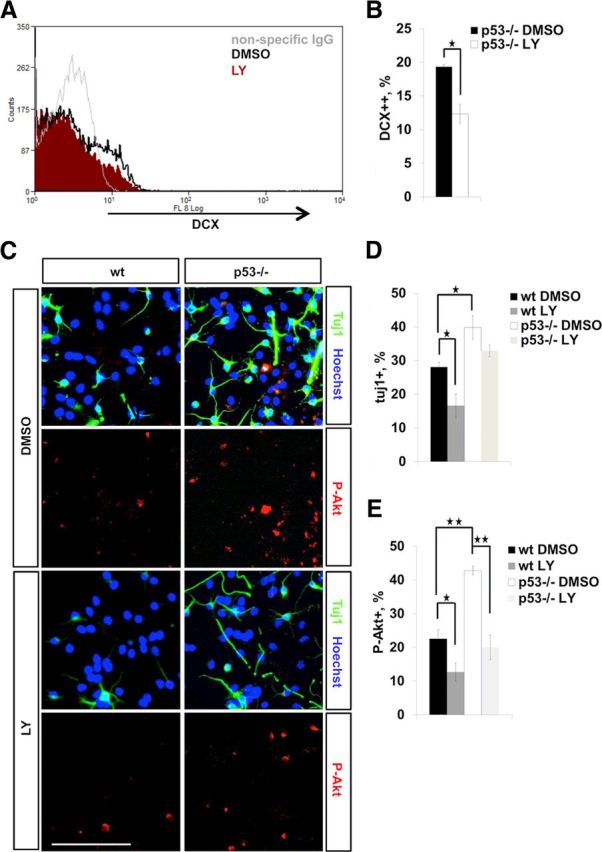
A, FACS of DMSO (control) and 10 μm LY294002 (a PI3K inhibitor) pretreated E13 p53−/− neurospheres. Nonspecific IgG was used for background staining control. B, The bar graph shows that 10 μm LY294002 treatment reduces the number of DCX+ (strongly positive) NPCs as assessed by FACS (A). Data represent mean percentage of DCX++ NPCs ± SEM from three independent experiments. C, Immunocytochemistry for Tuj1 (green) and P-Akt (red) on differentiating wild-type and p53−/− neural progenitors after 10 μm LY294002 pretreatment. Proliferative NPCs were pretreated either with DMSO or 10 μm LY294002, and thereafter plated for differentiation without LY for 5 d. LY294002 pretreatment decreases the number of Tuj1+ and P-Akt+ neurons generated upon differentiation. Scale bar, 100 μm. D, The bar graph shows quantification of Tuj1+ neurons from LY294002-pretreated differentiating NPC cultures. Shown is mean percentage of Tuj1+ neurons normalized to the total number of cells (Hoechst+) ± SEM from three independent experiments. E, The bar graph shows quantification of P-Akt+ neurons from LY294002-treated differentiating NPC cultures. Shown is mean percentage of P-Akt+ neurons normalized to the total number of cells ± SEM from three independent experiments (N = 3). ★p < 0.05; ★★p < 0.01 (two-tail t test).
Together, these data emphasize the importance of the PI3K/Akt signaling in neurogenesis/neuronal maturation and suggest that the premature onset of neurogenesis in p53−/− NPCs is at least in part due to a more oxidative cellular status and increased PI3K/Akt signaling in neural progenitors. Furthermore, they also imply that the elevated ROS/PI3K/Akt signaling could provide a compensatory mechanism, which prevents overproliferation by inducing neurogenesis in p53−/− telencephalons.
Discussion
Increasing experimental evidence suggests that neural stem cells use endogenous ROS in the regulation of their normal cellular physiology. Two different cellular responses to changes in oxidative status have been proposed. In the first one, slight cellular overoxidation is sufficient to inhibit proliferation and to induce differentiation. In the second one, similar changes in oxidative status drive proliferation. The different outcomes have been suggested to depend on intrinsic cellular factors such as the duration of the increase in ROS and the developmental stage, as well as on extracellular signals that may modulate the response (Noble et al., 2005).
Our work emphasizes the importance of ROS and PI3K/Akt signaling in neurogenesis/neuronal maturation and suggests that an enhanced oxidative cellular status and increased PI3K/Akt signaling in neural progenitors leads to premature neurogenesis, which is p53 dependent. However, it is important to highlight that Le Belle et al. (2011) also investigated ROS in the control of adult NPC division and induction of neurogenesis, coming to different conclusions from the present study. They demonstrated that proliferative adult NPCs are intrinsically more oxidized than other cells in the CNS, and that higher ROS levels are critical in maintaining proliferation in a PI3K/Akt-dependent manner. This discrepancy might be explained by assuming that loss of p53 alters this cellular system by further increasing ROS levels above the physiological preference in terms of oxidation.
Therefore, our data can be seen as supportive of the model proposed by Smith et al. (2000), according to which overoxidation inhibits self-renewal and induces differentiation. This interpretation is even more convincing assuming that the apparent lack of differences in the overall proliferation rate in p53-null mice is due to the co-existence of various neural progenitor cell populations with different proliferation rates not measurable by the methods used.
Although p53−/− tumor cells and tissues have been reported to exhibit increased ROS, no evidence for a role of ROS in p53−/− neural progenitor cells or brains was available until now. The work also identifies Sesn2 as a p53 target gene whose downregulation in p53−/− eNPCs is likely to contribute to the elevation in ROS, and thereby neurogenic differentiation in p53−/− telencephalons. However, despite the fact that our data strongly point to p53 as a regulator of neural progenitor cells' redox status, the possible aberrant effect of a complete loss of p53 function compared to physiological conditions during development should not be overlooked.
Previous work demonstrated by in situ hybridization high expression of p53 mRNA in the developing embryonic mouse telencephalon that becomes restricted to the VZ and SVZ from E10.5 onward, the time of the onset of neurogenesis (Schmid et al., 1991; Komarova et al., 1997). When p53-dependent transcriptional activation was investigated using p53-responsive lacZ reporter mice, lacZ expression was detected preferentially in the developing nervous system with a profound decrease in the adult (Gottlieb et al., 1997), whereas mice in which the negative p53 regulators Mdm2 or Mdm4 were deleted specifically in the CNS showed that p53 is active in the developing telencephalon. A subset of p53−/− mouse embryos suffers from defective neural tube closure in the hindbrain–midbrain boundary, resulting in anencephaly and subsequent exencephaly, clearly suggesting a role for p53 in brain development (Armstrong et al., 1995; Sah et al., 1995), although p53−/− embryos may also develop normally without gross structural abnormalities. These data suggest that p53 may indeed play a role in the developing telencephalon, but in its absence, other factors, such as the other p53 family members p63 and p73, both expressed in embryonic NPCs (Dugani et al., 2009; Talos et al., 2010), compensate for it. Redundancy is a common theme in the regulation of eNPC homeostasis, as, for example, the forkhead transcription factor (FoxO)-null mice demonstrate (Paik et al., 2009; Renault et al., 2009). Yet, the data in this study point to another possibility. The lack of p53 leads to an increase in cellular ROS and to an activation of the PI3K/Akt signaling, thereby launching the neurogenic program and preventing excessive proliferation.
During neurogenesis, a chain of successive waves of TFs induces expression of the next wave of TFs. The level and duration of the expression of particular TFs determines whether the cell continues as an uncommitted stem cell, commits to a neurogenic proliferative fate, or exits the cell cycle. Our study identifies Pax6, Otx1, Nr2f2, and Dcx as genes that are regulated in a p53 and redox state-dependent manner. A causal relationship between Sox1–Pax6–Ngn2–Dcx gene expression has been reported (Sansom et al., 2009; Suter et al., 2009). Sox1 maintains neuroepithelial cells in their uncommitted stage, whereas Pax6 drives them to a neurogenic pathway and also to cell cycle exit (Kan et al., 2007). In the current work, Sox1 was found to be downregulated, whereas the other TFs mentioned were upregulated in p53−/− NPCs, including Pax6, which binds to and induces the expression, for instance, of Nr2f2 and Ngn2, and also positively regulates Otx1(Sansom et al., 2009).
At least four other tumor suppressors besides p53 have been found to play a part in the maintenance of stem cells, including neural stem cell homeostasis: the PR domain containing Prdm16, promyelocytic leukemia protein (Pml), the FoxOs family, and the phosphatase and tensin homolog (Groszer et al., 2001; Regad et al., 2009; Huang et al., 2011; Zhang et al., 2011). Similarly to p53, they are expressed in the germinal zones of the developing telencephalon, and their expression decreases in differentiating cells. In addition, they have been connected with the negative regulation of the PI3K/Akt signaling important not only in stem cells, but also in tumor cell biology. Akin to p53−/− mice, mice null for a single FoxO (forkhead) transcription factor do not show developmental abnormalities in the brain. Yet, in early adulthood, the SVZ of single null FoxO mice begins to exhibit increased proliferation, followed by a decline in NSC pool and neurogenesis by 1 year of age. The absence of Prdm16 or FoxO double knock-out leads after an initial increase in ROS and proliferation in adult NSCs and hematopoietic stem cells to a concomitant depletion of stem cells.
Our findings may also have implications for neurodevelopmental cancer formation as well as for neurodegenerative disorders. In fact, while both p53 and oxidative stress have a recognized role in both brain tumors of developmental origin and in neurodegeneration, the link between the two is still missing. Both medulloblastoma and glioblastoma, tumors where neural precursor cells undergo transformation and contribute to the onset of the disease (Mantamadiotis and Taraviras, 2011), are associated with oxidative stress or specific p53 loss of function mutations (Wanka et al., 2012). In support of this, p53−/− mice showed enhanced NSC self-renewal in the adult SVZ in vivo, a finding associated with glioma-like changes (Wang et al., 2009). Our data might suggest that loss of p53 may enhance its tumorigenic potential in these tumors also by failing to buffer ROS. This deserves further investigation, as it may suggest specific additional molecular therapeutic targets for tumor suppression.
ROS have long been implicated in the pathogenesis of neurodegenerative disorders of inflammatory and primarily neurodegenerative origin (Lull and Block, 2010; Patten et al., 2010), and p53 has been associated both with neuroregeneration and neurodegeneration (Floriddia et al., 2012; Lanni et al., 2012). It would be interesting to examine whether p53-dependent regulation of ROS would also play a role in both postinjury inflammatory and neurotoxic environments, and whether it may influence the survival of mature neurons as well as the fate of adult stem cells.
Footnotes
This work was supported Hertie Foundation grants and by Deutsche Förschung Gemeinschaft-DI Grants 149711 and 140731 (S.D.G.). We thank Bernd Knöll for his critical reading of this manuscript and Francesc X Soriano for providing the Sesn2 plasmid DNA.
References
- Armesilla-Diaz A, Bragado P, Del Valle I, Cuevas E, Lazaro I, Martin C, Cigudosa JC, Silva A. p53 Regulates the self-renewal and differentiation of neural precursors. Neuroscience. 2009;158:1378–1389. doi: 10.1016/j.neuroscience.2008.10.052. [DOI] [PubMed] [Google Scholar]
- Armstrong JF, Kaufman MH, Harrison DJ, Clarke AR. High-frequency developmental abnormalities in p53-deficient mice. Curr Biol. 1995;5:931–936. doi: 10.1016/S0960-9822(95)00183-7. [DOI] [PubMed] [Google Scholar]
- Budanov AV, Shoshani T, Faerman A, Zelin E, Kamer I, Kalinski H, Gorodin S, Fishman A, Chajut A, Einat P, Skaliter R, Gudkov AV, Chumakov PM, Feinstein E. Identification of a novel stress-responsive gene Hi95 involved in regulation of cell viability. Oncogene. 2002;21:6017–6031. doi: 10.1038/sj.onc.1205877. [DOI] [PubMed] [Google Scholar]
- Budanov AV, Sablina AA, Feinstein E, Koonin EV, Chumakov PM. Regeneration of peroxiredoxins by p53-regulated sestrins, homologs of bacterial AhpD. Science. 2004;304:596–600. doi: 10.1126/science.1095569. [DOI] [PubMed] [Google Scholar]
- Cheong AW, Lee YL, Liu WM, Yeung WS, Lee KF. Oviductal microsomal epoxide hydrolase (EPHX1) reduces reactive oxygen species (ROS) level and enhances preimplantation mouse embryo development. Biology Reprod. 2009;81:126–132. doi: 10.1095/biolreprod.108.071449. [DOI] [PubMed] [Google Scholar]
- Chuikov S, Levi BP, Smith ML, Morrison SJ. Prdm16 promotes stem cell maintenance in multiple tissues, partly by regulating oxidative stress. Nat Cell Biol. 2010;12:999–1006. doi: 10.1038/ncb2101. [DOI] [PMC free article] [PubMed] [Google Scholar]
- D'Autréaux B, Toledano MB. ROS as signalling molecules: mechanisms that generate specificity in ROS homeostasis. Nat Rev Mol Cell Biol. 2007;8:813–824. doi: 10.1038/nrm2256. [DOI] [PubMed] [Google Scholar]
- Dugani CB, Paquin A, Fujitani M, Kaplan DR, Miller FD. p63 antagonizes p53 to promote the survival of embryonic neural precursor cells. J Neurosci. 2009;29:6710–6721. doi: 10.1523/JNEUROSCI.5878-08.2009. [DOI] [PMC free article] [PubMed] [Google Scholar]
- Floriddia EM, Rathore KI, Tedeschi A, Quadrato G, Wuttke A, Lueckmann JM, Kigerl KA, Popovich PG, Di Giovanni S. p53 regulates the neuronal intrinsic and extrinsic responses affecting the recovery of motor function following spinal cord injury. J Neurosci. 2012;32:13956–13970. doi: 10.1523/JNEUROSCI.1925-12.2012. [DOI] [PMC free article] [PubMed] [Google Scholar]
- Gil-Perotin S, Marin-Husstege M, Li J, Soriano-Navarro M, Zindy F, Roussel MF, Garcia-Verdugo JM, Casaccia-Bonnefil P. Loss of p53 induces changes in the behavior of subventricular zone cells: implication for the genesis of glial tumors. J Neurosci. 2006;26:1107–1116. doi: 10.1523/JNEUROSCI.3970-05.2006. [DOI] [PMC free article] [PubMed] [Google Scholar]
- Giorgio M, Trinei M, Migliaccio E, Pelicci PG. Hydrogen peroxide: a metabolic by-product or a common mediator of ageing signals? Nat Rev Mol Cell Biol. 2007;8:722–728. doi: 10.1038/nrm2240. [DOI] [PubMed] [Google Scholar]
- Gomes A, Fernandes E, Lima JL. Fluorescence probes used for detection of reactive oxygen species. J Biochem Biophys Methods. 2005;65:45–80. doi: 10.1016/j.jbbm.2005.10.003. [DOI] [PubMed] [Google Scholar]
- Gottlieb E, Haffner R, King A, Asher G, Gruss P, Lonai P, Oren M. Transgenic mouse model for studying the transcriptional activity of the p53 protein: age- and tissue-dependent changes in radiation-induced activation during embryogenesis. EMBO J. 1997;16:1381–1390. doi: 10.1093/emboj/16.6.1381. [DOI] [PMC free article] [PubMed] [Google Scholar]
- Groszer M, Erickson R, Scripture-Adams DD, Lesche R, Trumpp A, Zack JA, Kornblum HI, Liu X, Wu H. Negative regulation of neural stem/progenitor cell proliferation by the Pten tumor suppressor gene in vivo. Science. 2001;294:2186–2189. doi: 10.1126/science.1065518. [DOI] [PubMed] [Google Scholar]
- Huang Y, Hou JK, Chen TT, Zhao XY, Yan ZW, Zhang J, Yang J, Kogan SC, Chen GQ. PML-RARalpha enhances constitutive autophagic activity through inhibiting the Akt/mTOR pathway. Autophagy. 2011;7:1132–1144. doi: 10.4161/auto.7.10.16636. [DOI] [PMC free article] [PubMed] [Google Scholar]
- Kamata T. Roles of Nox1 and other Nox isoforms in cancer development. Cancer Sci. 2009;100:1382–1388. doi: 10.1111/j.1349-7006.2009.01207.x. [DOI] [PMC free article] [PubMed] [Google Scholar]
- Kan L, Jalali A, Zhao LR, Zhou X, McGuire T, Kazanis I, Episkopou V, Bassuk AG, Kessler JA. Dual function of Sox1 in telencephalic progenitor cells. Dev Biol. 2007;310:85–98. doi: 10.1016/j.ydbio.2007.07.026. [DOI] [PMC free article] [PubMed] [Google Scholar]
- Komarova EA, Chernov MV, Franks R, Wang K, Armin G, Zelnick CR, Chin DM, Bacus SS, Stark GR, Gudkov AV. Transgenic mice with p53-responsive lacZ: p53 activity varies dramatically during normal development and determines radiation and drug sensitivity in vivo. EMBO J. 1997;16:1391–1400. doi: 10.1093/emboj/16.6.1391. [DOI] [PMC free article] [PubMed] [Google Scholar]
- Lanni C, Racchi M, Memo M, Govoni S, Uberti D. p53 at the crossroads between cancer and neurodegeneration. Free Rad Biol Med. 2012;52:1727–1733. doi: 10.1016/j.freeradbiomed.2012.02.034. [DOI] [PubMed] [Google Scholar]
- Le Belle JE, Orozco NM, Paucar AA, Saxe JP, Mottahedeh J, Pyle AD, Wu H, Kornblum HI. Proliferative neural stem cells have high endogenous ROS levels that regulate self-renewal and neurogenesis in a PI3K/Akt-dependant manner. Cell Stem Cell. 2011;8:59–71. doi: 10.1016/j.stem.2010.11.028. [DOI] [PMC free article] [PubMed] [Google Scholar]
- Lull ME, Block ML. Microglial activation and chronic neurodegeneration. Neurotherapeutics. 2010;7:354–365. doi: 10.1016/j.nurt.2010.05.014. [DOI] [PMC free article] [PubMed] [Google Scholar]
- Malagelada C, López-Toledano MA, Willett RT, Jin ZH, Shelanski ML, Greene LA. RTP801/REDD1 regulates the timing of cortical neurogenesis and neuron migration. J Neurosci. 2011;31:3186–3196. doi: 10.1523/JNEUROSCI.4011-10.2011. [DOI] [PMC free article] [PubMed] [Google Scholar]
- Mantamadiotis T, Taraviras S. Self-renewal mechanisms in neural cancer stem cells. Front Biosci. 2011;16:598–607. doi: 10.2741/3708. [DOI] [PubMed] [Google Scholar]
- Meletis K, Wirta V, Hede SM, Nistér M, Lundeberg J, Frisén J. p53 suppresses the self-renewal of adult neural stem cells. Development. 2006;133:363–369. doi: 10.1242/dev.02208. [DOI] [PubMed] [Google Scholar]
- Noble M, Mayer-Pröschel M, Pröschel C. Redox regulation of precursor cell function: insights and paradoxes. Antioxid Redox Signal. 2005;7:1456–1467. doi: 10.1089/ars.2005.7.1456. [DOI] [PubMed] [Google Scholar]
- Paik JH, Ding Z, Narurkar R, Ramkissoon S, Muller F, Kamoun WS, Chae SS, Zheng H, Ying H, Mahoney J, Hiller D, Jiang S, Protopopov A, Wong WH, Chin L, Ligon KL, DePinho RA. FoxOs cooperatively regulate diverse pathways governing neural stem cell homeostasis. Cell Stem Cell. 2009;5:540–553. doi: 10.1016/j.stem.2009.09.013. [DOI] [PMC free article] [PubMed] [Google Scholar]
- Patten DA, Germain M, Kelly MA, Slack RS. Reactive oxygen species: stuck in the middle of neurodegeneration. J Alzheimer's Dis. 2010;20(Suppl 2):S357–S367. doi: 10.3233/JAD-2010-100498. [DOI] [PubMed] [Google Scholar]
- Regad T, Bellodi C, Nicotera P, Salomoni P. The tumor suppressor Pml regulates cell fate in the developing neocortex. Nat Neurosci. 2009;12:132–140. doi: 10.1038/nn.2251. [DOI] [PubMed] [Google Scholar]
- Renault VM, Rafalski VA, Morgan AA, Salih DA, Brett JO, Webb AE, Villeda SA, Thekkat PU, Guillerey C, Denko NC, Palmer TD, Butte AJ, Brunet A. FoxO3 regulates neural stem cell homeostasis. Cell Stem Cell. 2009;5:527–539. doi: 10.1016/j.stem.2009.09.014. [DOI] [PMC free article] [PubMed] [Google Scholar]
- Ruef J, Rao GN, Li F, Bode C, Patterson C, Bhatnagar A, Runge MS. Induction of rat aortic smooth muscle cell growth by the lipid peroxidation product 4-hydroxy-2-nonenal. Circulation. 1998;97:1071–1078. doi: 10.1161/01.CIR.97.11.1071. [DOI] [PubMed] [Google Scholar]
- Sablina AA, Budanov AV, Ilyinskaya GV, Agapova LS, Kravchenko JE, Chumakov PM. The antioxidant function of the p53 tumor suppressor. Nat Med. 2005;11:1306–1313. doi: 10.1038/nm1320. [DOI] [PMC free article] [PubMed] [Google Scholar]
- Sah VP, Attardi LD, Mulligan GJ, Williams BO, Bronson RT, Jacks T. A subset of p53-deficient embryos exhibit exencephaly. Nat Genet. 1995;10:175–180. doi: 10.1038/ng0695-175. [DOI] [PubMed] [Google Scholar]
- Sansom SN, Griffiths DS, Faedo A, Kleinjan DJ, Ruan Y, Smith J, van Heyningen V, Rubenstein JL, Livesey FJ. The level of the transcription factor Pax6 is essential for controlling the balance between neural stem cell self-renewal and neurogenesis. PLoS Genet. 2009;5:e1000511. doi: 10.1371/journal.pgen.1000511. [DOI] [PMC free article] [PubMed] [Google Scholar]
- Schmid P, Lorenz A, Hameister H, Montenarh M. Expression of p53 during mouse embryogenesis. Development. 1991;113:857–865. doi: 10.1242/dev.113.3.857. [DOI] [PubMed] [Google Scholar]
- Smith J, Ladi E, Mayer-Proschel M, Noble M. Redox state is a central modulator of the balance between self-renewal and differentiation in a dividing glial precursor cell. Proc Natl Acad Sci U S A. 2000;97:10032–10037. doi: 10.1073/pnas.170209797. [DOI] [PMC free article] [PubMed] [Google Scholar]
- Son le T, Ko KM, Cho JH, Singaravelu G, Chatterjee I, Choi TW, Song HO, Yu JR, Park BJ, Lee SK, Ahnn J. DHS-21, a dicarbonyl/L-xylulose reductase (DCXR) ortholog, regulates longevity and reproduction in Caenorhabditis elegans. FEBS Lett. 2011;585:1310–1316. doi: 10.1016/j.febslet.2011.03.062. [DOI] [PubMed] [Google Scholar]
- Suter DM, Tirefort D, Julien S, Krause KH. A Sox1 to Pax6 switch drives neuroectoderm to radial glia progression during differentiation of mouse embryonic stem cells. Stem Cells. 2009;27:49–58. doi: 10.1634/stemcells.2008-0319. [DOI] [PubMed] [Google Scholar]
- Talos F, Abraham A, Vaseva AV, Holembowski L, Tsirka SE, Scheel A, Bode D, Dobbelstein M, Brück W, Moll UM. p73 is an essential regulator of neural stem cell maintenance in embryonal and adult CNS neurogenesis. Cell Death Differ. 2010;17:1816–1829. doi: 10.1038/cdd.2010.131. [DOI] [PMC free article] [PubMed] [Google Scholar]
- Ushio-Fukai M. Redox signaling in angiogenesis: role of NADPH oxidase. Cardiovasc Res. 2006;71:226–235. doi: 10.1016/j.cardiores.2006.04.015. [DOI] [PubMed] [Google Scholar]
- Wang Y, Yang J, Zheng H, Tomasek GJ, Zhang P, McKeever PE, Lee EY, Zhu Y. Expression of mutant p53 proteins implicates a lineage relationship between neural stem cells and malignant astrocytic glioma in a murine model. Cancer Cell. 2009;15:514–526. doi: 10.1016/j.ccr.2009.04.001. [DOI] [PMC free article] [PubMed] [Google Scholar]
- Wanka C, Steinbach JP, Rieger J. Tp53-induced glycolysis and apoptosis regulator (TIGAR) protects glioma cells from starvation-induced cell death by up-regulating respiration and improving cellular redox homeostasis. J Biol Chem. 2012;287:33436–33446. doi: 10.1074/jbc.M112.384578. [DOI] [PMC free article] [PubMed] [Google Scholar]
- Zhang X, Rielland M, Yalcin S, Ghaffari S. Regulation and function of FoxO transcription factors in normal and cancer stem cells: what have we learned? Current Drug Targets. 2011;12:1267–1283. doi: 10.2174/138945011796150325. [DOI] [PubMed] [Google Scholar]