

Abstract
The human cerebral cortex appears to shrink during adolescence. To delineate the dynamic morphological changes involved in this process, 52 healthy male and female adolescents (11–17 years old) were neuroimaged twice using magnetic resonance imaging, approximately 2 years apart. Using a novel morphometric analysis procedure combining the FreeSurfer and BrainVisa image software suites, we quantified global and lobar change in cortical thickness, outer surface area, the gyrification index, the average Euclidean distance between opposing sides of the white matter surface (gyral white matter thickness), the convex (“exposed”) part of the outer cortical surface (hull surface area), sulcal length, depth, and width. We found that the cortical surface flattens during adolescence. Flattening was strongest in the frontal and occipital cortices, in which significant sulcal widening and decreased sulcal depth co-occurred. Globally, sulcal widening was associated with cortical thinning and, for the frontal cortex, with loss of surface area. For the other cortical lobes, thinning was related to gyral white matter expansion. The overall flattening of the macrostructural three-dimensional architecture of the human cortex during adolescence thus involves changes in gray matter and effects of the maturation of white matter.
Introduction
Adolescence is a period of important cortical brain changes for which longitudinal MRI studies are ideally suited. Recent findings suggest that, during adolescence in both sexes, the cortex globally contracts because of cortical thinning (Shaw et al., 2008; Blakemore, 2012; Brown et al., 2012; van Soelen et al., 2012), which may be highly heritable (van Soelen et al., 2012). Annual reductions are found to be higher than 1% across most parts of the cortex (van Soelen et al., 2012; Tamnes et al., 2013) and may follow a posteroanterior pattern, with medial and dorsolateral prefrontal areas the last to show decline (Gogtay et al., 2004; Tamnes et al., 2013). During adolescence, development of gyral and sulcal surface area (SA) shows a more subtle decline compared with cortical thickness (CT) (Raznahan et al., 2011; Brown et al., 2012). Subcortical white matter (WM) volume continues to expand linearly in most but not all subcortical regions from childhood to early adulthood (Lenroot et al., 2007; Tamnes et al., 2010; Brouwer et al., 2012; Brown et al., 2012). The direct relationship among these processes is not well understood, nor is it known whether such a relationship is invariant over different cortical regions; better knowledge about these issues could provide important insights into the dynamics of cortical development during adolescence.
This study used novel surface-based morphometric methods that yielded two improvements with respect to previous surface-based studies focusing on CT and SA during brain development. First, the present analysis incorporates a new and detailed set of sulcal measurements in addition to gyral measures of CT and SA. Cortical SA varies between individuals because of differences in either “exposed” (gyral) or “hidden” (sulcal) surface area or both. Hidden sulcal SA makes up the largest part of the human cortical surface (Van Essen and Drury, 1997) and varies between individuals because of changes in sulcal depth (SD), length (SL), and width (SW). Second, cortical thinning during adolescence may partly be an artifact of the maturation of WM tracts that cause voxels at the interface between WM and gray matter (GM) to change their classification (Sowell et al., 2004; Shaw et al., 2008; Paus, 2010).
The present analysis simultaneously examines the changes over time in cortical SA, CT, gyrification index (GI), hull surface area (HS), gyral WM thickness (WT), SD, SL, and SW to gain better insight into both the overall dynamics of cortical development and to examine differences between different cortical regions during adolescence. The direct dependency between WT and CT was also examined to clarify to what degree cortical changes might be attributable to WM maturation. Longitudinal (2 years) changes in these parameters were examined in 52 typically developing male and female adolescents (all younger than 18 years).
Materials and Methods
MRI data were collected as part of a 2 year longitudinal multicenter study of first-episode psychosis with onset in adolescence, which has been described comprehensively previously (Castro-Fornieles et al., 2007). Healthy controls were recruited from publicly funded schools in the community. Subjects were offered a coupon to buy school supplies in compensation for their participation, and a trained psychologist conducted a preliminary telephone screening to check for inclusion criteria. Those who passed the initial screening were interviewed with their relatives at the clinical centers by experienced child and adolescent psychiatrists.
The inclusion criteria included the following: (1) aged between 7 and 17 years at the time of first evaluation; (2) no current or previous psychiatric disorder as measured by the Kiddie Schedule for Affective Disorders and Schizophrenia, Present, and Lifetime version (K-SADS-PL; a semi-structured diagnostic interview designed to assess current and past psychopathologic conditions (Kaufman et al., 1997); and (3) no neurological disorders, head trauma, or mental retardation based on Diagnostic and Statistical Manual of Mental Disorders, fourth edition (DSM-IV) criteria (American Psychiatric Association, 1994).
The study was approved by the institutional review boards of participating clinical centers. After the study was thoroughly explained to the participants, written informed consent was obtained from both the legal representatives and the individuals (if older than 16 years of age). All participants met MRI safety criteria.
A total of 98 subjects were initially included of which a subsample of 70 subjects completed baseline and longitudinal (2 years) imaging. Image quality was checked before image processing using two tools. The first is the “check sample homogeneity” tool in the SPM-VBM8 toolbox (version r435; http://dbm.neuro.uni-jena.de/vbm/check-sample-homogeneity/). This tool calculates the SD by the sum of the squared distance of each image from the sample mean. Images that were more than 2 SDs from the mean were checked visually and excluded if deemed of insufficient quality. The second was the Freesurfer QA tool (version 5.1; http://surfer.nmr.mgh.harvard.edu/fswiki/QATools), which generates snapshots of anatomically labeled surfaces that were checked for major topological defects and label accuracy. Images were excluded if deemed of insufficient quality 18 (mean ± SD age, 15.1 ± 1.6 years; five females) of the original 70 subjects had insufficient image quality and were excluded from the study, leaving a sample of 52 subjects (20 females; Table 1).
Table 1.
Sociodemographics at baseline of the sample (n = 52)
| Age at baseline (years) | 15.4 ± 1.5 |
| Age at follow-up (years) | 17.5 ± 1.6 |
| Interscan interval (years) | 2.1 ± 0.3 |
| Age range (years) | 11–17 |
| Sex, n (% male) | 32 (61.5) |
| Handedness, n (% right) | 44 (84.6) |
| Parental education (years) | 14.1 ± 4.1 |
| Parental socioeconomic status (1/2/3/4/5), n | 6/16/15/3/12 |
| Estimated IQ | 108 ± 17.6 |
| IQ range | 73–141 |
| Ethiticity (Hispanic/white/other) | 3/48/1 |
Clinical and functional assessment
The diagnostic and clinical assessments and the functional assessments (including IQ) were performed at the corresponding site by trained psychiatrists or neuropsychologists, respectively, at baseline and follow-up. The rater was the same for each subject at baseline and at the 2-year follow-up assessment visit. Each neuropsychologist had been trained previously in the use of the IQ scales before starting assessment and had to reach good reliability with other previously trained neuropsychologists (an intraclass correlation coefficient higher than 0.80). Diagnosis was established according to DSM-IV criteria, using the Spanish K-SADS-PL. Parents and healthy controls were interviewed separately by psychiatrists trained in the use of this instrument. Diagnostic consensus was achieved when the presence or absence of a psychiatric disorder was in doubt. The Pervasive Developmental Disorder exclusion diagnoses were made following clinical and DSM-IV criteria.
The vocabulary, information, and block design subtests of the Wechsler Intelligence Scale for Children–Revised or the Wechsler Adult Intelligence Scale, third edition, were used to estimate the IQ of those <16 or ≥16 years of age, respectively (Ringe et al., 2002), and is reported to show good correspondence with full-scale IQ (Satler, 2001). Handedness was assessed by means of item five of the Neurological Evaluation Scale (Buchanan and Heinrichs, 1989).
MRI acquisition
All subjects had their two scans acquired using the same scanner and the acquisition parameters are shown in the Table 2. Data were collected at each center and processed at one site only. Two magnetic resonance sequences were acquired for all the participants: a 3D T1-weighted sagittal MPRAGE and a 3D T2-weighted axial turbo spin echo.
Table 2.
Acquisition parameters as well as number of subjects for each scanner
| Scanner | n (males) | Age at baseline | Voxel size (mm3) | FOV (mm2) | Acquisition matrix | TR (ms) | TE (ms) | Flip angle (°) | |
|---|---|---|---|---|---|---|---|---|---|
| Philips Gyroscan ACS 1.5T | 26 (16) | 15.3 ± 1.4 | T1 | 1.0 × 1.0 × 1.5 | 256 × 256 | 256 × 256 | 15.3 | 4.6 | 30 |
| T2 | 1.0 × 1.0 × 3.5 | 256 × 256 | 256 × 256 | 5.8 | 120 | 90 | |||
| Siemens Symphony 1.5T | 14 (8) | 15.9 ± 0.9 | T1 | 1.0 × 1.0 × 1.5 | 256 × 256 | 256 × 256 | 18.1 | 2.39 | 20 |
| T2 | 0.98 × 0.98 × 3.5 | 256 × 180 | 256 × 180 | 5.8 | 120 | 150 | |||
| GE Genesis Signa 1.5T | 4 (2) | 13.8 ± 2.1 | T1 | 0.98 × 0.98 × 1.5 | 250 × 250 | 256 × 256 | 12.1 | 5.2 | 20 |
| T2 | 0.98 × 0.98 × 3.5 | 250 × 250 | 256 × 256 | 5.8 | 126 | 90 | |||
| GE Genesis Signa 1.5T | 6 (5) | 16.7 ± 0.5 | T1 | 0.98 × 0.98 × 1.5 | 250 × 250 | 256 × 256 | 10.9 | 4.6 | 20 |
| T2 | 0.98 × 0.98 × 3.5 | 250 × 250 | 256 × 256 | 5.8 | 126 | 90 | |||
| Siemens Symphony 1.5T | 2 (1) | 15.9 ± 0.9 | T1 | 0.98 × 0.98 × 2.0 | 250 × 250 | 256 × 256 | 20.0 | 5.04 | 15 |
| T2 | 1.0 × 1.0 × 3.5 | 256 × 192 | 256 × 192 | 5.8 | 116 | 150 |
Both T1- and T2-weighted images were used for clinical neurodiagnostic evaluation by an independent neuroradiologist. No participants showed clinically significant brain pathology.
Image analyses
Lobar CT, SA, GI, and WT.
The FreeSurfer longitudinal stream (version 5.1) was used to generate accurate unbiased baseline and follow-up white and pial surfaces, their voxel-based representations, the “ribbon” image (Reuter and Fischl, 2011; Reuter et al., 2012), and a lobar cortical parcellation (Dale et al., 1999; Fischl et al., 1999; Desikan et al., 2006; Reuter and Fischl, 2011; Reuter et al., 2012). In the FreeSurfer cross-sectional analysis, each time point would be processed independently for each subject. These processes involve solving many complex nonlinear optimization problems that are typically calculated using iterative methods. Such methods need starting conditions that may introduce biases in the final results. The FreeSurfer longitudinal stream is designed to minimize bias with respect to any time point in a subject. The longitudinal analysis uses results from the cross-sectional analysis and consists of two main steps: (1) creation of a template for each subject using all time points to build an average subject anatomy and (2) analysis of each time point using information from the template and the individual cross-sectional runs to initialize several of the segmentation algorithms. This procedure of using the repeated measures as common information from the subject to initialize the processing in each time point can reduce variability compared with independent processing, as has been shown recently (Reuter et al., 2012). Lobar CT and lobar pial SA were calculated from the WM and GM surface (Fig. 1). FreeSurfer measurements of CT and SA have been validated via histological and manual measurements and have demonstrated to show good test–retest reliability across scanner manufacturers (Rosas et al., 2002; Kuperberg et al., 2003; Han et al., 2006).
Figure 1.
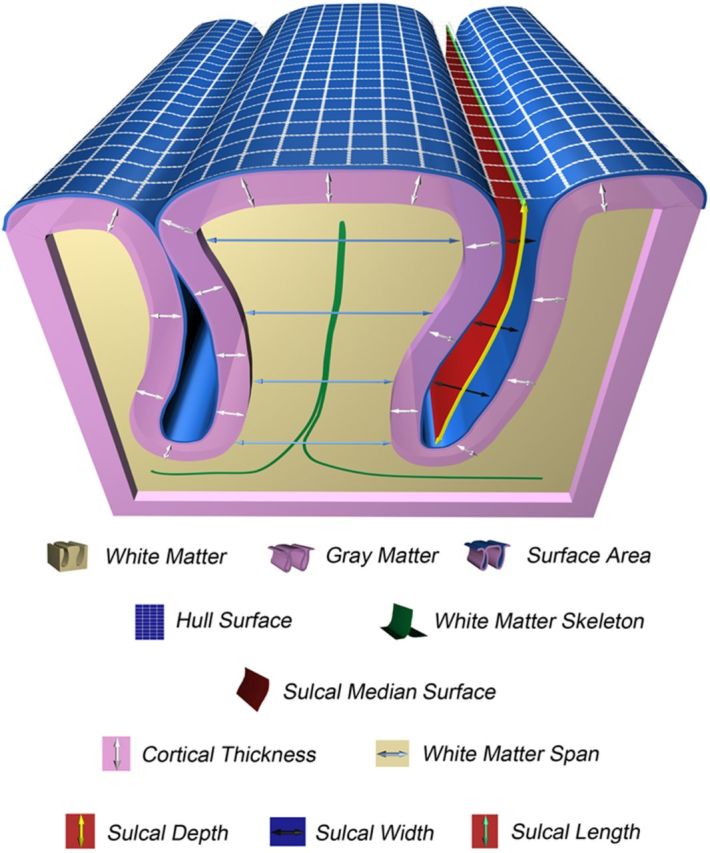
Schematic representation of a gyrus and sulcus representing the different cortical morphometrics used in the current study.
The lobar GI was calculated to assess the degree of lobar gyrification (Fig. 2; Zilles et al., 1988). The GI is defined as the lobar cortical SA divided by the lobar hemispheric HS and represents the amount of sulcal SA.
Figure 2.

Parcellated hemispheric cortical surface overlaid with parcellated wire-frame representation of the cortical surface hull.
Lobar WT was estimated using a medial gyral WM surface that was generated using the FreeSurfer WM segmentation derived from the ribbon image. The medial gyral WM surface is the surface that transverses the gyral WM space, parallel to the gyral GM/WM borders and covers the entire gyral “depth” from crest to base. Lobar WT is calculated as the Euclidean distance between two points residing on opposing sides of the FreeSurfer white surface in the direction normal to the medial gyral WM surface averaged over all gyri pertaining to a lobe (Fig. 1; Kochunov et al., 2009, 2012).
Lobar SD, SL, and SW.
The ribbon images of each subject were imported into the BrainVisa (version 4.2.1) Morphologist 2012 pipeline (Fig. 3). Using default settings, the ribbon image was used to generate a GM/CSF mask from which the cortical sulci were then automatically segmented throughout the cortex, with the cortical sulci corresponding to the crevasse bottoms of the “landscape,” the altitude of which is defined by image intensity. This definition provides a stable and robust median sulcal surface definition that is not affected by variations in the CT or width or by the GM/WM contrast (Mangin et al., 2004; Jouvent et al., 2011). The median sulcal surface spans the entire space contained in a sulcus, from the fundus to its intersection with the hull. Median sulcal surfaces were automatically labeled (Perrot et al., 2011). Thereafter, the median sulcal surfaces were relabeled into lobes by assigning each labeled sulcus to a lobe based on an a priori definition. Lobar SD is defined as the geodesic distance between the fundus and the hull averaged over all points along all median sulcal surfaces pertaining to a lobe (Fig. 1; Jouvent et al., 2011; Kochunov et al., 2012). Lobar SL is measured on the hull and is defined as the distance of the median sulcal surface intersecting the hull, summed over all median sulcal surfaces pertaining to a lobe (Fig. 1). Lobar SW is defined as the distance between each gyral bank averaged over all points along all median sulcal surfaces pertaining to a lobe (Fig. 1; Jouvent et al., 2011; Liu et al., 2011; Kochunov et al., 2012).
Figure 3.
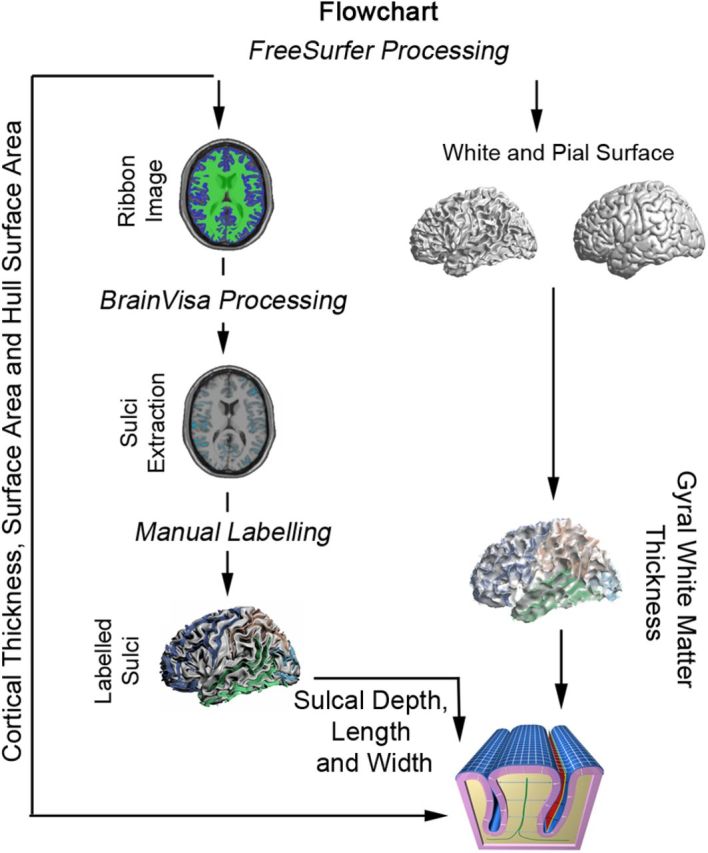
Schematic representation of the image processing. FreeSurfer (version 5.1) and BrainVisa (version 4.2.1) software were combined.
All of the measurements were either summed (for SA, HS, and SL) or averaged (for CT, GI, WT, SD, and SW) across hemispheres. All of the measurements were done in the native space of the subject's images. For each subject, all of the image processing steps were visually checked, and no gross errors were found.
Statistics
Statistical analyses were performed using SPSS (version 13.0). Normality of the distributions was checked before parametric analyses. Percentage change over time relative to baseline was calculated as (follow-up measurement − baseline measurement)/baseline measurement × 100.
Age at baseline, sex, interaction between age and sex, scanner, and time between scan acquisitions may influence relative change in brain morphology over time (Giedd et al., 1999). These variables and factors were inserted in linear regression analyses with measures of percentage change in lobar brain morphology metrics as dependent variables. Of 32 variables, a significant effect of site was found for percentage change in parietal surface area only. No other significant main or interaction effects were found considering a p value < 0.05 uncorrected for multiple comparisons. Therefore, age at baseline, sex, interaction of age and sex, scanner, and time between acquisitions were not included in the main analyses.
Thereafter, three inferential analyses were conducted. First, one-sample t tests were used to assess whether percentage change relative to baseline in CT, SA, GI, HS, WT, SD, SL, and SW was significant over time (different from zero). Second, to test whether percentage change relative to baseline was invariant over the cortex, we used ANOVA with percentage change relative to baseline for each measure as the dependent variable and lobe as the factor. When necessary, post hoc tests were used to determine which lobes showed significant differences. Third, Pearson's partial correlation was performed to explore the direct associations among percentage change relative to baseline of CT, SA, HS, WT, SD, SL, and SW. These correlations calculate the correlation between each pair of variables while accounting for the effects of all remaining variables. In all analyses, p < 0.05 was considered significant after controlling for multiple comparisons using the false discovery rate (FDR) with q = 0.05 (Benjamini and Hochberg, 1995). Effect size is given as Cohen's d.
Results
Longitudinal changes in CT, SA, GI, HS, WT, SD, SL, and SW
Over the whole cortex, CT, SA, GI, HS, SD, and SL decreased over time by 1.6% (t = −5.10, p < 0.01), 1.5% (t = −7.57, p < 0.01), 1.3% (t = −8.38, p < 0.01), 0.17% (t = −0.98, p = 0.33), 0.3% (t = −1.09, p = 0.32), and 0.8% (t = −2.12, p = 0.06) relative to baseline, respectively. WT and SW increased over time by 1.6% (t = 5.79, p < 0.01) and 2.5% (t = 3.80, p < 0.01) relative to baseline, respectively.
Table 3 shows the percentage change relative to baseline for all of these measures within cortical lobes and whether this change was statistically significantly after FDR correction.
Table 3.
Percentage change relative to baseline per lobe over a 2 year period in 52 healthy adolescents (age range, 11–17 years)
| Measure | Frontal lobe |
Temporal lobe |
Parietal lobe |
Occipital lobe |
||||||||
|---|---|---|---|---|---|---|---|---|---|---|---|---|
| %a | tb | pc | % | t | p | % | t | p | % | t | p | |
| CT | −1.7 | −5 | <0.001 | −1.7 | −4.1 | <0.001 | −1.4 | −4.3 | <0.001 | −1.1 | −2.7 | 0.014 |
| SA | −1.6 | −6.9 | <0.001 | −1.3 | −4.1 | <0.001 | −1.7 | −7.1 | <0.001 | −0.7 | −2.2 | 0.043 |
| GI | −1.8 | −6.5 | <0.001 | −1.2 | −4.1 | <0.001 | −0.7 | −1.6 | 0.155 | −1 | −3.6 | 0.002 |
| HS | 0.1 | 0.5 | 0.660 | −0.1 | −0.5 | 0.660 | 1 | 2.3 | 0.035 | 0.3 | 1.1 | 0.335 |
| WT | 1.7 | 5.5 | <0.001 | 1.2 | 3.6 | 0.002 | 2 | 5.7 | <0.001 | 1.5 | 3.7 | <0.001 |
| SD | −0.9 | −3.5 | <0.002 | −0.6 | −1.4 | 0.225 | −0.2 | −0.4 | 0.712 | −1.2 | −2.9 | 0.008 |
| SL | −1.8 | −3 | 0.008 | −0.69 | −1 | 0.403 | 0.2 | 0.4 | 0.719 | −1.5 | −0.9 | 0.410 |
| SW | 3.4 | 4.7 | <0.001 | −3.2 | −3.1 | 0.006 | 2.3 | 3.1 | 0.008 | 2.2 | 2.7 | 0.013 |
a Percentage change relative to baseline defined as (follow-up − baseline)/baseline × 100.
b t value from one-sample t test with degrees of freedom = 51.
c FDR-corrected p values (q = 0.05).
Differences in longitudinal changes between lobes
ANOVAs assessed whether, for each measure, percentage change relative to baseline was different among the lobes. After FDR correction for multiple comparisons, a nearly significant trend among lobes for a relative loss in SA (F(3,204) = 3.4, p = 0.057) and HS (F(3,204) = 3.4, p = 0.057) was found. Post hoc tests corrected for multiple comparisons showed that the loss of SA was higher in the frontal (t(102) = 2.6, p = 0.03, d = 0.50) and temporal (t(102) = 2.8, p = 0.02, d = 0.56) cortices compared with occipital cortex. Loss of HS was higher in the frontal cortex (t(102) = 2.2, p = 0.04, d = 0.43) and occipital cortex (t(102) = 2.5, p = 0.02, d = 0.50) compared with the temporal cortex. However, these results should be interpreted with caution because the effect of lobe was only trend significant.
Partial correlations between longitudinal changes with each lobe
The patterns of association among longitudinal changes in lobar SD, SW, SA, WT, and CT are illustrated by the significant partial correlations for each lobe after FDR correction for multiple comparisons (Fig. 4). Notably, CT was positively related to SW and negatively to WT and CT in the occipital, temporal, and parietal lobes.
Figure 4.
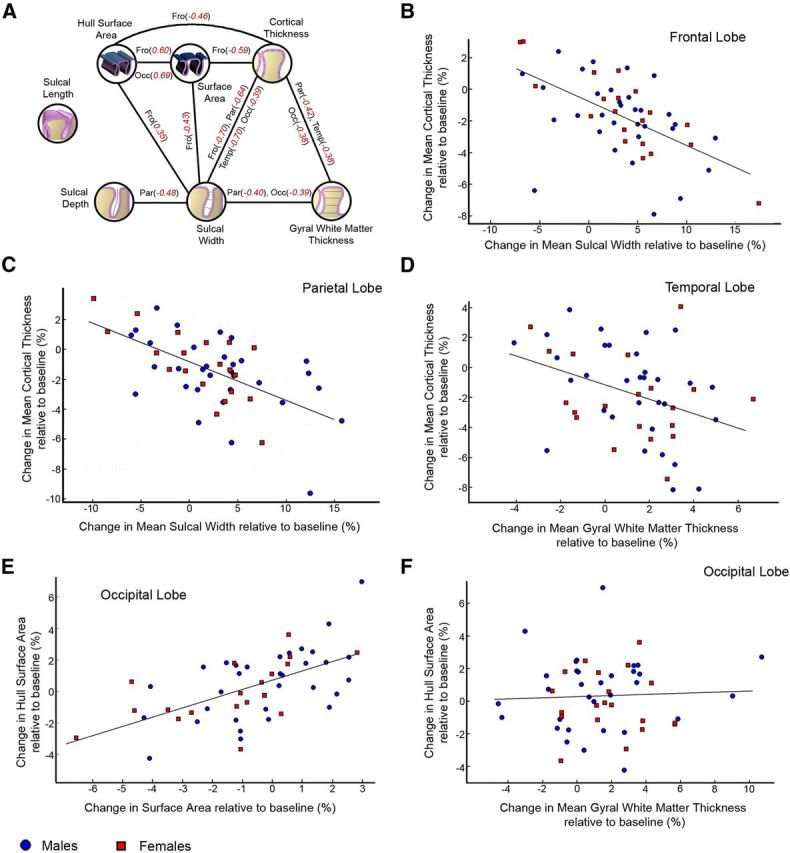
A, Pearson's partial correlations between percentages change over time relative to baseline of the cortical morphological measures. Only partial correlations that were significant (p < 0.05, two-tailed) after FDR correction (q = 0.05) are displayed. B–F, Scatter plots showing the relationship between different pairs of measures.
Discussion
The present study investigated longitudinal changes in lobar CT, SA, GI, HS, WT, SD, SL, and SW using an ∼2 year measurement interval in a sample of healthy adolescents. The results both replicate previous findings on global cortical thinning and loss of sulcal SA in males and females during adolescence (Raznahan et al., 2011) and extend previous findings in three important ways. First, by fractionating changes in global sulcal SA over time into changes in lobar SD, SL, and SW, the present study demonstrated that, in addition to global sulcal widening, a decrease in SD in the frontal and occipital cortices took place over time. Second, WT increased over time in all lobes, suggesting that previously described lobar increases in WM volume also take place in the gyri adjacent to the cortex (Lenroot et al., 2007; Tamnes et al., 2010). Third, the relationships among these events were compared directly, providing new insights into the dynamics of macrostructural change during adolescence as described below.
Previous reports in adult and elderly participants from cross-sectional studies have described a relationship between global SD decrease and SW enlargement (Magnotta et al., 1999; Im et al., 2008; Kochunov et al., 2008, 2009). Extending these studies for the first time to longitudinal adolescent brain development has revealed a direct relationship between decreased SD and SW over time that was strongest in the parietal lobe. The global widening of the sulci and decrease of depth over time constitutes a macrostructural flattening of the cortex during adolescence, most substantially in the frontal and occipital cortices (i.e., the regions in which both morphological changes were significant). The simultaneous decrease in SD and increase in SW over time is a neurodevelopmental process that can explain the loss of sulcal SA because, as a sulcus becomes flatter, its SA will also decrease. Indeed, a direct relationship between sulcal widening and loss of SA was found in the frontal cortex. The current study also shows a global, strong, and direct relationship between sulcal widening and cortical thinning as has been shown cross-sectionally (Im et al., 2008). The decrease in lobar CT over time seems to produce a double increase in lobar SW (Table 3), presumably because of the presence of cortex on both sides of each sulcus (Kochunov et al., 2008). These findings point to a mechanism in which cortical thinning is related to loss of SA via sulcal widening.
The direct negative relationship between CT and SA indicates that, after partialling out the effect of sulcal widening, individuals with the thinnest cortex have the largest SA. This has been reported previously (Seldon, 2005; Hogstrom et al., 2012). It has been proposed that a negative relationship between CT and SA is attributable to maturation of the WM, expanding and stretching the outer surface like a balloon. Consequently, the outer cortical surface has to thin out to cover the expanding SA (Seldon, 2005; Hogstrom et al., 2012).
An important question in adolescent brain development is whether cortical thinning reflects true atrophy or is an artifact attributable to the maturation of adjacent subcortical WM (Paus, 2005). Cortical thinning during adolescence may be attributable to underlying synaptic pruning, i.e., the use-dependent selective elimination of synapses (Rakic et al., 1994; Huttenlocher and Dabholkar, 1997) together with trophic glial and vascular changes and/or cell shrinkage (Morrison et al., 1997). The concurrent presence of increasing WT and cortical thinning over time in the current study is coherent with previous studies showing global WM volume increase and decrease of CT in the same age range (Lenroot et al., 2007; Shaw et al., 2008; Tamnes et al., 2010; Raznahan et al., 2011). The direct relationship between WT enlargement and cortical thinning in the parietal, temporal, and occipital cortices of individuals seen here provides compelling evidence that, during adolescence, T1-based measurements of CT in these regions are also dependent on the maturation of the WM in the adjacent gyri. During adolescence, WM volume increase probably reflects underlying changes in myelination and axon diameter (Yakovlev and Lecours, 1967; Benes et al., 1994; Paus, 2010). Because the T1 signal is highly sensitive to changes in myelination (Walters et al., 2003), continuing myelination in the neuropil and deep intracortical layers causes voxels on the WM/GM interface to be classified as WM at later ages. Their being previously categorized as GM at earlier ages would lead to an apparent age-related cortical thinning (Sowell et al., 2004; Paus, 2005; Shaw et al., 2008; Westlye et al., 2010; Geyer et al., 2011). The direct dependence between CT and WT may affect the interpretation of CT findings in subjects with ongoing WM maturation and underscores the need to evaluate CT in the context of both GM and WM development (Geyer et al., 2011; Glasser and Van Essen, 2011).
There are several limitations to this study that should be taken into account when interpreting the results. First, they are specific to the age range covered here; the relationships among these morphometric variables are likely to differ at other age ranges. Second, we used global and lobar measures across hemispheres, which precluded the analysis of more regional and lateralized effects. Third, the distributions of subject numbers and males/female ratios were not homogeneous over the age range, with fewer subjects and fewer females at the onset of adolescence. Therefore, these results might be more representative of middle and late adolescence (14–18 years of age) compared with early adolescence. Fourth, we used a multisite design, but our sample size was relatively small. Fifth, developmental trajectories of cortical morphological measures may be nonlinear, depending on the type of measure and the region. The current study had only two time points, precluding detection of nonlinear changes in morphometric variables. Future studies using these same morphometric analyses and collecting multiple measurements (>2) over time in a sample with a wider age range are needed to judge how accurately the present results reflect the trajectory of cortical brain changes from early to late adolescence.
In conclusion, we found widespread cortical thinning during adolescence to be related to sulcal widening. In addition, SD decreased in frontal and occipital lobes. The combination of increasing SW and decreasing SD implies a flattening of the cortex, which could be a mechanism producing the typical loss of cortical SA seen during adolescence.
Notes
Supplemental material for this article is available at ftp://disco.hggm.es/jjanssen/adoles_surfgmdevelop/. This material has not been peer reviewed.
Footnotes
This study is supported by the Instituto de Salud Carlos III (CIBERSAM; PI11/02877), the Spanish Ministry of Economy and Competitiveness (Ramon y Cajal Program; CENIT -Consorcios Estratégicos Nacionales en Investigación Técnica- Program, AMIT -Tecnologías de Imagen Molecular Avanzadas- Project), the Autonomous Community of Madrid (S2010/BMD-2422 AGES), the ERA-NET NEURON (Network of European Funding for Neuroscience Research), Fundación Alicia Koplowitz, Fundación Mutua Madrileña, and Caja Navarra. We thank all participants and their families.
The authors declare no competing financial interests.
References
- American Psychiatric Association. Diagnostic and statistical manual of mental disorders. Washington, DC: American Psychiatric Association; 1994. [Google Scholar]
- Benes FM, Turtle M, Khan Y, Farol P. Myelination of a key relay zone in the hippocampal formation occurs in the human brain during childhood, adolescence, and adulthood. Arch Gen Psychiatry. 1994;51:477–484. doi: 10.1001/archpsyc.1994.03950060041004. [DOI] [PubMed] [Google Scholar]
- Benjamini Y, Hochberg Y. Controlling the false discovery rate: A practical and powerful approach to multiple testing. J R Stat Soc B. 1995;57:289–300. [Google Scholar]
- Blakemore SJ. Imaging brain development: the adolescent brain. Neuroimage. 2012;61:397–406. doi: 10.1016/j.neuroimage.2011.11.080. [DOI] [PubMed] [Google Scholar]
- Brouwer RM, Mandl RC, Schnack HG, van Soelen IL, van Baal GC, Peper JS, Kahn RS, Boomsma DI, Hulshoff Pol HE. White matter development in early puberty: a longitudinal volumetric and diffusion tensor imaging twin study. PLoS One. 2012;7:e32316. doi: 10.1371/journal.pone.0032316. [DOI] [PMC free article] [PubMed] [Google Scholar]
- Brown TT, Kuperman JM, Chung Y, Erhart M, McCabe C, Hagler DJ, Jr, Venkatraman VK, Akshoomoff N, Amaral DG, Bloss CS, Casey BJ, Chang L, Ernst TM, Frazier JA, Gruen JR, Kaufmann WE, Kenet T, Kennedy DN, Murray SS, Sowell ER, Jernigan TL, Dale AM. Neuroanatomical assessment of biological maturity. Curr Biol. 2012;22:1693–1698. doi: 10.1016/j.cub.2012.07.002. [DOI] [PMC free article] [PubMed] [Google Scholar]
- Buchanan RW, Heinrichs DW. The Neurological Evaluation Scale (NES): a structured instrument for the assessment of neurological signs in schizophrenia. Psychiatry Res. 1989;27:335–350. doi: 10.1016/0165-1781(89)90148-0. [DOI] [PubMed] [Google Scholar]
- Castro-Fornieles J, Parellada M, Gonzalez-Pinto A, Moreno D, Graell M, Baeza I, Otero S, Soutullo CA, Crespo-Facorro B, Ruiz-Sancho A, Desco M, Rojas-Corrales O, Patiño A, Carrasco-Marin E, Arango C. The child and adolescent first-episode psychosis study (CAFEPS): design and baseline results. Schizophr Res. 2007;91:226–237. doi: 10.1016/j.schres.2006.12.004. [DOI] [PubMed] [Google Scholar]
- Dale AM, Fischl B, Sereno MI. Cortical surface-based analysis. I. Segmentation and surface reconstruction. Neuroimage. 1999;9:179–194. doi: 10.1006/nimg.1998.0395. [DOI] [PubMed] [Google Scholar]
- Desikan RS, Ségonne F, Fischl B, Quinn BT, Dickerson BC, Blacker D, Buckner RL, Dale AM, Maguire RP, Hyman BT, Albert MS, Killiany RJ. An automated labeling system for subdividing the human cerebral cortex on MRI scans into gyral based regions of interest. Neuroimage. 2006;31:968–980. doi: 10.1016/j.neuroimage.2006.01.021. [DOI] [PubMed] [Google Scholar]
- Fischl B, Sereno MI, Dale AM. Cortical surface-based analysis. II: Inflation, flattening, and a surface-based coordinate system. Neuroimage. 1999;9:195–207. doi: 10.1006/nimg.1998.0396. [DOI] [PubMed] [Google Scholar]
- Geyer S, Weiss M, Reimann K, Lohmann G, Turner R. Microstructural parcellation of the human cerebral cortex—from Brodmann's post-mortem map to in vivo mapping with high-field magnetic resonance imaging. Front Hum Neurosci. 2011;5:19. doi: 10.3389/fnhum.2011.00019. [DOI] [PMC free article] [PubMed] [Google Scholar]
- Giedd JN, Blumenthal J, Jeffries NO, Castellanos FX, Liu H, Zijdenbos A, Paus T, Evans AC, Rapoport JL. Brain development during childhood and adolescence: a longitudinal MRI study. Nat Neurosci. 1999;2:861–863. doi: 10.1038/13158. [DOI] [PubMed] [Google Scholar]
- Glasser MF, Van Essen DC. Mapping human cortical areas in vivo based on myelin content as revealed by T1- and T2-weighted MRI. J Neurosci. 2011;31:11597–11616. doi: 10.1523/JNEUROSCI.2180-11.2011. [DOI] [PMC free article] [PubMed] [Google Scholar]
- Gogtay N, Giedd JN, Lusk L, Hayashi KM, Greenstein D, Vaituzis AC, Nugent TF, 3rd, Herman DH, Clasen LS, Toga AW, Rapoport JL, Thompson PM. Dynamic mapping of human cortical development during childhood through early adulthood. Proc Natl Acad Sci U S A. 2004;101:8174–8179. doi: 10.1073/pnas.0402680101. [DOI] [PMC free article] [PubMed] [Google Scholar]
- Han X, Jovicich J, Salat D, van der Kouwe A, Quinn B, Czanner S, Busa E, Pacheco J, Albert M, Killiany R, Maguire P, Rosas D, Makris N, Dale A, Dickerson B, Fischl B. Reliability of MRI-derived measurements of human cerebral cortical thickness: the effects of field strength, scanner upgrade and manufacturer. Neuroimage. 2006;32:180–194. doi: 10.1016/j.neuroimage.2006.02.051. [DOI] [PubMed] [Google Scholar]
- Hogstrom LJ, Westlye LT, Walhovd KB, Fjell AM. The structure of the cerebral cortex across adult life: age-related patterns of surface area, thickness, and gyrification. Cereb Cortex. 2012 doi: 10.1093/cercor/bhs231. [DOI] [PubMed] [Google Scholar]
- Huttenlocher PR, Dabholkar AS. Regional differences in synaptogenesis in human cerebral cortex. J Comp Neurol. 1997;387:167–178. doi: 10.1002/(SICI)1096-9861(19971020)387:2<167::AID-CNE1>3.0.CO;2-Z. [DOI] [PubMed] [Google Scholar]
- Im K, Lee JM, Seo SW, Hyung Kim S, Kim SI, Na DL. Sulcal morphology changes and their relationship with cortical thickness and gyral white matter volume in mild cognitive impairment and Alzheimer's disease. Neuroimage. 2008;43:103–113. doi: 10.1016/j.neuroimage.2008.07.016. [DOI] [PubMed] [Google Scholar]
- Jouvent E, Reyes S, Mangin JF, Roca P, Perrot M, Thyreau B, Hervé D, Dichgans M, Chabriat H. Apathy is related to cortex morphology in CADASIL. A sulcal-based morphometry study. Neurology. 2011;76:1472–1477. doi: 10.1212/WNL.0b013e31821810a4. [DOI] [PubMed] [Google Scholar]
- Kaufman J, Birmaher B, Brent D, Rao U, Flynn C, Moreci P, Williamson D, Ryan N. Schedule for affective disorders and schizophrenia for school-age children-present and lifetime version (K-SADS-PL): initial reliability and validity data. J Am Acad Child Adolesc Psychiatry. 1997;36:980–988. doi: 10.1097/00004583-199707000-00021. [DOI] [PubMed] [Google Scholar]
- Kochunov P, Thompson PM, Coyle TR, Lancaster JL, Kochunov V, Royall D, Mangin JF, Rivière D, Fox PT. Relationship among neuroimaging indices of cerebral health during normal aging. Hum Brain Mapp. 2008;29:36–45. doi: 10.1002/hbm.20369. [DOI] [PMC free article] [PubMed] [Google Scholar]
- Kochunov P, Robin DA, Royall DR, Coyle T, Lancaster J, Kochunov V, Schlosser AE, Fox PT. Can structural MRI indices of cerebral integrity track cognitive trends in executive control function during normal maturation and adulthood? Hum Brain Mapp. 2009;30:2581–2594. doi: 10.1002/hbm.20689. [DOI] [PMC free article] [PubMed] [Google Scholar]
- Kochunov P, Rogers W, Mangin JF, Lancaster J. A library of cortical morphology analysis tools to study development, aging and genetics of cerebral cortex. Neuroinformatics. 2012;10:81–96. doi: 10.1007/s12021-011-9127-9. [DOI] [PMC free article] [PubMed] [Google Scholar]
- Kuperberg GR, Broome MR, McGuire PK, David AS, Eddy M, Ozawa F, Goff D, West WC, Williams SC, van der Kouwe AJ, Salat DH, Dale AM, Fischl B. Regionally localized thinning of the cerebral cortex in schizophrenia. Arch Gen Psychiatry. 2003;60:878–888. doi: 10.1001/archpsyc.60.9.878. [DOI] [PubMed] [Google Scholar]
- Lenroot RK, Gogtay N, Greenstein DK, Wells EM, Wallace GL, Clasen LS, Blumenthal JD, Lerch J, Zijdenbos AP, Evans AC, Thompson PM, Giedd JN. Sexual dimorphism of brain developmental trajectories during childhood and adolescence. Neuroimage. 2007;36:1065–1073. doi: 10.1016/j.neuroimage.2007.03.053. [DOI] [PMC free article] [PubMed] [Google Scholar]
- Liu T, Wen W, Zhu W, Kochan NA, Trollor JN, Reppermund S, Jin JS, Luo S, Brodaty H, Sachdev PS. The relationship between cortical sulcal variability and cognitive performance in the elderly. Neuroimage. 2011;56:865–873. doi: 10.1016/j.neuroimage.2011.03.015. [DOI] [PubMed] [Google Scholar]
- Magnotta VA, Andreasen NC, Schultz SK, Harris G, Cizadlo T, Heckel D, Nopoulos P, Flaum M. Quantitative in vivo measurement of gyrification in the human brain: changes associated with aging. Cereb Cortex. 1999;9:151–160. doi: 10.1093/cercor/9.2.151. [DOI] [PubMed] [Google Scholar]
- Mangin JF, Riviere D, Cachia A, Duchesnay E, Cointepas Y, Papadopoulos-Orfanos D, Scifo P, Ochiai T, Brunelle F, Regis J. A framework to study the cortical folding patterns. Neuroimage. 2004;23(Suppl 1):S129–S138. doi: 10.1016/j.neuroimage.2004.07.019. [DOI] [PubMed] [Google Scholar]
- Morrison SJ, Shah NM, Anderson DJ. Regulatory mechanisms in stem cell biology. Cell. 1997;88:287–298. doi: 10.1016/S0092-8674(00)81867-X. [DOI] [PubMed] [Google Scholar]
- Paus T. Mapping brain maturation and cognitive development during adolescence. Trends Cogn Sci. 2005;9:60–68. doi: 10.1016/j.tics.2004.12.008. [DOI] [PubMed] [Google Scholar]
- Paus T. Growth of white matter in the adolescent brain: myelin or axon? Brain Cogn. 2010;72:26–35. doi: 10.1016/j.bandc.2009.06.002. [DOI] [PubMed] [Google Scholar]
- Perrot M, Rivière D, Mangin JF. Cortical sulci recognition and spatial normalization. Med Image Anal. 2011;15:529–550. doi: 10.1016/j.media.2011.02.008. [DOI] [PubMed] [Google Scholar]
- Rakic P, Bourgeois JP, Goldman-Rakic PS. Synaptic development of the cerebral cortex: implications for learning, memory, and mental illness. Prog Brain Res. 1994;102:227–243. doi: 10.1016/S0079-6123(08)60543-9. [DOI] [PubMed] [Google Scholar]
- Raznahan A, Shaw P, Lalonde F, Stockman M, Wallace GL, Greenstein D, Clasen L, Gogtay N, Giedd JN. How does your cortex grow? J Neurosci. 2011;31:7174–7177. doi: 10.1523/JNEUROSCI.0054-11.2011. [DOI] [PMC free article] [PubMed] [Google Scholar]
- Reuter M, Fischl B. Avoiding asymmetry-induced bias in longitudinal image processing. Neuroimage. 2011;57:19–21. doi: 10.1016/j.neuroimage.2011.02.076. [DOI] [PMC free article] [PubMed] [Google Scholar]
- Reuter M, Schmansky NJ, Rosas HD, Fischl B. Within-subject template estimation for unbiased longitudinal image analysis. Neuroimage. 2012;61:1402–1418. doi: 10.1016/j.neuroimage.2012.02.084. [DOI] [PMC free article] [PubMed] [Google Scholar]
- Ringe WK, Saine KC, Lacritz LH, Hynan LS, Cullum CM. Dyadic short forms of the Wechsler Adult Intelligence Scale-III. Assessment. 2002;9:254–260. doi: 10.1177/1073191102009003004. [DOI] [PubMed] [Google Scholar]
- Rosas HD, Liu AK, Hersch S, Glessner M, Ferrante RJ, Salat DH, van der Kouwe A, Jenkins BG, Dale AM, Fischl B. Regional and progressive thinning of the cortical ribbon in Huntington's disease. Neurology. 2002;58:695–701. doi: 10.1212/WNL.58.5.695. [DOI] [PubMed] [Google Scholar]
- Satler J. Assessment of children cognitive applications. Ed 4. San Diego: State University; 2001. [Google Scholar]
- Seldon HL. Does brain white matter growth expand the cortex like a balloon? Hypothesis and consequences. Laterality. 2005;10:81–95. doi: 10.1080/13576500342000310. [DOI] [PubMed] [Google Scholar]
- Shaw P, Kabani NJ, Lerch JP, Eckstrand K, Lenroot R, Gogtay N, Greenstein D, Clasen L, Evans A, Rapoport JL, Giedd JN, Wise SP. Neurodevelopmental trajectories of the human cerebral cortex. J Neurosci. 2008;28:3586–3594. doi: 10.1523/JNEUROSCI.5309-07.2008. [DOI] [PMC free article] [PubMed] [Google Scholar]
- Sowell ER, Thompson PM, Leonard CM, Welcome SE, Kan E, Toga AW. Longitudinal mapping of cortical thickness and brain growth in normal children. J Neurosci. 2004;24:8223–8231. doi: 10.1523/JNEUROSCI.1798-04.2004. [DOI] [PMC free article] [PubMed] [Google Scholar]
- Tamnes CK, Ostby Y, Fjell AM, Westlye LT, Due-Tønnessen P, Walhovd KB. Brain maturation in adolescence and young adulthood: regional age-related changes in cortical thickness and white matter volume and microstructure. Cereb Cortex. 2010;20:534–548. doi: 10.1093/cercor/bhp118. [DOI] [PubMed] [Google Scholar]
- Tamnes CK, Walhovd KB, Dale AM, Østby Y, Grydeland H, Richardson G, Westlye LT, Roddey JC, Hagler DJ, Jr, Due-Tonnessen P, Holland D, Fjell AM. Brain development and aging: overlapping and unique patterns of change. Neuroimage. 2013;68:63–74. doi: 10.1016/j.neuroimage.2012.11.039. [DOI] [PMC free article] [PubMed] [Google Scholar]
- Van Essen DC, Drury HA. Structural and functional analyses of human cerebral cortex using a surface-based atlas. J Neurosci. 1997;17:7079–7102. doi: 10.1523/JNEUROSCI.17-18-07079.1997. [DOI] [PMC free article] [PubMed] [Google Scholar]
- van Soelen IL, Brouwer RM, van Baal GC, Schnack HG, Peper JS, Collins DL, Evans AC, Kahn RS, Boomsma DI, Hulshoff Pol HE. Genetic influences on thinning of the cerebral cortex during development. Neuroimage. 2012;59:3871–3880. doi: 10.1016/j.neuroimage.2011.11.044. [DOI] [PubMed] [Google Scholar]
- Walters NB, Egan GF, Kril JJ, Kean M, Waley P, Jenkinson M, Watson JD. In vivo identification of human cortical areas using high-resolution MRI: an approach to cerebral structure-function correlation. Proc Natl Acad Sci U S A. 2003;100:2981–2986. doi: 10.1073/pnas.0437896100. [DOI] [PMC free article] [PubMed] [Google Scholar]
- Westlye LT, Walhovd KB, Dale AM, Bjørnerud A, Due-Tønnessen P, Engvig A, Grydeland H, Tamnes CK, Østby Y, Fjell AM. Differentiating maturational and aging-related changes of the cerebral cortex by use of thickness and signal intensity. Neuroimage. 2010;52:172–185. doi: 10.1016/j.neuroimage.2010.03.056. [DOI] [PubMed] [Google Scholar]
- Yakovlev PI, Lecours AR. The myelogenetic cycles of regional maturation of the brain. In: Minkowski A, editor. Regional development of the brain in early life. Oxford: Blackwell Scientific; 1967. pp. 3–70. [Google Scholar]
- Zilles K, Armstrong E, Schleicher A, Kretschmann HJ. The human pattern of gyrification in the cerebral cortex. Anat Embryol (Berl) 1988;179:173–179. doi: 10.1007/BF00304699. [DOI] [PubMed] [Google Scholar]