

Abstract
The cerebellum is implicated in sensory prediction in the subsecond range. To explore how neurons in the cerebellum encode temporal information for the prediction of sensory events, we trained monkeys to make a saccade in response to either a single omission or deviation of isochronous repetitive stimuli. We found that neurons in the cerebellar dentate nucleus exhibited a gradual elevation of the baseline firing rate as the repetition progressed. Most neurons showed a transient suppression for each stimulus, and this firing modulation also increased gradually, opposed to the sensory adaptation. The magnitude of the enhanced sensory response positively correlated with interstimulus interval. Furthermore, when stimuli appeared unexpectedly earlier than the regular timing, the neuronal modulation became smaller, suggesting that the sensory response depended on the time elapsed since the previous stimulus. The enhancement of neuronal modulation was context dependent and was reduced or even absent when monkeys were unmotivated to detect stimulus omission. A significant negative correlation between neuronal activity at stimulus omission and saccade latency suggested that the timing of each stimulus was predicted by the amount of recovery from the transient response. Because inactivation of the recording sites delayed the detection of stimulus omission but only slightly altered the detection of stimulus deviation, these signals might be necessary for the prediction of stimulus timing but may not be involved only in the generation of saccades. Our results demonstrate a novel mechanism for temporal prediction of upcoming stimuli that accompanies the time-dependent modification of sensory gain in the cerebellum.
Introduction
Temporal processing over a short period of time is important not only for motor control but also for perception. For example, we are able to detect slight changes in musical rhythm, which requires temporal prediction of regular beat. The cerebellum is likely to play a role in such processes. Although the cerebellum is known to be essential for feedforward predictive control of movements (for review, see Wolpert et al., 1998; Bastian, 2006; Ebner et al., 2011) and temporal association of sensory events during motor learning (Kim and Thompson, 1997; Nixon and Passingham, 2001), it is also involved in temporal processing in the range of several hundreds of milliseconds even in the absence of movements (Tesche and Karhu, 2000; for review, see Lewis and Miall, 2003; Ivry and Spencer, 2004). However, the underlying neuronal mechanisms of temporal information processing in the cerebellum remain largely unknown. In particular, how individual neurons in the cerebellum represent time remains to be elucidated.
Previous studies have proposed several possible mechanisms of time representation in the brain. The most prevalent model, for which there is much empirical evidence, assumes the gradual elevation of neuronal activity toward a certain threshold (Schultz and Romo, 1992; Leon and Shadlen, 2003; Maimon and Assad, 2006; Tanaka, 2007; Merchant et al., 2011; Kunimatsu and Tanaka, 2012; for review, see Wittmann, 2013). Other models propose an entrainment of synchronous activity in the neuronal population (Sumbre et al., 2008), time-dependent changes in the sensory response (Fecteau and Munoz, 2005; Mayo and Sommer, 2008, 2013; Buonomano and Maass, 2009), or the coincidental detection of signals from multiple oscillators (Buhusi and Meck, 2005). While all of these models involve networks outside of the cerebellum, several lines of evidence suggest that the cerebellum also has the potential to represent time by adjusting spike timing of multiple neurons (Gauck and Jaeger, 2000; Llinás, 2009; Wise et al., 2010) or the time course of neuronal activity (Hoebeek et al., 2010; De Zeeuw et al., 2011; Ashmore and Sommer, 2013).
To elucidate how neurons in the cerebellum encode temporal information for the prediction of upcoming sensory events without movements, we trained monkeys to detect a single omission of isochronous repetitive stimuli, then conducted single-neuron recordings from the dentate nucleus of the cerebellum. Anatomically, the dentate nucleus receives inhibitory inputs from the Purkinje cells in the cerebellar hemispheres and excitatory inputs from mossy fibers arising from the brainstem. Dentate neurons send signals through the thalamus to the frontoparietal cortices (Strick et al., 2009). Given that both the cerebellar hemispheres and the frontoparietal cortices have been implicated in temporal processing (Merchant et al., 2013), the analysis on neuronal activity in the dentate nucleus should provide useful information to understand the specific role of the cerebellum in temporal processing. Our data show that a group of neurons in the posterior part of the dentate nucleus encode temporal prediction by altering the gain of sensory response depending on stimulus timing, and that these signals have a causal role in behaviors that require sensory prediction of stimulus timing.
Materials and Methods
Animal preparation.
Two Japanese monkeys (Macaca fuscata; one female and one male, monkeys H and I; 6.0–9.0 kg) were prepared for chronic experiments using procedures described previously (Tanaka, 2005). All experimental protocols were approved by the Hokkaido University Animal Care and Use Committee.
Briefly, in separate surgeries under general isoflurane anesthesia, a pair of plastic head holders were fixed to the skull and an eye coil was implanted under the conjunctiva. Analgesics were administered during and after each surgery. Following recovery from the surgery, monkeys were trained in the oddball detection task for at least 8 months. When the animals were well trained (i.e., able to perform the oddball task correctly in >80% of trials), a third surgery was undertaken to implant a recording cylinder for vertical electrode penetration aimed at the deep cerebellar nuclei. The location of the cylinder was verified by MRI. Antibiotics were administered during the course of the experiments as necessary.
Stimuli and behavioral tasks.
Experiments were performed in a darkened booth. Visual stimuli were presented on a 24 inch cathode ray tube monitor (refresh rate, 60 Hz) subtending 64 × 44° of visual angle. Four different visual stimuli were used. The fixation point (red) and the saccade target (gray) were 0.5° squares. Both the repetitive stimuli (white, unfilled) and the deviant oddball stimulus (red, filled) were 2° squares. Auditory stimuli (square wave tones) generated by a computer were presented through a speaker placed in the experimental booth. The behavioral task and data acquisition were controlled by the TEMPO system (Reflective Computing).
In the oddball detection task, a saccade target appeared at 16° left or right of the fixation point while monkeys maintained fixation for 1500 ms (Fig. 1A). An audiovisual stimulus (2° white unfilled square surrounding the fixation point and a 1500 Hz tone, both lasting for 35 ms) was presented repeatedly at a fixed interstimulus interval (ISI) of 100, 200, 300, 400, or 600 ms. In half of the trials, one stimulus in the series was omitted after a randomly selected 2000–4800 ms period (3000–4800 ms for trials with 600 ms ISI; “missing oddball” condition), while in the remaining trials, one stimulus was suddenly altered in both color and pitch (2° red-filled square and 667 Hz tone; “deviant oddball” condition). In both conditions, monkeys were required to make a saccade to the visible target in response to the oddball within 800 ms. In the missing oddball condition, monkeys had to predict the timing of every upcoming stimulus to detect the absence of a regular stimulus. In contrast, in the deviant oddball condition, no temporal information was needed to detect the changes in stimulus attributes. Correct performance was reinforced by a liquid reward in each trial.
Figure 1.
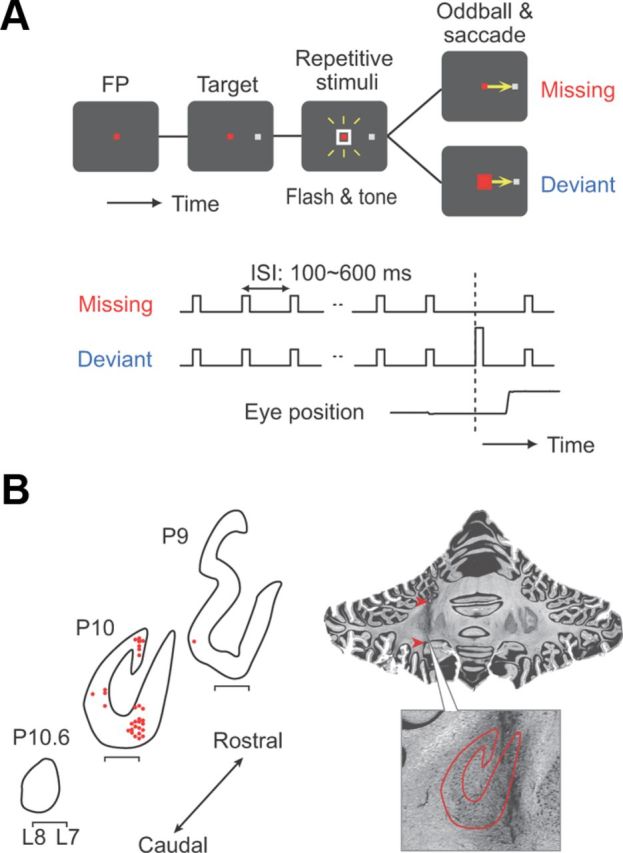
A, Sequence of events in the oddball detection task. A saccade target appeared during fixation. A white square around the fixation point (FP) and a 1500 Hz tone were repeatedly presented at a fixed interval. Among the regular repetitions, one stimulus was omitted (missing oddball condition) or changed its color and tone (red square and 667 Hz; deviant oddball condition). Monkeys were required to make a saccade to the target in response to the omission or deviation. B, Recording sites on coronal sections for monkey I. Horizontal locations are slightly jittered for presentation (red dots). The bracket below each section indicates the stereotaxic location L7–L8. Arrowheads on the photomicrograph indicate marking lesions. The higher-magnification view shows the outline of the dentate nucleus, which is used to indicate the locations of recording sites at P10.
To explore the stimulus conditions modulating the neuronal responses, two additional versions of the task were presented during recording sessions. In the “early stimulus” trials, the stimulus immediately preceding the oddball appeared 200 ms earlier than the regular ISI of 600 ms. In the “nontarget” trials, the saccade target was omitted, and monkeys were required to maintain fixation throughout the trial. These trials were randomly presented with the regular oddball trials described above.
The saccade target location, ISI length, and oddball condition (missing or deviant) were chosen randomly for each trial. The repetitive stimuli were terminated when eye position deviated >3° from the fixation point. During experiments, a targeting saccade was detected when eye position was within 3° from the target for >100 ms.
Physiological procedures and pharmacological inactivation.
Single-neuron recordings were undertaken in three dentate nuclei of two monkeys. Tungsten microelectrodes (∼1.0 MΩ at 1 kHz) were lowered though a 23 gauge stainless steel tube guided by a grid system (Crist Instrument Co.). The electrodes were advanced using a micromanipulator (MO-97S, Narishige) attached to the recording cylinder. Signals obtained from the electrodes were amplified, filtered, and monitored online using oscilloscopes and an audio device. Once a task-related neuron was encountered, action potentials were isolated using software with real-time template-matching algorithms (MSD, Alpha Omega Engineering). The occurrence of each action potential was saved as a time stamp together with the eye movement and visual stimuli data during experiments.
During each penetration, we could relatively easily identify the dorsal surface of the cerebellar nucleus, by the existence of white matter following the cerebellar cortex that contained very active neurons and some complex spikes. Neurons in the dentate nucleus were also typically active, exhibiting baseline activity of several tens of spikes per second, and lacked complex spikes. Their action potentials were relatively narrow and similar in shape between neurons, but were easily isolated because of their high-voltage modulation. Task-related neurons were clustered and were found in the caudal-most part of the dentate nucleus (Fig. 1B). During the same penetrations, we sometimes found neurons responding to licking movements. The best stereotaxic coordinates of electrode penetrations were centered at P9R9 and P10L6 for monkey H and P10L7 for monkey I. In total, we examined the activity of 109 task-related neurons (n = 76 from monkey H; n = 33 from monkey I).
After the recording experiments terminated, we locally inactivated the recording sites in two hemispheres of both monkeys. A small amount of GABAA agonist (muscimol, 5.0 μg/μl dissolved in saline, volume 1.0–2.0 μl) was injected through a 30 gauge injection needle (Crist Instrument Co.) connected to a 10 μl Hamilton microsyringe. The effects of inactivation were assessed by comparing saccade latency before and ≥15 min after the injection. As a control, we also examined the effects of saline injections into the recording sites.
Data acquisition and analysis.
Eye position signals were obtained directly from the eye coil device (MEL-25, Enzanshi Kogyo). The data were digitized, sampled at 1 kHz, and saved for further off-line analyses using Matlab (Mathworks).
Analyses of neuronal activity were based on the measurements of spike density, except for the baseline activity and the firing rates in Figures 4, 5C,D, and 8B. Spike density was obtained by convolving the millisecond-by-millisecond mean firing rates across multiple trials with Gaussians (σ = 30 ms). For each neuron, the magnitude of response to each of the repetitive stimuli was measured as the peak-to-peak difference in spike density during the subsequent ISI. For Figure 8B, the data were obtained from 71 neurons that exhibited an inhibitory response to each of the repetitive stimuli and were tested for eight or more trials for each condition (57 neurons for 100 ms ISI). In practice, the stimulus immediately preceding the oddball was the last stimulus in the sequence because monkeys usually made a saccade before the next stimulus, at least for longer ISIs.
Figure 4.

Comparison of the range of neuronal modulation and baseline activity. A, Minimal and maximal firing rates in the ISI immediately before the oddball in trials with 400 ms ISIs are shown as a line for each neuron. The baseline activity (500 ms before the first stimulus) is denoted by a dot. Data are sorted according to the baseline activity for 86 neurons with decreased activity following each stimulus (left) and 23 neurons with increased activity following each stimulus (right). The neurons shown in Figures 2A and 7A are indicated by an arrow and arrowhead, respectively. B, Firing modulation normalized to the baseline activity. Data are sorted according to the maximal activity. Note that many neurons exhibited firing rates less than the baseline. C, Scatter plot comparing the firing modulation and baseline activity for individual neurons. Two outliers were omitted ([70, 156], [155, 141]). D, Comparison between the magnitude of firing modulation and activity at the stimulus onset. The solid line indicates the regression line for the data in trials with 400 ms ISIs, while the dashed lines indicate those for trials with 300 and 600 ms ISIs. One outlier has been omitted ([210, 156]).
Figure 5.
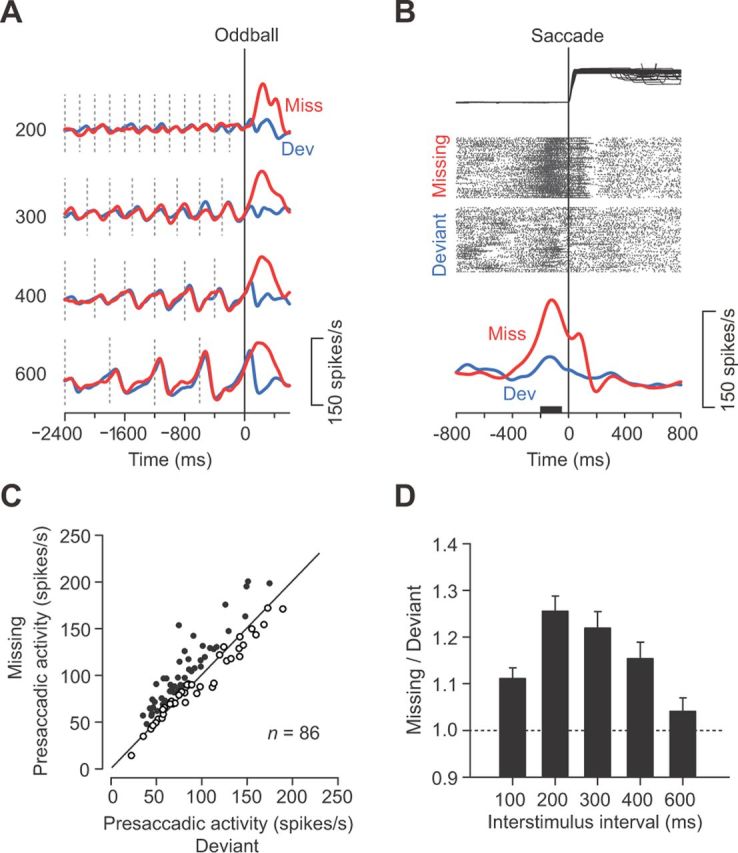
Enhanced activity for the missing oddball. A, Traces of spike density for a representative neuron in trials with different ISIs. Red and blue traces show the data for the missing and deviant conditions, respectively. Vertical dashed lines indicate stimulus timing. Note that this neuron exhibited a greater response to the missing than the deviant oddball. B, Data in A are realigned according to the initiation of saccades. Although eye position traces are shown only for ipsiversive saccades, the neuronal data are combined for saccades in both directions. C, Comparison of presaccadic activity for individual neurons. The firing rate was measured for a 150 ms interval starting from 200 ms before saccade initiation (black bar in B). Approximately 55% of neurons (47 of 86 neurons) with a suppressive response to each stimulus showed greater activity for the missing than the deviant oddball trials (filled symbols; unpaired t test, p < 0.05). D, Means and 95% confidence intervals of the ratio of presaccadic activity (missing divided by deviant) for different ISIs. All but the left bar represent data for 86 neurons (n = 66 for 100 ms ISIs).
Figure 8.

Correlation between neuronal activity just before the oddball and saccade latency. A, Time courses of population activity for ipsiversive missing oddball trials (top), contraversive missing oddball trials (middle), and ipsiversive deviant oddball trials (bottom) with 600 ms ISIs. For each neuron and condition, the data were divided into four groups according to saccade latencies. The population activity was computed for each of the four groups. Crosses above the traces indicate mean saccade latency for each group. B, Medians of the correlation coefficients computed between neuronal activity 100 ms before the oddball (black bar in A) and saccade latency in individual trials. The three data points without connecting lines indicate data for trials with only visual stimuli. Filled symbols indicate data showing a significant difference from zero (Wilcoxon signed-rank test, p < 0.05). The inset histograms indicate the sample distributions of the correlation coefficients. The arrowhead and number on each histogram indicate the median value. Note that the negative correlation was greatest for ipsiversive saccades in the missing oddball condition and was greater for longer ISIs.
When the magnitude of response to each of the earlier stimuli in the sequence was measured (see Fig. 3C), we initially computed a scaling factor for a given ISI by fitting the spike density function during the last ISI with the least-squares method. The peak-to-peak difference in spike density during the last ISI was then multiplied by the scaling factor. This procedure enabled us to reliably measure the magnitude of weak sensory responses to the earlier stimuli. When we measured saccade latency and neuronal activity before saccades, only indicative saccades toward the target were considered. Neurons were divided into two subpopulations according to the direction of firing modulation 250 ms after the last stimulus. The majority of neurons (78%, 86 of 109) exhibited decreased activity in response to the stimulus, while the others showed increased activity. The latter population was analyzed separately.
Figure 3.

Linear relationship between sensory gain and ISI. A, Time courses of firing rate for different ISIs for the neuron shown in Figure 2A. The number on each trace indicates ISI. Stimulus timing is denoted by a dot. B, Population activity for 86 neurons that showed a reduced firing rate for each stimulus. Continuous traces are aligned with the stimulus immediately before the oddball (denoted as the last stimulus). For each neuron, the baseline activity immediately before the first stimulus was subtracted. Dotted traces indicate the data during the 100 ms interval following the oddball (i.e., when a missing stimulus should have occurred or a deviant stimulus did occur). C, The magnitude of firing modulation during each ISI as a function of time after the first stimulus for the neuron in A. The right-hand column indicates the data for the stimulus just before the oddball. D, Mean and 95% confidence intervals of the magnitude of the response to the first (black) and the last (red) stimulus for different ISIs. The data connected with solid lines indicate 86 neurons with a transient decrease in activity, while those connected with broken lines indicate 23 neurons with a transient increase in activity for each stimulus. stim, Stimulus.
Histological procedures.
Following the cessation of experiments in monkey I, several electrolytic lesions were made by passing a direct current through the recording electrodes. The animal was killed, and the brain was removed, fixed, and equilibrated with 30% sucrose. Histological sections (100 μm, coronal) were cut and stained with cresyl violet. The other monkey is still in use for other projects.
Results
Temporally specific gain modulation for repetitive stimuli
We examined single-neuron activities in the dentate nucleus of the cerebellum in two monkeys performing the oddball detection tasks. For both monkeys, task-related neurons were found at the posterior edge of the dentate nucleus. Figure 1B plots the recording sites in one monkey, showing that the coordinate of electrode penetrations was the posterior-most of the nucleus, as we used a 1 mm grid system.
Figure 2A shows the activity of a representative neuron in trials with an ISI of 400 ms. This neuron exhibited virtually no response to each of the initial few stimuli (Fig. 2A, left, vertical lines), but began to exhibit a strong firing modulation as the repetition progressed (Fig. 2A, right). Because the monkey was not informed of the oddball condition in advance, the time course of neuronal activity before the occurrence of the oddball was essentially the same between the missing (red trace) and deviant (blue trace) conditions. In contrast, the activity following the occurrence of the oddball differed between conditions, which will be analyzed later. The majority of neurons (86 of 109 neurons, 79%) behaved similarly to this example, exhibiting a transient decrement of activity for each of the repetitive stimuli immediately followed by elevated activity. The remaining neurons (n = 23) modulated their activity in the opposite direction, showing an initial excitation followed by a later suppression, similar to the example shown in Figure 2B. The baseline firing rate (500 ms before the first stimulus) was not significantly different between the decrease-type and the increase-type neurons (67 ± 27 vs 75 ± 29 spikes/s, respectively; unpaired t test, p = 0.20).
Figure 2.
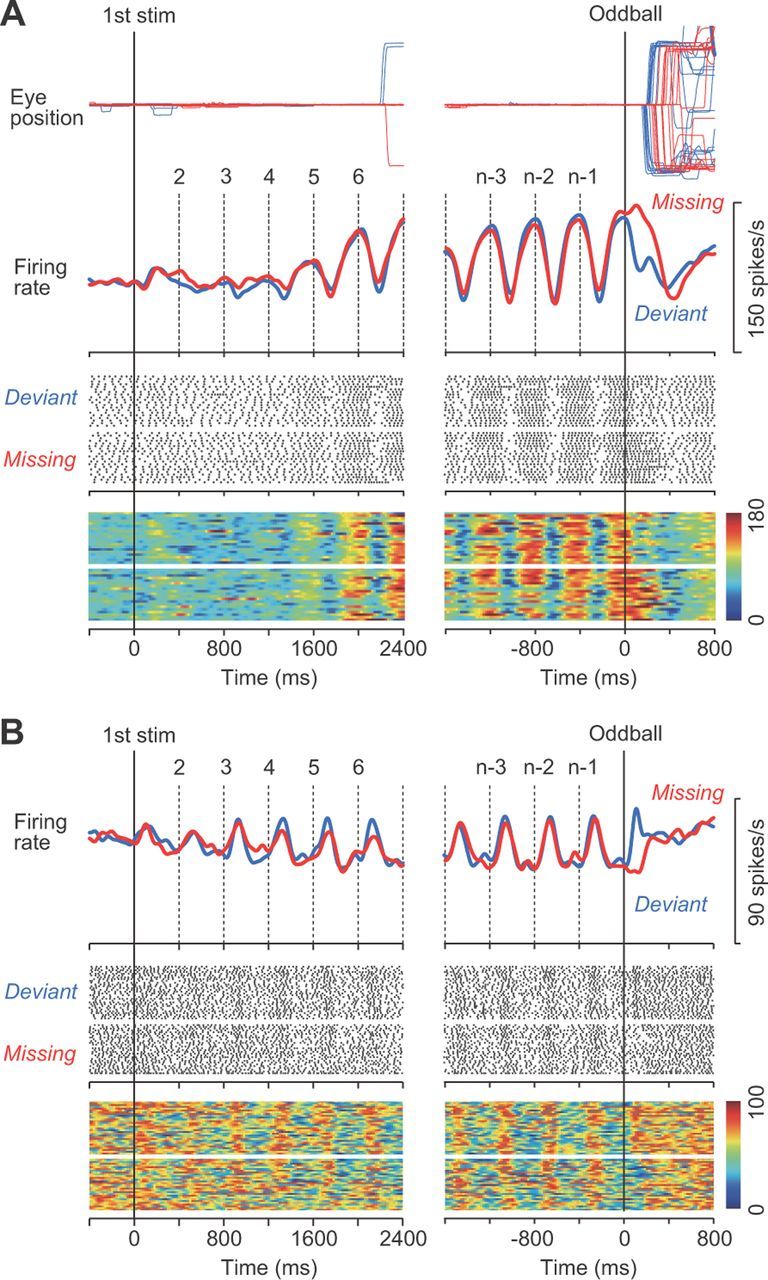
A, Data from a representative neuron aligned with either the first stimulus (left) or the oddball (right). Traces of eye position and spike density for different conditions are shown in different colors. Vertical dashed lines indicate stimulus timing. For presentation purposes only, the dots on the raster display are shown only for the timing of the first of five consecutive spikes. The bottom heat maps indicate spike density computed for individual trials to show the consistency of firing modulation across trials. B, Another example exhibiting an increase of firing rate for each stimulus. For this neuron, the rasters indicate the timing of the first of three consecutive spikes. stim, Stimulus.
Although monkeys were trained in trials with both visual and auditory stimuli, they mostly relied on visual information to perform the task. Even when the auditory tone was removed from the trials with a 400 ms ISI, both monkeys correctly detected the occurrence of oddballs in >80% of trials. Consistent with this, only 6% of individual neurons (6 of 109 neurons) exhibited differential activity between trials with and without auditory stimuli, and in the population as a whole the visual stimulus contributed to ∼89% of the response to the audiovisual stimuli. In addition, the direction of saccade target presented during the repetitive stimulus did not affect the magnitude of the response to each stimulus (43 ± 30 vs 41 ± 30 spikes/s; paired t test, p > 0.05; regression slope = 0.99; n = 109). Therefore, in the subsequent analyses, we combined the neuronal data for ipsiversive and contraversive saccades unless otherwise noted.
The magnitude of neuronal modulation for each stimulus strongly depended on the ISI. Figure 3A plots the time courses of neuronal activity for different ISIs for the same neuron shown in Figure 2A (missing and deviant trials pooled), which exhibited greater firing modulation at longer ISIs. When the magnitude of firing modulation measured at each ISI was plotted as a function of time (Fig. 3C), the response magnitude for longer ISIs gradually increased and reached a plateau within a few seconds. To compare the time courses of the response to each stimulus, Figure 3B plots the population activity aligned with the stimulus immediately before the oddball (i.e., the missing or deviant stimulus) for 86 neurons exhibiting a transient inhibitory response. For comparison, the data for each neuron were subtracted from the baseline activity (500 ms before the first stimulus in the sequence) before computing the population activity. For all but the shortest ISI, the initial decrement of activity started as early as 100 ms after the stimulus presentation, reaching the minimal value at ∼200 ms, and then the neuronal activity returned to near the original level at the time of the oddball. Figure 3D summarizes the magnitude of the response to the first and last stimuli in the sequences with different ISIs. While the response to the first stimulus did not differ greatly across ISIs (black circles), there was a linear relationship between the response magnitude and the ISIs after many repeats of the stimulus (red circles). A similar result was obtained in the remaining 23 neurons, which exhibited increased activity for each stimulus (Fig. 3D, data connected with broken lines). Thus, neurons in the dentate nucleus altered the response gain, depending on the ISI.
Many dentate neurons exhibited a gradual elevation of activity at the time of stimulus presentation, similar to the example shown in Figure 3A. Figure 4A plots the individual neuronal firing rates during the ISI immediately before the oddball (vertical lines) and the baseline activity just before the first stimulus (black dots). The lack of suppressive response to the earlier stimuli in the sequence could not be attributed solely to the lower limitation of firing rate at the baseline; most neurons showed a deep firing modulation well below the baseline after the stimulus repetition (Fig. 4B). This can also be observed in the time courses of the population activity for trials with longer ISIs (Fig. 3B). While the firing modulation only weakly correlated with baseline activity (Fig. 4C; Pearson's r = 0.33), the firing modulation was greater in neurons showing an elevated activity at the time of the stimulus onset (Fig. 4D; r = 0.69, 0.79, and 0.85 for ISIs of 300, 400, and 600 ms, respectively; p < 0.001), suggesting that the enhancement of the inhibitory response to each stimulus might be attributed partly to the elevation of activity.
For a subset of neurons, the excessive recovery from the inhibitory response resulted in a clear transient excitation following the missing oddball, during which the cessations of the stimulus were expected to release the repetitive suppression and elicit a rebound activity (Fig. 5A,B). Comparing the firing rates just before saccades in the oddball conditions, we found that approximately half of neurons exhibited greater activity in the missing than the deviant conditions (55%; unpaired t test, p < 0.05; Fig. 5C). The magnitude of presaccadic activity in the missing condition relative to that in the deviant condition tended to be greater for shorter ISIs and was greatest for a 200 ms ISI (Fig. 5D).
Stimulus conditions modulating the sensory gain
As described above, the magnitude of neuronal modulation for each audiovisual stimulus linearly correlated with the ISI (Fig. 3D). We next explored whether other stimulus conditions could alter the gain of the transient response. First, we tested whether the magnitude of the response to a given stimulus depended on the time from the latest stimulus or the baseline frequency of earlier repetitive stimuli. When the stimulus was presented 200 ms earlier than the regular ISI of 600 ms (early stimulus trials), the response magnitude became smaller (Fig. 6A, red arrows). The data from multiple neurons from both monkeys indicated that the magnitude of firing modulation for the unexpectedly early stimulus was comparable to that in the regular trials with 400 ms ISI (Fig. 6B). These results indicate that the transient inhibitory response to each stimulus was largely determined by the latest ISI, namely, by the time from the preceding stimulus.
Figure 6.

Neuronal response to an unexpectedly early stimulus. A, Time courses of neuronal activity for a representative neuron in regular trials with a 400 ms (top) or 600 ms (middle) ISI, and in trials containing an early stimulus (bottom). Trials with an early stimulus were randomly interleaved with regular trials. The early stimulus was presented 400 ms after the preceding stimulus and was positioned just before the deviant oddball in trials with a 600 ms ISI. Filled and open blue circles denote the timing of repetitive and oddball stimuli, respectively. Note that the response to the early stimulus (indicated by red arrows) was smaller than that to the preceding stimulus, but was comparable to the response in regular trials with a 400 ms ISI (black arrows on the top trace). B, Relationship between the firing modulation and ISI for trials with constant ISIs (black symbols) and with an early stimulus (red symbols). The error bars indicate 95% confidence intervals. For both monkeys, the magnitude of the response to the early stimulus was not different from that in the regular 400 ms ISI trials (unpaired t test, p > 0.05). We obtained a similar result when the measurement interval was limited to within 300 ms (100 or 200 ms for the two shortest ISIs) of the stimulus onset (dashed lines).
Second, we examined whether the gain enhancement of sensory response depends on the task requirement of temporal prediction. In our behavioral paradigm, monkeys needed to predict the timing of the next stimulus for the detection of stimulus omission and to prepare for saccades. This task requirement may be responsible for the gradual increase in neuronal modulation described above. However, it is also possible that the changes in neuronal activity could be observed even when monkeys passively viewed the repetitive stimuli without any effort to predict stimulus timing or to prepare for movements. To determine whether this is the case, we compared neuronal activity between trials with and without saccade targets (Fig. 7). In the nontarget trials, the target never appeared, and monkeys were only required to maintain fixation even after the occurrence of the missing oddball. These trials were interleaved randomly with the regular missing oddball trials. Compared with the regular trials, both the representative neuron (Fig. 7A) and the population of 37 neurons with decreased activity for each stimulus (Fig. 7B) displayed much weaker firing modulation in the nontarget trials. Furthermore, during the course of these experiments, the relative magnitude of neuronal activity in the nontarget trials became significantly smaller day after day for both animals (Fig. 7C; r < −0.4, p < 0.05). This is probably because the monkeys experienced the nontarget trials for the first time during the early recording sessions, and then they gradually became less motivated both to predict stimulus timing and to detect the missing oddball. These results support the hypothesis that the enhancement of transient response to each stimulus in sequence is a highly active process under top-down control.
Figure 7.

Attenuated response in the nontarget condition. A, Traces of eye position and neuronal activity for trials with (black) or without (red) the saccade target. Note that the monkey maintained fixation throughout the nontarget trial (top). B, Time courses of population activity for 37 neurons that showed decreased activity for each stimulus. C, Relative magnitude of firing modulation in nontarget trials as a function of the session number. In addition to the 37 neurons shown in B, the data from 11 neurons exhibiting increased activity for each stimulus are also included. Different colors indicate different animals.
Causal role of neuronal activity in the detection of stimulus omission
To assess the causal role of signals in the dentate nucleus, we first examined the relationship between neuronal activity and saccade latency. When the data for individual neurons were divided into four groups according to saccade latencies, the recovery from the inhibitory response in the population activity tended to be earlier for trials with shorter latency, especially for ipsiversive saccades generated in response to stimulus omission (Fig. 8A). For individual neurons, the correlations between firing rates 100 ms before the oddball and saccade latencies were greatest for ipsiversive saccades in the missing condition with longer ISIs (Fig. 8B). These results suggest that the time course of the recovery from the transient response may contribute to both the prediction of stimulus timing and the detection of the missing oddball.
We next examined the effects of inactivation. In all but 1 of 13 experiments, the rate of erroneous trials was not altered during inactivation with muscimol (χ2 test with Bonferroni correction, p > 0.05). However, we found significant effects on saccade latency. During inactivation, the initiation of ipsiversive saccades was markedly delayed in the missing oddball condition, and to a lesser extent in the deviant oddball condition (Fig. 9A,B). Figure 9C summarizes the changes in median latencies of ipsiversive saccades in two monkeys. For the missing oddball condition, a two-way ANOVA revealed significant differences in the main effects (inactivation, F(1,96) = 38, p < 0.001; ISI, F(3,96) = 106, p < 0.001) and the interaction between them (F(3,96) = 8, p < 0.001). For the deviant condition, both main effects were relatively smaller but also significantly different (inactivation, F(1,96) = 17, p < 0.001; ISI, F(3,96) = 12, p < 0.001; interaction; F(3,96) = 1, p = 0.46). When we performed a two-way ANOVA for the changes in median latency, we again found significant main and interaction effects (oddball condition, F(1,96) = 24, p < 0.001; ISI, F(3,96) = 17, p < 0.001; interaction, F(3,96) = 9, p < 0.001). A post hoc paired comparison showed that the changes in saccade latency were different between oddball conditions only for longer ISIs (400 and 600 ms; Bonferroni t test, p < 0.05).
Figure 9.

Causal role of neuronal activity in the dentate nucleus in the detection of a missing oddball. A, Eye position traces before (Pre) and after (Post) muscimol injection. Median latencies are indicated by triangles. B, Medians and interquartile ranges of ipsiversive saccade latencies for different ISIs before (open symbols) and after (filled symbols) injection for the data shown in A. C, Means and 95% confidence intervals of the changes in median latencies for multiple inactivation sites.
We also found a similar but weaker effect of inactivation on the latency of contraversive saccades. For the missing oddball condition, a two-way ANOVA revealed significant differences in the main effects (inactivation, F(1,96) = 22, p < 0.001; ISI, F(3,96) = 109, p < 0.001) and the interaction between them (F(3,96) = 4, p < 0.01). For the deviant condition, the main effects were again significantly different (inactivation, F(1,96) = 19, p < 0.001; ISI, F(3,96) = 13, p < 0.001), but there was no interaction (F(3,96) = 0.6, p = 0.62). In contrast, injection of saline into two recording sites did not alter saccade latencies (unpaired t test, p > 0.1).
The results from both the recording and inactivation experiments suggest that the temporally specific signals in the dentate nucleus might contribute to the prediction of stimulus timing. If this were the case, the timing of the stimuli occurring later in the sequence would be predicted more precisely, because the magnitude of sensory gain would increase gradually as the repetition progressed (Fig. 3C). Indeed, the proportion of error trials decreased as the stimulus omission occurred later, while the animals detected the deviant oddball almost perfectly regardless of where in the sequence it occurred (Fig. 10A). In addition, the latency of saccades tended to be longer for earlier oddballs in both conditions (Fig. 10B), suggesting that the weak neuronal modulation in the dentate nucleus might result in the delay of saccades.
Figure 10.

Behavioral data for the oddball detection task during recording sessions (n = 109). A, Mean and 95% confidence intervals of the rate of detection error are plotted as a function of the time of the oddball from the first stimulus. Data from different oddball conditions (deviant and missing) are shown separately. Note that detection errors were more frequently observed with earlier occurring missing oddballs. B, Mean and 95% confidence intervals of saccade latency as a function of the time of oddball occurrence. For all panels, different colors indicate different ISIs.
Discussion
This study presents new evidence regarding how time might be represented in the cerebellum. When monkeys attempted to detect a single change of isochronous repetitive stimuli, neurons in the dentate nucleus gradually increased the transient response to each stimulus as repetition progressed. Although the elevated neuronal activity at the time of stimulus presentation positively correlated with the magnitude of the transient response (Fig. 4D), both the time courses of population activity (Fig. 3B) and the range of firing modulation in individual neurons (Fig. 4A) indicated that the enhanced sensory response was not simply due to floor effects at the baseline. After many repeats, the gain of sensory response positively correlated with ISIs in the range from 100 to 600 ms, but was independent of the direction of planned saccades. For many neurons, omitted stimuli yielded larger firing rate changes than accurately timed but feature-deviant stimuli (Fig. 5). Because the response to an unexpectedly earlier stimulus in the series was reduced (Fig. 6), we concluded that the response gain reflected the time from the most recent stimulus, rather than the baseline frequency of earlier repetitive stimuli.
Possible mechanisms underlying the production of temporally specific signals
Several neural mechanisms in the cerebellum could be responsible for the generation of the temporally specific signals found in this study. Most likely, the signals may be generated through the modifiable synapses within the cerebellar cortex. It is well documented that plasticity at parallel fiber–Purkinje cell synapses plays a crucial role in short-term cerebellar adaptation (Ito, 2002; Boyden et al., 2004), and recent simulations of eye blink conditioning incorporating variable gain elements in the cerebellum successfully produced timing-specific signals (Medina and Mauk, 2000; Mauk and Buonomano, 2004). Other studies have demonstrated that gain of transmission at the granule cell synapse can be dynamically modified by inputs from inhibitory interneurons (Chadderton et al., 2004; Rothman et al., 2009). Furthermore, synchronous activity in Purkinje cells, which may strongly impact on the target neurons, has also been reported (Gauck and Jaeger, 2000; Wise et al., 2010). It seems plausible that the temporally specific signals generated within the cerebellar cortex may modulate the firing rate and/or synchrony of simple spikes in individual Purkinje cells, resulting in the suppressive response proportional to the ISI found in dentate neurons in this study. Interestingly, the cerebellum-like structure present in fish and rodents can also generate temporally specific pause–rebound activity through learning, the time course of which is similar to that observed in the neurons in this study (for review, see Bell et al., 2008).
Alternatively, it is also possible that the signals from the cerebral cortex to the cerebellum via the pontine nuclei and the mossy fibers might already have properties similar to those of neurons in the dentate nucleus found in this study. Because the gain enhancement occurred only when the animals were motivated to detect stimulus omission (Fig. 7), the mechanism responsible for the gain enhancement must be partly regulated by top-down signals emerging from the cerebral cortex. A previous study also showed context-dependent modification of sensory gain in the dentate nucleus during preparation of limb movements (Strick, 1983). In our study, the sensory gain might be modulated by top-down signals related to the preparation of saccades in both directions and/or the intention of the animals to detect stimulus omission. The origin of sensory gain enhancement could be clarified by exploring signals in the cerebellar cortex and pontine nuclei during the oddball paradigms in future studies.
Causal role of the dentate signals in the detection of stimulus omission
The temporally specific signals in the dentate nucleus played a causal role in the detection of stimulus omission. We found that inactivation of the recording sites delayed saccades in both oddball conditions. These results were consistent with the general lengthening of reaction time following inactivation of the deep cerebellar nuclei reported previously (Trouche and Beaubaton, 1980; Tsujimoto et al., 1993). Furthermore, we also found that the inactivation effects were greater in the missing than the deviant conditions, especially in trials with longer ISIs (Fig. 9), indicating that the overall delay of sensorimotor processing following inactivation may not solely explain the present results. Instead, the different effects between oddball conditions suggest that inactivation might also delay the detection of stimulus omission, but not the detection of stimulus deviation. In relation to this, delay of the signals in the cerebral cortex associated with detecting the temporal oddball has been reported in subjects with cerebellar degeneration (Moberget et al., 2008). The slight lengthening of saccade latency in the deviant condition could also be attributed to the loss of prediction signals that may facilitate oddball detection through the mechanisms of temporally specific attentional allocation (Ghose and Maunsell, 2002; Janssen and Shadlen, 2005; Ohmae et al., 2008). In contrast, inactivation of the recording sites did not alter the rate of erroneous trials in any condition, likely because inactivation was unilateral and only a fraction of dentate neurons would be affected following injection of a small amount of muscimol. The reduced signals from the dentate nuclei might delay (but not eliminate) the prediction of stimulus timing, resulting in delay of the detection of stimulus omission.
The effects of inactivation were found for saccades in both directions, but showed a strong preference for ipsiversive saccades. These results are likely attributed to the fact that neurons in the dentate nucleus send signals mostly to the contralateral cerebral cortex (Hoover and Strick, 1999), which in turn controls ipsiversive saccades. In contrast, neuronal response to the repetitive stimuli presented around the fixation point was similar between trials with different saccade directions, suggesting that neurons in the dentate nucleus might represent sensory prediction, rather than the preparation for specific eye movements.
Consistent with greater neuronal modulation for longer ISIs, the effects of inactivation were much more prominent for longer ISIs. Because monkeys generated saccades before the stimulus immediately following the missing oddball in trials with longer ISIs (i.e., saccade latency was shorter than ISI; Fig. 10B), they directly detected the absence of regular stimulus and therefore used the temporal prediction signals. Since the amount of recovery from the transient response correlated with saccade latency in ipsiversive missing oddball trials (Fig. 8B), the time course of neuronal activity returning to the initial level might reflect the prediction of stimulus timing.
Possible mechanisms underlying the detection of stimulus omission
When the ISI was <300 ms, the firing modulation was weak (Fig. 3D) and the effects of inactivation were only slight (Fig. 8C), indicating that the cerebellum played only a limited role in detection of the missing oddball. Because detection of the missing oddball was easier for shorter ISIs, the inactivation of the dentate nucleus in the present study might have been insufficient to induce detectable changes in saccade latency for trials with shorter ISIs. Alternatively, for shorter ISIs, neural mechanisms other than temporal prediction might be responsible for the detection of stimulus omission. As an example, sensory adaptation could play a role (Mayo and Sommer, 2008, 2013); the stimulus omission could reduce the sensory adaptation to repetitive stimuli, and the sensory response to the following stimulus might be recovered, which could be detected as the code for stimulus absence. Indeed, a previous study demonstrated that the omission-related scalp potential was only observed in the missing oddball paradigm with high-frequency repetitive stimuli (Yabe et al., 1997). Our hypothesis of dual mechanisms for the detection of the missing stimulus might explain the conflicting results in previous studies showing that the cerebellum plays only a minor role in the perception of repetitive event timing when tested with a short (300 ms) ISI (Grube et al., 2010).
How can the temporally specific prediction signals in the cerebellum be used to detect stimulus omission? We found that the magnitude of transient response depended on the ISI, and that neuronal activity returned to the initial value around the time of the next stimulus. However, a simple accumulator model with a fixed threshold for the detection of stimulus omission could not fully account for the data, because the firing rates at the time of each stimulus differed between ISIs, and those just after the missing oddball did not increase significantly to signal stimulus absence (Fig. 3B), making it difficult to assume a single threshold. One possible solution might be to integrate signals from the cerebellum over time within the thalamocortical networks (Krause et al., 2010) so as to generate neuronal activity that gradually ramps up toward a fixed threshold, with different time courses depending on the magnitude of suppressive response to each stimulus. Future experiments in the thalamus and the cortex will provide critical tests for this hypothesis.
Footnotes
This work was supported by grants from the Ministry of Education, Culture, Sports, Science and Technology of Japan; the Ministry of Health, Labour and Welfare of Japan; the Precursory Research for Embryonic Science and Technology, Japan Science and Technology Agency; the Takeda Foundation; the Uehara Memorial Foundation; the Smoking Research Foundation; the Brain Science Foundation. S.O. was supported by a Postdoctoral Research Fellowship from the Japan Society for the Promotion of Science. Animals were provided by the National Bio-Resource Project. We thank S. Lisberger for his comments on an early draft of the manuscript. We are grateful to T. Shiraishi and M. Kanashima for the animal care and training; J. Kunimatsu, A. Matsushima, and A. Habtemariam for histological procedures; K. Ohmae for editing illustrations; and M. Suzuki for administrative help.
The authors declare no competing financial interests.
References
- Ashmore RC, Sommer MA. Delay activity of saccade-related neurons in the caudal dentate nucleus of the macaque cerebellum. J Neurophysiol. 2013;109:2129–2144. doi: 10.1152/jn.00906.2011. [DOI] [PMC free article] [PubMed] [Google Scholar]
- Bastian AJ. Learning to predict the future: the cerebellum adapts feedforward movement control. Curr Opin Neurobiol. 2006;16:645–649. doi: 10.1016/j.conb.2006.08.016. [DOI] [PubMed] [Google Scholar]
- Bell CC, Han V, Sawtell NB. Cerebellum-like structures and their implications for cerebellar function. Annu Rev Neurosci. 2008;31:1–24. doi: 10.1146/annurev.neuro.30.051606.094225. [DOI] [PubMed] [Google Scholar]
- Boyden ES, Katoh A, Raymond JL. Cerebellum-dependent learning: the role of multiple plasticity mechanisms. Annu Rev Neurosci. 2004;27:581–609. doi: 10.1146/annurev.neuro.27.070203.144238. [DOI] [PubMed] [Google Scholar]
- Buhusi CV, Meck WH. What makes us tick? Functional and neural mechanisms of interval timing. Nat Rev Neurosci. 2005;6:755–765. doi: 10.1038/nrn1764. [DOI] [PubMed] [Google Scholar]
- Buonomano DV, Maass W. State-dependent computations: spatiotemporal processing in cortical networks. Nat Rev Neurosci. 2009;10:113–125. doi: 10.1038/nrn2558. [DOI] [PubMed] [Google Scholar]
- Chadderton P, Margrie TW, Häusser M. Integration of quanta in cerebellar granule cells during sensory processing. Nature. 2004;428:856–860. doi: 10.1038/nature02442. [DOI] [PubMed] [Google Scholar]
- De Zeeuw CI, Hoebeek FE, Bosman LW, Schonewille M, Witter L, Koekkoek SK. Spatiotemporal firing patterns in the cerebellum. Nat Rev Neurosci. 2011;12:327–344. doi: 10.1038/nrn3011. [DOI] [PubMed] [Google Scholar]
- Ebner TJ, Hewitt AL, Popa LS. What features of limb movements are encoded in the discharge of cerebellar neurons? Cerebellum. 2011;10:683–693. doi: 10.1007/s12311-010-0243-0. [DOI] [PMC free article] [PubMed] [Google Scholar]
- Fecteau JH, Munoz DP. Correlates of capture of attention and inhibition of return across stages of visual processing. J Cogn Neurosci. 2005;17:1714–1727. doi: 10.1162/089892905774589235. [DOI] [PubMed] [Google Scholar]
- Gauck V, Jaeger D. The control of rate and timing of spikes in the deep cerebellar nuclei by inhibition. J Neurosci. 2000;20:3006–3016. doi: 10.1523/JNEUROSCI.20-08-03006.2000. [DOI] [PMC free article] [PubMed] [Google Scholar]
- Ghose GM, Maunsell JH. Attentional modulation in visual cortex depends on task timing. Nature. 2002;419:616–620. doi: 10.1038/nature01057. [DOI] [PubMed] [Google Scholar]
- Grube M, Cooper FE, Chinnery PF, Griffiths TD. Dissociation of duration-based and beat-based auditory timing in cerebellar degeneration. Proc Natl Acad Sci U S A. 2010;107:11597–11601. doi: 10.1073/pnas.0910473107. [DOI] [PMC free article] [PubMed] [Google Scholar]
- Hoebeek FE, Witter L, Ruigrok TJ, De Zeeuw CI. Differential olivo-cerebellar cortical control of rebound activity in the cerebellar nuclei. Proc Natl Acad Sci U S A. 2010;107:8410–8415. doi: 10.1073/pnas.0907118107. [DOI] [PMC free article] [PubMed] [Google Scholar]
- Hoover JE, Strick PL. The organization of cerebellar and basal ganglia outputs to primary motor cortex as revealed by retrograde transneuronal transport of herpes simplex virus type 1. J Neurosci. 1999;19:1446–1463. doi: 10.1523/JNEUROSCI.19-04-01446.1999. [DOI] [PMC free article] [PubMed] [Google Scholar]
- Ito M. The molecular organization of cerebellar long-term depression. Nat Rev Neurosci. 2002;3:896–902. doi: 10.1038/nrn962. [DOI] [PubMed] [Google Scholar]
- Ivry RB, Spencer RM. The neural representation of time. Curr Opin Neurobiol. 2004;14:225–232. doi: 10.1016/j.conb.2004.03.013. [DOI] [PubMed] [Google Scholar]
- Janssen P, Shadlen MN. A representation of the hazard rate of elapsed time in macaque area LIP. Nat Neurosci. 2005;8:234–241. doi: 10.1038/nn1386. [DOI] [PubMed] [Google Scholar]
- Kim JJ, Thompson RF. Cerebellar circuits and synaptic mechanisms involved in classical eyeblink conditioning. Trends Neurosci. 1997;20:177–181. doi: 10.1016/S0166-2236(96)10081-3. [DOI] [PubMed] [Google Scholar]
- Krause V, Schnitzler A, Pollok B. Functional network interactions during sensorimotor synchronization in musicians and non-musicians. Neuroimage. 2010;52:245–251. doi: 10.1016/j.neuroimage.2010.03.081. [DOI] [PubMed] [Google Scholar]
- Kunimatsu J, Tanaka M. Alteration of the timing of self-initiated but not reactive saccades by electrical stimulation in the supplementary eye field. Eur J Neurosci. 2012;36:3258–3268. doi: 10.1111/j.1460-9568.2012.08242.x. [DOI] [PubMed] [Google Scholar]
- Lee IH, Assad JA. Putaminal activity for simple reactions or self-timed movements. J Neurophysiol. 2003;89:2528–2537. doi: 10.1152/jn.01055.2002. [DOI] [PubMed] [Google Scholar]
- Leon MI, Shadlen MN. Representation of time by neurons in the posterior parietal cortex of the macaque. Neuron. 2003;38:317–327. doi: 10.1016/S0896-6273(03)00185-5. [DOI] [PubMed] [Google Scholar]
- Lewis PA, Miall RC. Distinct systems for automatic and cognitively controlled time measurement: evidence from neuroimaging. Curr Opin Neurobiol. 2003;13:250–255. doi: 10.1016/S0959-4388(03)00036-9. [DOI] [PubMed] [Google Scholar]
- Llinás RR. Inferior olive oscillation as the temporal basis for motricity and oscillatory reset as the basis for motor error correction. Neuroscience. 2009;162:797–804. doi: 10.1016/j.neuroscience.2009.04.045. [DOI] [PMC free article] [PubMed] [Google Scholar]
- Maimon G, Assad JA. Parietal area 5 and the initiation of self-timed movements versus simple reactions. J Neurosci. 2006;26:2487–2498. doi: 10.1523/JNEUROSCI.3590-05.2006. [DOI] [PMC free article] [PubMed] [Google Scholar]
- Mauk MD, Buonomano DV. The neural basis of temporal processing. Annu Rev Neurosci. 2004;27:307–340. doi: 10.1146/annurev.neuro.27.070203.144247. [DOI] [PubMed] [Google Scholar]
- Mayo JP, Sommer MA. Neuronal adaptation caused by sequential visual stimulation in the frontal eye field. J Neurophysiol. 2008;100:1923–1935. doi: 10.1152/jn.90549.2008. [DOI] [PMC free article] [PubMed] [Google Scholar]
- Mayo JP, Sommer MA. Neuronal correlates of visual time perception at brief timescales. Proc Natl Acad Sci U S A. 2013;110:1506–1511. doi: 10.1073/pnas.1217177110. [DOI] [PMC free article] [PubMed] [Google Scholar]
- Medina JF, Mauk MD. Computer simulation of cerebellar information processing. Nat Neurosci. 2000;3(Suppl):1205–1211. doi: 10.1038/81486. [DOI] [PubMed] [Google Scholar]
- Merchant H, Zarco W, Pérez O, Prado L, Bartolo R. Measuring time with different neural chronometers during a synchronization-continuation task. Proc Natl Acad Sci U S A. 2011;108:19784–19789. doi: 10.1073/pnas.1112933108. [DOI] [PMC free article] [PubMed] [Google Scholar]
- Merchant H, Harrington DL, Meck WH. Neural basis of the perception and estimation of time. Annu Rev Neurosci. 2013;36:313–336. doi: 10.1146/annurev-neuro-062012-170349. [DOI] [PubMed] [Google Scholar]
- Moberget T, Karns CM, Deouell LY, Lindgren M, Knight RT, Ivry RB. Detecting violations of sensory expectancies following cerebellar degeneration: a mismatch negativity study. Neuropsychologia. 2008;46:2569–2579. doi: 10.1016/j.neuropsychologia.2008.03.016. [DOI] [PMC free article] [PubMed] [Google Scholar]
- Nixon PD, Passingham RE. Predicting sensory events. The role of the cerebellum in motor learning. Exp Brain Res. 2001;138:251–257. doi: 10.1007/s002210100702. [DOI] [PubMed] [Google Scholar]
- Ohmae S, Lu X, Takahashi T, Uchida Y, Kitazawa S. Neuronal activity related to anticipated and elapsed time in macaque supplementary eye field. Exp Brain Res. 2008;184:593–598. doi: 10.1007/s00221-007-1234-3. [DOI] [PubMed] [Google Scholar]
- Rothman JS, Cathala L, Steuber V, Silver RA. Synaptic depression enables neuronal gain control. Nature. 2009;457:1015–1018. doi: 10.1038/nature07604. [DOI] [PMC free article] [PubMed] [Google Scholar]
- Schultz W, Romo R. Role of primate basal ganglia and frontal cortex in the internal generation of movements. I. Preparatory activity in the anterior striatum. Exp Brain Res. 1992;91:363–384. doi: 10.1007/BF00227834. [DOI] [PubMed] [Google Scholar]
- Strick PL. The influence of motor preparation on the response of cerebellar neurons to limb displacements. J Neurosci. 1983;3:2007–2020. doi: 10.1523/JNEUROSCI.03-10-02007.1983. [DOI] [PMC free article] [PubMed] [Google Scholar]
- Strick PL, Dum RP, Fiez JA. Cerebellum and nonmotor function. Annu Rev Neurosci. 2009;32:413–434. doi: 10.1146/annurev.neuro.31.060407.125606. [DOI] [PubMed] [Google Scholar]
- Sumbre G, Muto A, Baier H, Poo MM. Entrained rhythmic activities of neuronal ensembles as perceptual memory of time interval. Nature. 2008;456:102–106. doi: 10.1038/nature07351. [DOI] [PMC free article] [PubMed] [Google Scholar]
- Tanaka M. Involvement of the central thalamus in the control of smooth pursuit eye movements. J Neurosci. 2005;25:5866–5876. doi: 10.1523/JNEUROSCI.0676-05.2005. [DOI] [PMC free article] [PubMed] [Google Scholar]
- Tanaka M. Cognitive signals in the primate motor thalamus predict saccade timing. J Neurosci. 2007;27:12109–12118. doi: 10.1523/JNEUROSCI.1873-07.2007. [DOI] [PMC free article] [PubMed] [Google Scholar]
- Tesche CD, Karhu JJ. Anticipatory cerebellar responses during somatosensory omission in man. Hum Brain Mapp. 2000;9:119–142. doi: 10.1002/(SICI)1097-0193(200003)9:3<119::AID-HBM2>3.0.CO;2-R. [DOI] [PMC free article] [PubMed] [Google Scholar]
- Trouche E, Beaubaton D. Initiation of a goal-directed movement in the monkey. Role of the cerebellar dentate nucleus. Exp Brain Res. 1980;40:311–321. doi: 10.1007/BF00237796. [DOI] [PubMed] [Google Scholar]
- Tsujimoto T, Gemba H, Sasaki K. Effect of cooling the dentate nucleus of the cerebellum on hand movement of the monkey. Brain Res. 1993;629:1–9. doi: 10.1016/0006-8993(93)90473-Z. [DOI] [PubMed] [Google Scholar]
- Wise AK, Cerminara NL, Marple-Horvat DE, Apps R. Mechanisms of synchronous activity in cerebellar Purkinje cells. J Physiol. 2010;588:2373–2390. doi: 10.1113/jphysiol.2010.189704. [DOI] [PMC free article] [PubMed] [Google Scholar]
- Wittmann M. The inner sense of time: how the brain creates a representation of duration. Nat Rev Neurosci. 2013;14:217–223. doi: 10.1038/nrn3452. [DOI] [PubMed] [Google Scholar]
- Wolpert DM, Miall RC, Kawato M. Internal models in the cerebellum. Trends Cogn Sci. 1998;2:338–347. doi: 10.1016/S1364-6613(98)01221-2. [DOI] [PubMed] [Google Scholar]
- Yabe H, Tervaniemi M, Reinikainen K, Näätänen R. Temporal window of integration revealed by MMN to sound omission. Neuroreport. 1997;8:1971–1974. doi: 10.1097/00001756-199705260-00035. [DOI] [PubMed] [Google Scholar]