

Abstract
Neural oscillatory dynamics are a candidate mechanism to steer perception of time and temporal rate change. While oscillator models of time perception are strongly supported by behavioral evidence, a direct link to neural oscillations and oscillatory entrainment has not yet been provided. In addition, it has thus far remained unaddressed how context-induced illusory percepts of time are coded for in oscillator models of time perception. To investigate these questions, we used magnetoencephalography and examined the neural oscillatory dynamics that underpin pitch-induced illusory percepts of temporal rate change. Human participants listened to frequency-modulated sounds that varied over time in both modulation rate and pitch, and judged the direction of rate change (decrease vs increase). Our results demonstrate distinct neural mechanisms of rate perception: Modulation rate changes directly affected listeners' rate percept as well as the exact frequency of the neural oscillation. However, pitch-induced illusory rate changes were unrelated to the exact frequency of the neural responses. The rate change illusion was instead linked to changes in neural phase patterns, which allowed for single-trial decoding of percepts. That is, illusory underestimations or overestimations of perceived rate change were tightly coupled to increased intertrial phase coherence and changes in cerebro-acoustic phase lag. The results provide insight on how illusory percepts of time are coded for by neural oscillatory dynamics.
Introduction
Perception of time is a core human ability (Grondin, 2008). To explain temporal phenomena, an important line of research focuses on the potential role of oscillatory processes. In an oscillator model of time perception, an internal oscillator characterized by natural oscillatory dynamics adapts its period and phase by entraining to rhythmic external stimulation, thereby providing a metric for measuring the passage of time (Large and Jones, 1999; Barnes and Jones, 2000; McAuley and Jones, 2003).
Importantly, neural oscillations provide a likely candidate for a neural instantiation of oscillator models of time perception (Large, 2008). Neural activity entrains to a variety of rhythmic stimulation rates (Herrmann, 2001; Picton et al., 2003; Lakatos et al., 2005, 2013; Henry and Obleser, 2012), thus providing a brain mechanism capable of flexibly tracking temporally-structured external stimuli. Consistent with oscillator models, entrainment of neural oscillations is presumed to reflect alignment of high neural excitability phases to events occurring in time (Schroeder and Lakatos, 2009; Buzsáki et al., 2012). The entrained neural frequency and neural phase of an oscillator and its (a)synchrony with external events provides the means to judge time (McAuley, 1995; Large, 2008).
Notably, perceived time is not necessarily a precise reflection of physical features (veridical percepts), but can be influenced by contextual factors such as visual space (Jones and Huang, 1982), sound intensity (Alards-Tomalin et al., 2013), or pitch (Shigeno, 1986; Boltz, 1998, 2011; Henry and McAuley, 2009). In particular, the pitch trajectory of a stimulus has been shown to distort perceived stimulus timing (Shigeno, 1986; Henry and McAuley, 2009, 2013). Furthermore, time–pitch interactions in auditory perception are hypothesized to occur at auditory sensory levels (Shigeno, 1986), thus, in cortical regions that are related to pitch processing (Schönwiesner and Zatorre, 2008; Griffiths et al., 2010) and that entrain to rhythmic auditory stimuli (Giraud et al., 2000; Lakatos et al., 2005, 2013).
Importantly, oscillator models of time perception are strongly supported by behavioral findings (Barnes and Jones, 2000, Jones et al., 2002), but lack evidence of a direct connection to neural oscillatory dynamics. Furthermore, oscillator models do not comment on how pitch-induced perceptual illusions of time are coded in the internal oscillator's period and phase. The current study was designed to examine these questions. We investigated the perceived modulation rate of a continuous rhythmic (frequency-modulated) stimulus that varied over time in both modulation rate and pitch. The modulation rate of the stimulus either increased (speeding up) or decreased (slowing down) over the duration of the sound, while changes in pitch were used as a manipulation to induce illusory percepts of modulation rate change (Boltz, 1998, 2011).
We used magnetoencephalography (MEG) to investigate (1) how the rate–pitch interdependence is coded in neural oscillatory dynamics, (2) whether veridical and illusory percepts of time are coded for by different neural mechanisms, and, more specifically, (3) whether changes in pitch, if affecting perceived rate changes, influence the exact oscillatory frequency of the neural responses.
Materials and Methods
Participants
Eighteen adults participated in the current study (age range: 22–33 years; 9 male). They were all right-handed (Oldfield, 1971), did not report any neurological diseases nor hearing problems in their past, gave written informed consent before the experiment, and were paid 7 Euros per hour for their participation. The study was in accordance with the Declaration of Helsinki and approved by the local ethics committee of the University of Leipzig.
Acoustic stimulation
All stimuli were created in Matlab (v7.11; The MathWorks) using an adapted version of the vco.m function, and were sampled at 44.1 kHz and 24 bit resolution. In brief, the vco.m function generates a sine wave with time-sensitive frequency modulations by manipulating the phase angles of the wave. Stimuli consisted of frequency-modulated (FM) sounds with a duration of ∼4.5 s, in which Modulation Rate (decrease; no change; increase) and Pitch (decrease; no change; increase) were manipulated in a 3 × 3 design (Fig. 1a).
Figure 1.
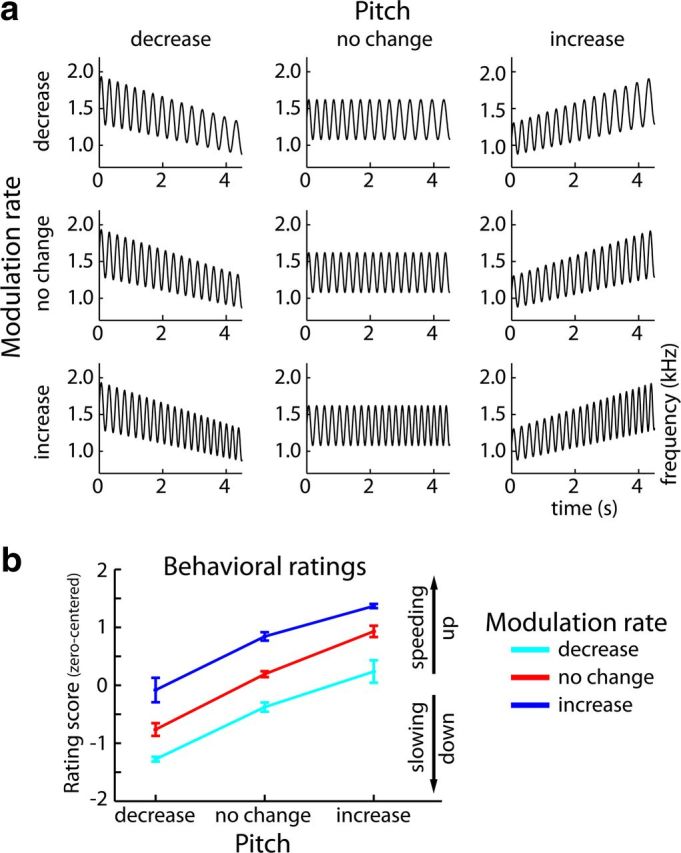
Stimulus design and behavioral ratings. a, Rate × Pitch stimulus design. Stimuli were FM sounds that varied in modulation rate (decrease, no change, or increase over time) and pitch (decrease, no change, or increase over time). Here, the frequency modulation of example sounds is depicted, with the sounds' frequency displayed on the y-axis and time on the x-axis. Note that changes in modulation rate are schematic and were smaller in the actual stimuli. b, Mean behavioral ratings (±SEM) along the Rate and Pitch dimensions. Behavioral ratings are zero-centered, such that positive ratings belong to the percept of speeding up and negative values to the percept of slowing down.
For the factor Modulation Rate, the carrier frequency of the sounds was modulated by a sinusoidal function, where the modulation rate either linearly decreased from 3.95 to 3.28 Hz (rate-decrease condition), remained constant at 3.95 Hz (rate-no-change condition), or linearly increased from 3.95 to 4.62 Hz (rate-increase condition) over the duration of the sound. The modulation depth was fixed at ±20% of the mean carrier frequency, which took on one of 10 values ranging from 1150 to 1550 Hz.
For the factor Pitch, the carrier frequency itself was manipulated such that it either linearly decreased from 120 to 80% of the mean carrier frequency (pitch-decrease condition), remained constant at 100% (pitch-no-change condition), or linearly increased from 80 to 120% (pitch-increase condition) over the duration of the sound. For carrier frequency manipulations, modulation depth was scaled accordingly and thus remained consistent with the logarithmic nature of the auditory system (Fig. 1a).
Note also that stimuli were not exactly 4.5 s in duration but shorter or longer by one quarter of a cycle of the ending modulation rate. This was done to ensure that half of the trials ended in the rising phase of the frequency modulation and the other half in the falling phase. Hence, any perceptual differences potentially arising from different final trajectories of the sounds' frequency were controlled for across trials. The starting phase of the frequency modulation was always zero.
Procedure
Sounds were presented via in-ear headphones at 60 dB above the participants' individual hearing threshold, which was determined for a 1500 Hz tone at the beginning of the experiment.
Each experimental trial in the MEG experiment comprised the presentation of a sound and a subsequent button press (middle and index fingers of the left and right hand). Participants were asked to judge the degree of modulation rate change over the duration of the sound using a four-point rating scale (ranging from 1 to 4). In one half of the blocks, a rating of 1 referred to the perception of strongly decreasing modulation rate (slowing down) and 4 to the perception of strongly increasing modulation (speeding up), while in the other half of the blocks response mappings were reversed. Response mappings were alternated between blocks, and participants were reminded of the specific instructions before each block began, and after each sound presentation before responding.
The experiment was divided into six blocks. Within each block, 10 trials (with different carrier frequencies) of each of the nine conditions were randomly presented. Hence, 60 trials of each condition were presented overall.
Before the MEG recording, participants were presented with extreme examples of modulation rate changes without changes in pitch, to familiarize them with the relevant stimulus dimension. Furthermore, participants conducted a short training block similar to the experimental blocks before the MEG recording started.
Behavioral data analysis
In half of the blocks, the button assignment was switched. Thus, responses were transformed such that for each trial “1” related to the percept of strongly slowing down and “4” strongly speeding up. Subsequently, responses were zero-centered (where −1.5 reflects strongly slowing down and 1.5 speeding up), and mean perceptual ratings were acquired for each condition and participant by averaging across trials.
For the statistical analysis, a repeated-measures ANOVA (rmANOVA) with the factors Rate (decrease; no change; increase) and Pitch (decrease; no change; increase) was carried out on the behavioral ratings. Linear trend analyses were conducted to test whether ratings changed linearly along rate and pitch dimensions. Throughout the study, whenever the assumption of sphericity was violated, Greenhouse–Geisser correction was applied (Greenhouse and Geisser, 1959).
MEG recording and data preprocessing
Participants were seated in an electromagnetically shielded room (Vacuumschmelze). MEG was recorded at a sampling rate of 500 Hz using a 306-channel Neuromag Vectorview MEG (Elekta). Electrooculogram was recorded from vertical and horizontal bipolar montages to measure blinks and eye movements. The data were filtered online from DC to 160 Hz. During blocks, the position of the participant's head was measured by five continuous head position indicator coils. Participants did not move >15 mm (mean: 4 mm) within a block of recording.
The signal space separation method was applied offline to suppress external interferences, interpolate bad channels, and transform individual data to a common sensor space that allows statistical comparisons across participants (Taulu et al., 2004).
Data analysis was carried out using the Fieldtrip software [http://fieldtrip.fcdonders.nl/; v20120826 (Oostenveld et al., 2011)] in combination with custom Matlab scripts. In the current study, only the 204 orthogonal planar gradiometers in 102 locations were used, as they are most sensitive to magnetic fields coming directly from below them (Hämäläinen et al., 1993). MEG recordings were high-pass filtered offline at 1.2 Hz (zero-phase-shift), low-pass filtered at 80 Hz (zero-phase-shift), and down-sampled to 200 Hz. Recordings were divided into epochs of −2.5 to 7 s time-locked to the stimulus onset. Singular value decomposition (SVD) was carried out to find the number of spatial components explaining 99.9% variance in the data, and independent components analysis (ICA) was applied to those components to correct for artifacts such as eye movements, heart activity, and noisy channels. Finally, data were projected back to the original 204 MEG channels, and epochs were excluded if the signal range was larger than 200 pT/m in any of the gradiometer channels.
In three participants, the main ICA components showing clear posterior alpha activity were excluded because in these participants a high number of trials would have been lost in the subsequent signal-range artifact rejection procedure. In one participant, one block of MEG data could not be used for the brain data analysis due to technical problems. For this participant, the number of trials selected in the analyses described below was adjusted accordingly.
MEG data analysis
Neural entrainment to rhythmic stimulation.
In a first analysis, the aim was to examine whether the rhythmic FM stimulus leads to neural phase-locking/entrainment of brain responses. On this account, single-trials were averaged for each of the three pitch conditions at constant rate. For each participant, condition and channel, a fast Fourier transform (FFT; zero-padded; 0.005 Hz frequency resolution) was then applied to the 1–4 s time interval tapered with a Hann window, and power spectra were calculated as the squared magnitude of the resulting complex values. Finally, power spectra were averaged across all channels. For the statistical analysis, mean power in the 3.9–4 Hz frequency bins was tested against the mean power of 0.1 Hz wide neighboring bins reflecting noise (cf. Picton et al., 2003). Note that these analyses were only conducted on the three pitch conditions at constant rate because changes in the neural oscillatory dynamics over time are more precisely captured in time-frequency representations (see below).
Source localization of entrained brain areas.
To examine with high spatial resolution which brain areas were entrained by the rhythmic stimulation, source localizations were calculated for the three pitch conditions at constant rate. On this account, individual T1-weighted MRI images (3T Magnetom Trio, Siemens AG) were used to construct topographical representations of the cortical surface of each hemisphere (using Freesurfer; (http://surfer.nmr.mgh.harvard.edu/).
Using the MNE toolbox (http://www.martinos.org/mne/), the MR and the MEG coordinate systems were coregistered using approximately 150 digitized points on the head surface (Polhemus FASTRAK 3D digitizer). In each participant, a boundary element model was computed using the inner skull surface as volume conductor. Individual source models were constructed using the mid-gray matter surface in each hemisphere. On this account, the ∼130,000 vertices describing the cortical surface of one hemisphere were reduced to 10,242 vertices.
For the inverse solution, brain activity was projected to source space using an adaptive spatial filter in the frequency domain [dynamic imaging of coherent sources (DICS); (Gross et al., 2001)]. The DICS technique is based on the cross-spectral density matrix, which was obtained from the single-trial average in each condition by applying a Hann-taper FFT estimate of the 1–4 s time interval and the 3.95 Hz frequency bin. Source localization was conducted independently for each hemisphere. Thus, two source localizations were conducted in each participant and condition, one for the left hemisphere (using only the sources and channels in the left) and one for the right (using only the sources and channels in the right). Calculating inverse solutions for each hemisphere independently is justified here, because activation sensor topographies clearly show left and right auditory maxima and the gradiometer channels only pick up magnetic fields coming from close proximity [mostly from the cortical sheet; for a similar approach see the study by Millman et al. (2010)]. For the final activation distribution, a neural activity index (NAI) was calculated by dividing the activation by the noise power estimate (Van Veen et al., 1997).
To average solutions across participants, the individual cortical representations were transformed to a sphere representation, which resulted in a unique coordinate system for all participants (Fischl et al., 1999b). For visual purposes, this representation was finally morphed to the partially inflated cortical surface of the Freesurfer standard brain [fsaverage (Fischl et al., 1999a)].
Intertrial phase coherence: neural best frequency and strength of coherence.
Next, a time-frequency representation of each trial was acquired using the Fieldtrip implemented version of the Wavelet approach, where the time series was convolved with Morlet wavelets (Tallon-Baudry and Bertrand, 1999). Single-trial time-frequency representations were calculated for the 1–4 s poststimulus onset time interval (in steps of 0.02 s) and the 2–6 Hz frequencies (in steps of 0.05 Hz) with a wavelet size of six cycles. Note that the chosen time window excludes sound onset and offset responses.
The resulting complex values were used to calculate intertrial phase coherence (ITPC) (Lachaux et al., 1999). ITPC is a measure of phase-locked neural activity over trials, and hence reflects the consistency with which neural responses were phase-locked to the stimulus from trial to trial. Thus, in the context of stimulus-driven neural entrainment, ITPC can be interpreted as the precision with which neural phase on each trial is coupled to the rhythmic stimulation. That is, increased variability of trial-by-trial phase-locking decreases the ITPC measure, while ITPC increases when trial-by-trial variability is reduced.
For each participant and condition, intertrial phase coherence was calculated for each channel and time-frequency bin, and then averaged across the 56 channels in 28 locations over auditory cortices (see Fig. 3a,b). Three dependent measures were estimated from these ITPC time-frequency representations using linear fits to ITPC values: (1) neural best frequency (in Hz) at sound offset, (2) epoch-final ITPC strength, and (3) change in ITPC strength over time.
Figure 3.

ITPC for the 3 Rate × 3 Pitch conditions. a, Sensor topographical distributions of ITPC values for each condition (mean across 1–4 s and 3.2–4.7 Hz). Bottom, 28 positions of the 56 channels over auditory cortices used for subsequent analyses. b, ITPC for all conditions (mean across the 56 channels over auditory cortices, see a). c, Mean estimated neural best frequency (±SEM) at sound offset (4.5 s) for each condition. d, Mean epoch-final ITPC strength (±SEM; 3.8–4 s time interval). e, Mean estimated slopes (of linear fits; ±SEM) reflecting change of ITPC strength over time.
To obtain stable estimates of these dependent measures for each participant and condition, ITPC time-frequency representations were fed into a simplified jackknifing approach (Smulders, 2010). For each condition, one participant was left out, while the ITPC time-frequency representations of the remaining participants were averaged. Subsequently, the frequency at which ITPC was highest (best frequency) and the corresponding ITPC value were extracted independently for each time point. Then, a linear function was fitted to the extracted best frequencies as a function of time, and the neural best frequency at 4.5 s was predicted using the estimated coefficients. The extrapolation of the predicted neural best frequency to the 4.5 s time point was chosen to relate it to the physical modulation rate at the sound offset. Furthermore, a linear function was fitted to the extracted best frequency ITPC values as a function of time. Coefficients from the linear fit were used to predict ITPC values for the 3.8–4 s time interval. These predicted epoch-final ITPC values were then averaged to obtain a measure of ITPC strength. Slope values of the linear fit were used as a measure of change in ITPC strength over time. This procedure was repeated such that each participant was left out once, separately for each condition. To obtain for each condition a participant-specific (i.e., within-subject) estimate of the three dependent measures for analysis with an rmANOVA, the equation proposed for the simplified jackknifing approach was used (Smulders, 2010) as follows: yi = nX̄ − (n − 1)xi, where yi refers to a participant-specific estimate of one dependent measure in one condition, xi to the sub-average of that measure for which the participant was left out, n to the number of participants, and X̄ to the mean across sub-averages in x. Critically, although jackknifing makes uses of sub-averages across participants to calculate stable estimates of individual data, the approach of Smulders (2010) effectively transfers the subaverage values back to the individual participant. That is, the individual estimates from the current jackknifing approach reflect within-participant measures that should be interpreted similar to those derived from original single-participant ITPC values.
For the statistical analyses, independent Rate (decrease; no change; increase) × Pitch (decrease; no change; increase) rmANOVAs were conducted for each dependent measure: predicted neural best frequency (in Hz) at sound offset, epoch-final ITPC strength, and slope values (i.e., change of ITPC strength over time).
Cerebro-acoustic phase lag.
Condition-specific phase lags between the acoustic signal and the neural responses were calculated using cross-correlation. To this end, single-trials were averaged for each condition separately and the 1–4 s poststimulus onset time interval was chosen for the analysis. The condition-specific averaged neural responses were correlated with their respective frequency modulation of the acoustic signal (1–4 s time interval), and correlations were calculated for time lags ranging from −0.33 to 0.33 s. Subsequently, the time lag at which the correlation between acoustic signal and MEG signal was highest was extracted and converted to a phase lag/angle (in radians). Conversion of time lag (linear) to phase lag (circular) and subsequent analyses using circular statistics was carried out to account for autocorrelations in the acoustic signal, which prohibit inferences about whether the brain signal was leading or lagging the acoustic signal. Cross-correlation and extraction of cerebro-acoustic phase lag was conducted at each channel separately.
For the statistical analysis, a Harrison–Kanji test was carried out using the phase lag (angle) as dependent measure (Berens, 2009). In essence, the Harrison–Kanji test reflects a circular version of a two-way ANOVA that tests whether mean directions of two or more groups are identical or not. The circular ANOVA included the factors Rate (decrease; no change; increase) and Pitch (decrease; no change; increase). Statistical analyses were conducted at each channel separately and significance levels were Bonferroni-corrected (yielding PBonf) to account for multiple tests across channels. Results are expressed as topographical sensor distributions for Rate and Pitch main effects and the Rate × Pitch interaction.
Single-trial classification of rate and pitch conditions.
To examine whether single-trial time-frequency data contain sufficient information to correctly decode the different conditions, single-trial classifications were carried out following the approach described in the study by Ng et al. (2013) (see also Luo and Poeppel, 2007).
In detail, classifications were independently conducted on single-trial time-frequency phase representations (calculated as the angle of the complex Wavelet transform coefficients) and on single-trial time-frequency power representations (calculated as the squared magnitude of the complex Wavelet transform coefficients). On this account, each trial was organized, such that it consisted of one concatenated time-frequency vector, containing 1–4 s of time information (in steps of 0.02) at each of the 3.2–4.7 Hz frequency bins (in steps of 0.05 Hz).
Single-trial classification was then carried out as follows. First, one trial of one condition was left out. Second, for each condition, a template was created as the average across all remaining trials of that condition (circular mean for phase data). Third, the distance between each template and the trial that was left out was calculated using the circular distance (and then the circular mean over time and frequency) for phase data and the l2 norm of the linear distance for power data. Finally, the decoded label of that trial was selected as the label of the template to which the distance was smallest.
Classification was carried out for each trial of each condition and separately for each channel. A decoding matrix was extracted as a decoded label × stimulus label matrix containing proportions of classified trials. Decoding matrices were averaged over the 56 channels at the 28 locations over auditory cortices (see Fig. 3a). The diagonal of the decoded label × stimulus label matrix reflects the correctly classified conditions, thus the decoding accuracy.
In a first overall classification, all nine conditions were fed into the classification approach. This led to one 9 × 9 decoding matrix for phase data and one 9 × 9 decoding matrix for power data in each participant, thereby providing an overall distribution of decoding results. However, if one dimension (e.g., modulation rate) is more accurately decoded than the other dimension (e.g., pitch), comparisons against chance level could be positively biased.
Thus, three independent classifications were conducted to decode pitch conditions (separately for phase and power data), one within each rate condition (decrease; no change; increase). In these classifications rate was kept constant, while the pitch conditions were decoded. Decoding accuracies, that is the individual elements of the decoding matrix diagonal, were extracted for each pitch condition in each classification.
Likewise, three independent classifications were conducted to decode rate conditions (separately for phase and power data), one within each pitch condition (decrease; no change; increase). Hence, in these classifications pitch was kept constant, while the rate conditions were decoded. Decoding accuracies were extracted for each rate condition in each classification.
Decoding accuracies were then tested against chance level (p = 1/3) using a one-sample t test. To account for multiple comparisons, the Bonferroni correction was applied for chance-level tests (yielding PBonf).
Classification of subjective modulation rate perception.
To investigate whether the subjective percepts of “slowing down” and “speeding up” can be accurately decoded from neural phase data, single-trials of the three pitch conditions (decrease; no change; increase) within the no-change rate condition were sorted according to the participants' button presses. Trials that were responded to with “1” or “2” were categorized as slowing down and trials that were responded to with “3” or “4” were categorized as speeding up. Participants who had <60 trials in one of the perceptual categories (N = 4) were excluded from this analysis. For the remaining participants (N = 14), classification was conducted on 60 randomly drawn trials per perceptual category (i.e., approximating the number of trials per category in the analysis describe above). Randomly drawing trials from each category and subsequent classification was repeated 100 times, and decoding accuracies were averaged across repetitions and the 56 channels in 28 positions over auditory cortices. Decoding accuracies were then tested against chance level (p = 0.5) using a one-sample t test (including Bonferroni correction).
Results
Perceived modulation rate depends on both rate and pitch change
To investigate whether pitch changes induced distortions in perceived modulation rate, behavioral ratings were analyzed in a Rate × Pitch rmANOVA. The rmANOVA revealed main effects of Rate (F(2,34) = 52.88, p < 0.001, ε = 0.523) and Pitch (F(2,34) = 61.37, p < 0.001, ε = 0.545), whereas the Rate × Pitch interaction was not significant (F(4,68) = 1.78, p = 0.169, ε = 0.670). Linear trends were significant along both dimensions. With increasing rate (F(1,17) = 52.88, p < 0.001) and increasing pitch (F(1,17) = 63.67, p < 0.001), participants reported that the sounds were speeding up (Fig. 1b). These results show that participants perceived modulation rate changes, but at the same time show that their modulation rate judgments were strongly biased by changes in pitch.
Auditory cortex activity entrains to rhythmic acoustic stimulation
Regarding the neural data, we first examined the neural responses entrained by the rhythmic stimulation, and, second, localized the brain regions showing the strongest entrained response. In each of the three pitch conditions at constant rate (i.e., rate-no-change condition), brain activity was significantly enhanced at the sounds' modulation rate, at 3.95 Hz (mean power 3.9–4 Hz tested against the mean power of 0.1 Hz wide neighboring bins reflecting noise; for all, F(1,17) > 25, p < 0.001). We also observed a significant peak at the 7.9 Hz frequency over auditory cortices (first harmonic; for all, F(1,17) > 7.0, p < 0.05). However, in the following we focus on the neural frequencies that correspond to the stimulation frequencies because a response peak at the first harmonic of the stimulation frequency is a well-known finding for frequency-modulated sounds (Picton et al., 2003; Henry and Obleser, 2012).
For the 3.95 Hz frequency bin, the brain regions entraining to the rhythmic stimulation were localized. In line with the topographical distributions of the 3.95 Hz power in sensor space (Fig. 2, top), source reconstructions show strongest activity in auditory cortex areas (Fig. 2, bottom).
Figure 2.

Brain activity power spectra and source localizations. Top, Power spectra for the three pitch conditions at constant rate (mean over channels and participants). Asterisks mark significant enhancement of power at the sound's modulation rate (3.95 Hz; p < 0.001). Sensor topographical distributions are shown for the mean of the 3.9–4 Hz frequency bins. Bottom, Source localization of NAI at 3.95 Hz. Activity is displayed on a partially inflated standard brain surface, with dark gray representing sulci and light gray representing gyri. Enlarged displays of auditory cortices are provided for white dashed squares (LH, left hemisphere; RH, right hemisphere; HG, Heschl's gyrus; STG, superior temporal gyrus).
Neural oscillatory activity is driven by modulation rate
In a next step, we investigated whether sounds eliciting a strong illusion of modulation rate change influence the exact frequency of the neural responses. To this end, the neural best frequency at sound offset (4.5 s) was estimated from the maximal-phase-locking trajectory of the ITPC time-frequency representations (Fig. 3) and subjected to a Rate (decrease; no change; increase) × Pitch (decrease; no change; increase) rmANOVA. The rmANOVA revealed a main effect of Rate (F(2,34) = 1161.81, p < 0.001), but no effect of Pitch (F(2,34) = 0.72, p = 0.495) and no Rate × Pitch interaction (F(4,68) = 1.72, p = 0.157). The neural best frequency at sound offset was largest (i.e., fastest) in the rate-increase conditions, smallest (i.e., slowest) in the rate-decrease conditions, and intermediate in the rate-no-change conditions (for the three pairwise comparisons, F(1,17) > 500, p < 0.001).
Thus, although changes in pitch induced strong distortions in the perceived modulation rate, the exact frequency of the neural responses was only sensitive to the sounds' physical modulation rate and was unaffected by pitch changes (Fig. 3c). In fact, mean estimated neural best frequencies at sound offset (3.29, 3.93, and 4.54 Hz for rate-decrease, no change, and increase, respectively) very closely matched the physical stimulus modulation rates presented to the participants (3.28, 3.95, and 4.62 Hz, respectively). These results indicate that a strong perceptual illusion does not affect, or result from, changes to the exact frequency of the neural response.
Intertrial phase coherence is enhanced during congruent rate-pitch percepts
To investigate which neural signature would instead reflect the robust illusory rate change, epoch-final ITPC strength (at 3.8–4 s) and change in ITPC over time (slopes from linear fits) were analyzed.
A Rate (decrease; no change; increase) × Pitch (decrease; no change; increase) rmANOVA testing for differences in epoch-final ITPC strength revealed no effect of Rate (F(2,34) = 0.54, p = 0.588), but a main effect of Pitch (F(2,34) = 8.25, p = 0.001). Importantly, the Rate × Pitch interaction was significant (F(4,68) = 4.55, p = 0.008, ε = 0.688). For pitch decrease conditions, ITPC strength decreased linearly as a function of stimulus modulation rate (F(1,17) = 6.16, p = 0.024). The opposite pattern was observed for pitch increase conditions, such that ITPC increased linearly as a function of stimulus modulation rate (F(1,17) = 6.73, p = 0.019). Thus, for a particular modulation rate condition, ITPC was strengthened when the rate–pitch manipulation yielded a congruent percept (i.e., when both modulation rate and pitch increased, or when both modulation rate and pitch decreased), but remained constant across rate conditions when pitch was not changing (F(1,17) = 0.35, p = 0.562; see Fig. 3d).
To examine changes in ITPC strength over time, slope values of the linear fits were fed into a Rate × Pitch rmANOVA. No effect of Rate (F(2,34) = 0.92, p = 0.407) or Pitch (F(2,34) = 2.51, p = 0.096) was observed. However, the Rate × Pitch interaction was significant (F(4,68) = 4.23, p = 0.004). The effects were consistent with the effects observed for epoch-final ITPC strength. For pitch decrease conditions, slopes decreased linearly as a function of modulation rate (F(1,17) = 9.78, p = 0.006). Although not statistically significant, the pattern was opposite for pitch increase conditions (F(1,17) = 2.79, p = 0.113). Slopes increased linearly as function of modulation rate. Slopes were not different across rate conditions when pitch was constant (F(1,17) = 0.36, p = 0.556). In fact, almost no change in ITPC strength over time was observed for conditions with constant pitch (Fig. 3e).
In a further analysis, the pitch-induced rate illusion (i.e., behavioral bias in perceived rate change) was linked to the ITPC patterns. Participants were split into weakly and strongly biased groups using the median of the strength of the linear trend of behavioral ratings as a function of pitch change (averaged over rate conditions). The linear trends reflect the degree to which participants' judgment of rate change was biased by pitch. For each group, a Rate × Pitch rmANOVA was conducted for epoch-final ITPC strength as well as for slope values (reflecting changes in ITPC strength over time). Importantly, the Rate × Pitch interactions were significant in the group that was strongly biased (ITPC strength: F(4,32) = 3.08, p = 0.030; slope: F(4,32) = 3.66, p = 0.015), but not in the group that was weakly biased (ITPC strength: F(4,32) = 1.67, p = 0.181; slope: F(4,32) = 1.39, p = 0.258).
These results show that the pattern of ITPC, that is, increased ITPC with increasing congruency of the rate–pitch manipulations, was strongest in participants perceiving the strongest illusion of modulation rate change.
Pitch changes affect cerebro-acoustic phase lag
The phase lag between the frequency modulation of the acoustic signal and the neural oscillatory responses was calculated at each sensor. A circular ANOVA (Harrison–Kanji test) was carried out to test for differences in phase lag (angle) between conditions.
Figure 4a displays Bonferroni-corrected significance levels (PBonf) for the main effects of Pitch and Rate and the Rate × Pitch interaction. Pitch had a strong influence on the direction of the phase lag (angle) showing consistent differences between conditions (Fig. 4b) in channels over right auditory cortex. The main effect of Rate and the Rate × Pitch interaction did not reveal significant sensor distributions. Thus, pitch changes alone were affecting the cerebro-acoustic phase lag.
Figure 4.
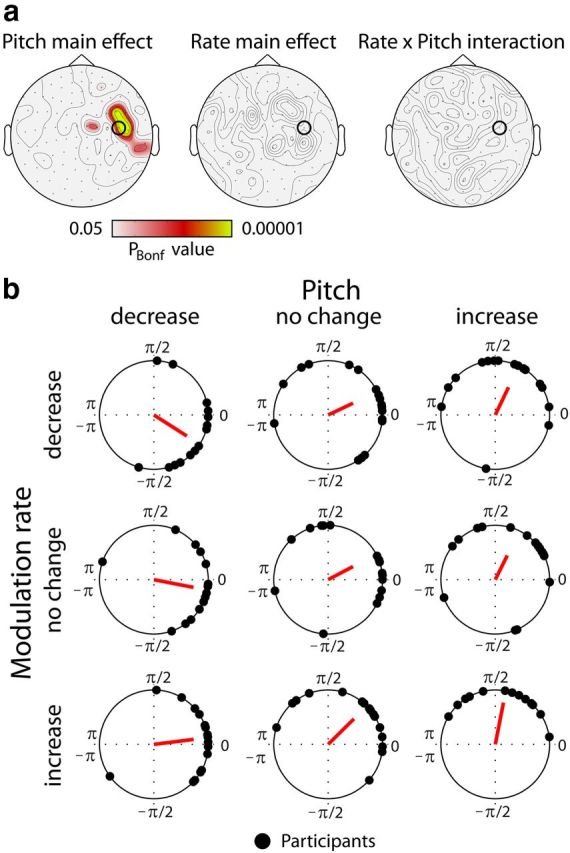
Cerebro-acoustic phase lag. a, Topographical distributions of Bonferroni-corrected significance levels (PBonf) of the Pitch and the Rate main effects and the Rate × Pitch interactions from the circular ANOVA (Harrison–Kanji test). b, Individual phase lags (angles) and mean resultant vector for each condition as obtained at one gradiometer channel over right auditory cortex (marked by the black cycle in a).
Single-trial phase (but not power) patterns code for rate and pitch changes
In an overall analysis, classification was simultaneously applied to all nine conditions. Decoding from neural phase data clearly shows a high proportion of trials classified along the diagonal, thus indicating systematically correct classification (Fig. 5a, left), while classification results were unsystematic when conditions were decoded from neural power data (Fig. 5a, right).
Figure 5.

Decoding of rate and pitch conditions from time-frequency phase and power patterns (1–4 s and 3.2–4.7 Hz). a, Decoding matrices showing proportions of classified trials with rows reflecting decoded labels and columns reflecting stimulus labels. The diagonal reflects decoding accuracies (proportion of correctly classified trials). b, Decoding accuracies from independent classifications within rate and pitch dimensions. Dashed lines indicate chance level and the asterisk marks decoding accuracies significantly larger than chance (*PBonf < 0.001).
To statistically test whether decoding accuracies in each condition exceeded chance, classifications were conducted independently within each rate condition, while pitch was decoded, and then within each pitch condition, while rate was decoded.
Classification of pitch conditions from phase data (i.e., keeping rate constant) revealed decoding accuracies larger than chance level for pitch-decrease (for all, t(17) > 7.5, PBonf < 0.001) and pitch-increase conditions (for all, t(17) > 6.5, PBonf < 0.001), but not for constant-pitch conditions (for all, t(17) < 3.5, PBonf > 0.15; Fig. 5b, first column). Classification of rate conditions (i.e., keeping pitch constant) revealed decoding accuracies larger than chance level for rate-decrease (for all, t(17) > 8.0, PBonf < 0.001), rate-no-change (for all, t(17) > 6.5, PBonf < 0.001) and rate-increase conditions (for all, t(17) > 7.0, PBonf < 0.001; Fig. 5b, second column). When decoding from power data, none of the conditions (rate or pitch) could be classified better than chance (for all, t(17) < 3.0; PBonf > 0.55; Fig. 5b, third and fourth column).
These results show that neural phase patterns code for both rate and pitch changes. Neural power patterns, on the other hand, did not contain sufficient information to separate conditions.
Subsequently, we investigated the topographical distributions of classification performance on phase data for rate and pitch decoding. On this account, decoding accuracies of the conditions that showed accuracies significantly larger than chance level (Fig. 5b, first and second column) were averaged at each of the 204 channels, independently for rate and pitch classifications. Decoding accuracies were largest over auditory cortex areas for rate and pitch classifications (Fig. 6a). Yet, decoding accuracies (averaged across the 28 channels over each auditory cortex) in the pitch classifications showed a right-hemispheric bias approaching significance (F(1,17) = 3.80, p = 0.068). In contrast, accuracies were bilaterally distributed for rate decoding (F(1,17) = 0.06, p = 0.814; Fig. 6a).
Figure 6.

Hemisphere-specific decoding accuracies and decoding of subjective ratings. a, Mean decoding accuracy (±SEM) for left and right auditory cortex regions using the phase data. b, Mean decoding accuracies (±SEM) from decoding the subjective perceptual ratings (slowing down; speeding up) from phase data and statistical results from testing decoding accuracies against chance level (dashed line). *PBonf < 0.05; #p < 0.10; n.s., not significant.
Finally, we investigated whether the neural phase data would also allow decoding the subjective percepts of slowing down and speeding up of the modulation rate from neural phase data (Fig. 6b). Decoding accuracies were significantly larger than chance level (for both, t(13) > 4.5, PBonf < 0.02), showing that neural phase data contain information about the subjective perception of modulation rate changes in sounds.
Discussion
The current study investigated the neural oscillatory dynamics of time perception and asked how strong illusory rate change percepts relate to neural oscillatory entrainment. The results can be summarized as follows: (1) Perceived stimulus modulation rate is strongly biased by changes in pitch (illusory rate change percept); (2) but the exact frequency of the neural response is exclusively determined by the stimulus modulation rate, and is not related to pitch-induced illusions; (3) pitch change, however, does influence the neural phase patterns of the entrained neural oscillations (affecting phase coherence and cerebro-acoustic phase lag). These findings directly relate human time perception to neural oscillatory dynamics.
Perceptual interaction of modulation rate and pitch
Consistent with previous findings, the current behavioral data revealed a strong perceptual interdependence between modulation rate and pitch. Participants overestimated the sound's modulation rate when pitch increased and underestimated the rate when pitch decreased (Shigeno, 1986; Henry and McAuley, 2009; Boltz, 2011). This perceptual rate-change illusion is even forceful to the point that opposing rate–pitch manipulations perceptually cancel out (Fig. 1) (cf. Boltz, 1998, 2011).
As a mechanism underlying this perceptual interdependence, it has been suggested that learned structural covariations (e.g., in speech and music) distort perceived rate so that expectations are fulfilled to achieve the learned structural unification (Jones et al., 1978; Boltz, 2011). Given the current neural activity observations, it seems then that such expectation-related processes operate already at the level of auditory cortices (see below).
Entrainment of neural oscillations in auditory cortices
We observed increased neural responses at the stimulus modulation frequency localized to auditory cortices. This indicates that neural oscillations in auditory cortex entrain to the rhythm in the acoustic stimulation (Fujioka et al., 2009; Henry and Obleser, 2012; Lakatos et al., 2013), and confirms that time–pitch interdependence is neurally coded in activations of auditory sensory cortices (Shigeno, 1986).
Outside auditory cortex proper, previous studies localized widely distributed neural substrates for time perception, including basal ganglia, supplementary motor area, and cerebellum (Grahn and Rowe, 2009; Teki et al., 2011; McAuley et al., 2012). However, most of these studies used functional imaging and thus do not allow inferences about the role of entrained neural oscillations in perceived time (but see Fujioka et al., 2012).
Auditory cortex activity, in contrast, flexibly tracks a variety of rhythmic stimulation rates (Picton et al., 2003; Lakatos et al., 2005), and has been implicated in nonlinear oscillatory dynamics proposed for oscillator models of time perception (Zanto et al., 2006; Fujioka et al., 2009).
Exact frequency of neural responses is driven by modulation rate
The current study examined whether the exact frequency of the neural responses is related to a strong perceptual illusion. This question directly concerns recent debates about the degree to which entrainment of neural oscillations influences perception and vice versa (Giraud and Poeppel, 2012; Obleser et al., 2012; Peelle and Davis, 2012).
The current findings clearly show that although pitch had a strong influence on the perceived modulation rate, the exact neural frequency was only determined by the modulation rate in the acoustic stimulation and was unaffected by changes in pitch. This finding is in line with oscillator models, such that the natural frequency of an oscillator adapts its period to the stimulation frequency (Large and Jones, 1999), thereby providing a metric for veridical rate percepts (see also Loehr et al., 2011). Thus, the current results show precise entrainment of neural responses by acoustic sweeps through different stimulation frequencies.
Illusory percepts of time are linked to neural oscillatory dynamics
In the previous sections we discussed that auditory cortical oscillations are entrained by the frequency in the acoustic stimulation, thereby coding for veridical percepts of time. Yet, if the stimulation frequency is tracked by neural oscillatory activity regardless of pitch manipulations, how do illusory percepts emerge?
In the current study we observed modulations of the phase of the entrained neural oscillation, such that intertrial phase coherence increased with congruent rate–pitch manipulations. Modulations of oscillatory phase have been reported for events that are highly predictable (Stefanics et al., 2010) and for sequences on which attention was specifically focused (Lakatos et al., 2008; Besle et al., 2011). Consequently, an increase in phase coherence with rate–pitch congruency could in principle be due to more focused attending to congruent stimulations. However, judging the direction of modulation rate change is likely more taxing in incongruent rate–pitch combinations, because rate and pitch work against each other. Hence, attention-related processes seem an unlikely explanation for increased intertrial phase coherence in congruent rate–pitch manipulations.
Here, we consider two alternative explanations. First, intertrial phase coherence can be interpreted as a measure of neural phase precision and this phase precision might code for illusory time percepts in neural oscillatory activity. Perceived rate change has been shown before to be distorted toward slowing down for low-frequency stimuli and toward speeding up for high-frequency stimuli (Feldstein and Bond, 1981; Boltz, 2011). Thus, if the phase of entrained neural oscillations provides an implicit representation of time (Large and Jones, 1999), and pitch influences perceived time, then increased phase precision for congruent manipulations would “sharpen” the temporal representation coded in the entrained oscillation. In line with this interpretation, effects of phase coherence were most pronounced in participants that had a strong pitch-induced rate change illusion. This highlights the link between illusory rate change percepts and neural phase in auditory cortex.
Alternatively, the illusory percept might be related to recruitment of oscillators with different natural frequencies. This interpretation is supported by cerebro-acoustic phase lag differences observed for pitch conditions. If the frequency of the rhythmic stimulation diverges from an oscillator's natural frequency, the oscillator can still be entrained by the stimulation, but it will tend to attract back to its natural frequency (Large and Jones, 1999; Large, 2008). Thus, we will observe phase lags that differ for oscillators with different natural frequencies. By this view, an increase in intertrial phase coherence might reflect convergence of the stimulus frequency toward the oscillator's natural frequency, since such convergence increases the stability of entrainment. Thus, if changes in pitch lead to the recruitment of oscillators with different natural frequencies (for pitch increases a faster natural frequency; for pitch decreases a slower natural frequency), intertrial phase coherence would be increased for stimulation frequencies closer to the respective oscillator's natural frequency.
The present data deliver mixed results regarding pitch-induced recruitment of oscillators with different natural frequencies: The current intertrial phase coherence results for changing pitch (decrease, increase) are consistent with this interpretation; however, the small phase coherence magnitudes for constant-pitch conditions that are not different across rates are not. Based on the phase coherence results for changing pitch, the natural frequency of the recruited oscillator in constant-pitch conditions would presumably most closely match the stimulation frequency when rate is not changing. Consequently, the largest phase coherence magnitude among constant-pitch conditions would have been expected for the no-rate-change condition because stimulation frequency and natural frequency would diverge for rate de-/increases. Thus, pitch-induced recruitment of different oscillators as a coding mechanism for illusory time gains decent support from the present data, but the null finding in phase coherence regarding the rate conditions at constant pitch also warrants some caution.
Nonetheless, the current data provide an important dissociation: Exact neural entrainment to the stimulation frequency provides a metric for veridical time percepts, while illusory percepts of rate change relate to alterations in the phase of the entrained neural oscillation.
Single-trial neural phase patterns code for rate and pitch
Single-trial decoding was able to recover stimulus conditions from neural phase, but not from neural power patterns (cf. Luo and Poeppel, 2007; Ng et al., 2013), and revealed a tendency toward better decoding of pitch conditions in right auditory cortices. This right-hemispheric bias is in line with the current effects of pitch-induced phase lag and previous studies investigating pitch processing (Johnsrude et al., 2000; Peretz and Zatorre, 2005). More generally, the decoding results suggest that neural phase patterns are the actual information-bearing elements in neural population coding (Panzeri et al., 2010), even coding for subjective percepts of rate change.
Notably, single-trial phase patterns allowed above-chance decoding of pitch conditions (decrease, increase) at constant rate although no difference in phase coherence was observed. Thus, decoding must have relied on local changes in neural phase patterns potentially related to differences in phase lag (Figs. 4, 5). We suggest that local shifts in neural phase might operate in a manner similar to physical phase perturbations used previously (Large et al., 2002). In this regard, local variations of the entrained phase might bias the rate percept over the course of the stimulus.
Conclusions
The current study investigated how neural oscillatory dynamics code for veridical and pitch-induced illusory percepts of temporal rate change. Examination of neural dynamics linked perceived modulation rate change to neural oscillations entrained by the stimulation frequency. However, entrainment frequency and effects on neural phase patterns dissociated, in that only the latter proved a neural signature of illusory rate change percepts. These results provide insight on how illusory percepts of time are coded for by neural oscillatory dynamics.
Footnotes
Research is supported by the Max Planck Society. B.H., M.J.H., and J.O. are supported by a Max Planck Research Group grant to J.O. We thank Yvonne Wolff for her help in carefully acquiring the data.
The authors declare no competing financial interests.
References
- Alards-Tomalin D, Leboe-McGowan LC, Mondor TA. Examining auditory kappa effects through manipulating intensity differences between sequential tones. Psychol Res. 2013;77:480–491. doi: 10.1007/s00426-012-0438-8. [DOI] [PubMed] [Google Scholar]
- Barnes R, Jones MR. Expectancy, attention, and time. Cogn Psychol. 2000;41:254–311. doi: 10.1006/cogp.2000.0738. [DOI] [PubMed] [Google Scholar]
- Berens P. CircStat: a MATLAB toolbox for circular statistics. J Stat Softw. 2009;31:1–21. [Google Scholar]
- Besle J, Schevon CA, Mehta AD, Lakatos P, Goodman RR, McKhann GM, Emerson RG, Schroeder CE. Tuning of the human neocortex to the temporal dynamics of attended events. J Neurosci. 2011;31:3176–3185. doi: 10.1523/JNEUROSCI.4518-10.2011. [DOI] [PMC free article] [PubMed] [Google Scholar]
- Boltz MG. Tempo discrimination of musical patterns: effects due to pitch and rhythmic structure. Percept Psychophys. 1998;60:1357–1373. doi: 10.3758/BF03207998. [DOI] [PubMed] [Google Scholar]
- Boltz MG. Illusory tempo changes due to musical characteristics. Music Percept. 2011;28:367–386. doi: 10.1525/mp.2011.28.4.367. [DOI] [Google Scholar]
- Buzsáki G, Anastassiou CA, Koch C. The origin of extracellular fields and currents—EEG, ECoG, LFP and spikes. Nat Rev Neurosci. 2012;13:407–420. doi: 10.1038/nrn3241. [DOI] [PMC free article] [PubMed] [Google Scholar]
- Feldstein S, Bond RN. Perception of speech rate as a function of vocal intensity and frequency. Lang Speech. 1981;24:387–394. doi: 10.1177/002383098102400408. [DOI] [PubMed] [Google Scholar]
- Fischl B, Sereno MI, Dale AM. Cortical surface-based analysis II: inflation, flattening, and a surface-based coordinate system. Neuroimage. 1999a;9:195–207. doi: 10.1006/nimg.1998.0396. [DOI] [PubMed] [Google Scholar]
- Fischl B, Sereno MI, Tootell RB, Dale AM. High-resolution intersubject averaging and a coordinate system for the cortical surface. Hum Brain Mapp. 1999b;8:272–284. doi: 10.1002/(SICI)1097-0193(1999)8:4<272::AID-HBM10>3.0.CO;2-4. [DOI] [PMC free article] [PubMed] [Google Scholar]
- Fujioka T, Trainor LJ, Large EW, Ross B. Beta and gamma rhythms in human auditory cortex during musical beat processing. Ann NY ACAD Sci. 2009;1169:89–92. doi: 10.1111/j.1749-6632.2009.04779.x. [DOI] [PubMed] [Google Scholar]
- Fujioka T, Trainor LJ, Large EW, Ross B. Internalized timing of isochronous sounds is represented in neuromagnetic beta oscillations. J Neurosci. 2012;32:1791–1802. doi: 10.1523/JNEUROSCI.4107-11.2012. [DOI] [PMC free article] [PubMed] [Google Scholar]
- Giraud AL, Poeppel D. Cortical oscillations and speech processing: emerging computational principles and operations. Nat Neurosci. 2012;15:511–517. doi: 10.1038/nn.3063. [DOI] [PMC free article] [PubMed] [Google Scholar]
- Giraud AL, Lorenzi C, Ashburner J, Wable J, Johnsrude IS, Frackowiak R, Kleinschmidt A. Representation of the temporal envelope of sounds in the human brain. J Neurophysiol. 2000;84:1588–1598. doi: 10.1152/jn.2000.84.3.1588. [DOI] [PubMed] [Google Scholar]
- Grahn JA, Rowe JB. Feeling the beat: premotor and striatal interactions in musicians and nonmusicians during beat perception. J Neurosci. 2009;29:7540–7548. doi: 10.1523/JNEUROSCI.2018-08.2009. [DOI] [PMC free article] [PubMed] [Google Scholar]
- Greenhouse SW, Geisser S. On methods in the analysis of profile data. Psychometrika. 1959;24:95–112. doi: 10.1007/BF02289823. [DOI] [Google Scholar]
- Griffiths TD, Kumar S, Sedley W, Nourski KV, Kawasaki H, Oya H, Patterson RD, Brugge JF, Howard MA. Direct recordings of pitch responses from human auditory cortex. Curr Biol. 2010;20:1128–1132. doi: 10.1016/j.cub.2010.04.044. [DOI] [PMC free article] [PubMed] [Google Scholar]
- Grondin S. Psychology of time. Bingley, UK: Emerald Group; 2008. [Google Scholar]
- Gross J, Kujala J, Hamalainen M, Timmermann L, Schnitzler A, Salmelin R. Dynamic imaging of coherent sources: studying neural interactions in the human brain. Proc Natl Acad Sci U S A. 2001;98:694–699. doi: 10.1073/pnas.98.2.694. [DOI] [PMC free article] [PubMed] [Google Scholar]
- Hämäläinen MS, Hari R, Ilmoniemi RJ, Knuutila J, Lounasmaa OV. Magnetoencephalography—theory, instrumentation, and applications to noninvasive studies of the working human brain. Rev Mod Phys. 1993;65:413–497. doi: 10.1103/RevModPhys.65.413. [DOI] [Google Scholar]
- Henry MJ, McAuley JD. Evaluation of an imputed pitch velocity model of the auditory kappa effect. J Exp Psych. 2009;35:551–564. doi: 10.1037/0096-1523.35.2.551. [DOI] [PubMed] [Google Scholar]
- Henry MJ, McAuley JD. Perceptual distortions in pitch and time reveal active prediction and support for an auditory pitch-motion hypothesis. PLOS One. 2013;8:e70646. doi: 10.1371/journal.pone.0070646. [DOI] [PMC free article] [PubMed] [Google Scholar]
- Henry MJ, Obleser J. Frequency modulation entrains slow neural oscillations and optimizes human listening behavior. Proc Natl Acad Sci U S A. 2012;109:20095–20100. doi: 10.1073/pnas.1213390109. [DOI] [PMC free article] [PubMed] [Google Scholar]
- Herrmann CS. Human EEG responses to 1–100 Hz flicker: resonance phenomena in visual cortex and their potential correlation to cognitive phenomena. Exp Brain Res. 2001;137:346–353. doi: 10.1007/s002210100682. [DOI] [PubMed] [Google Scholar]
- Johnsrude IS, Penhune VB, Zatorre RJ. Functional specificity in the right human auditory cortex for perceiving pitch direction. Brain. 2000;123:155–163. doi: 10.1093/brain/123.1.155. [DOI] [PubMed] [Google Scholar]
- Jones B, Huang YL. Space-time dependencies in psychophysical judgment of extent and duration: algebraic models of the tau and kappa effects. Psychol Bull. 1982;91:128–142. doi: 10.1037/0033-2909.91.1.128. [DOI] [Google Scholar]
- Jones MR, Maser DJ, Kidd GR. Rate and structure in memory for auditory patterns. Me Cognit. 1978;6:246–258. doi: 10.3758/BF03197453. [DOI] [PubMed] [Google Scholar]
- Jones MR, Moynihan H, MacKenzie N, Puente J. Temporal aspects of stimulus-driven attending in dynamic arrays. Psychol Sci. 2002;13:313–319. doi: 10.1111/1467-9280.00458. [DOI] [PubMed] [Google Scholar]
- Lachaux JP, Rodriguez E, Martinerie J, Varela FJ. Measuring phase synchrony in brain signals. Hum Brain Mapp. 1999;8:194–208. doi: 10.1002/(SICI)1097-0193(1999)8:4<194::AID-HBM4>3.0.CO;2-C. [DOI] [PMC free article] [PubMed] [Google Scholar]
- Lakatos P, Shah AS, Knuth KH, Ulbert I, Karmos G, Schroeder CE. An oscillatory hierarchy controlling neuronal excitability and stimulus processing in the auditory cortex. J Neurophysiol. 2005;94:1904–1911. doi: 10.1152/jn.00263.2005. [DOI] [PubMed] [Google Scholar]
- Lakatos P, Karmos G, Mehta AD, Ulbert I, Schroeder CE. Entrainment of neuronal oscillations as a mechanism of attentional selection. Science. 2008;320:110–113. doi: 10.1126/science.1154735. [DOI] [PubMed] [Google Scholar]
- Lakatos P, Musacchia G, O'Connel MN, Falchier AY, Javitt DC, Schroeder CE. The spectrotemporal filter mechanism of auditory selective attention. Neuron. 2013;77:750–761. doi: 10.1016/j.neuron.2012.11.034. [DOI] [PMC free article] [PubMed] [Google Scholar]
- Large EW. Resonating to musical rhythm: theory and experiment. In: Grondin S, editor. Psychology of time. Bingley, UK: Emerald Group; 2008. pp. 189–232. [Google Scholar]
- Large EW, Jones MR. The dynamics of attending: how we track time-varying events. Psychol Rev. 1999;106:119–159. doi: 10.1037/0033-295X.106.1.119. [DOI] [Google Scholar]
- Large EW, Fink P, Kelso JA. Tracking simple and complex sequences. Psychol Res. 2002;66:3–17. doi: 10.1007/s004260100069. [DOI] [PubMed] [Google Scholar]
- Loehr JD, Large EW, Palmer C. Temporal coordination and adaptation to rate change in music performance. J Exp Psychol Human. 2011;37:1292–1309. doi: 10.1037/a0023102. [DOI] [PubMed] [Google Scholar]
- Luo H, Poeppel D. Phase patterns of neuronal responses reliably discriminate speech in human auditory cortex. Neuron. 2007;54:1001–1010. doi: 10.1016/j.neuron.2007.06.004. [DOI] [PMC free article] [PubMed] [Google Scholar]
- McAuley DJ. Indiana University; 1995. Perception of time as phase: toward an adaptive-oscillator model of rhythmic pattern processing. PhD thesis. [Google Scholar]
- McAuley JD, Jones MR. Modeling effects of rhythmic context on perceived duration: a comparison of interval and entrainment approaches to short-interval timing. J Exp Psychol Human. 2003;29:1102–1125. doi: 10.1037/0096-1523.29.6.1102. [DOI] [PubMed] [Google Scholar]
- McAuley JD, Henry MJ, Tkach J. Tempo mediates the involvement of motor areas in beat perception. Ann NY ACAD Sci. 2012;1252:77–84. doi: 10.1111/j.1749-6632.2011.06433.x. [DOI] [PubMed] [Google Scholar]
- Millman RE, Prendergast G, Kitterick PT, Woods WP, Green GG. Spatiotemporal reconstruction of the auditory steady-state response to frequency modulation using magnetoencephalography. Neuroimage. 2010;49:745–758. doi: 10.1016/j.neuroimage.2009.08.029. [DOI] [PubMed] [Google Scholar]
- Ng BS, Logothetis NK, Kayser C. EEG phase patterns reflect the selectivity of neural firing. Cereb Cortex. 2013;23:389–398. doi: 10.1093/cercor/bhs031. [DOI] [PubMed] [Google Scholar]
- Obleser J, Herrmann B, Henry MJ. Neural oscillations in speech: don't be enslaved by the envelope. Front Hum Neurosci. 2012;6:250. doi: 10.3389/fnhum.2012.00250. [DOI] [PMC free article] [PubMed] [Google Scholar]
- Oldfield RC. The assessment and analysis of handedness: the Edinburgh Inventory. Neuropsychologia. 1971;9:97–113. doi: 10.1016/0028-3932(71)90067-4. [DOI] [PubMed] [Google Scholar]
- Oostenveld R, Fries P, Maris E, Schoffelen JM. FieldTrip: Open source software for advanced analysis of MEG, EEG, and invasive electrophysiological data. Comput Intell Neurosci. 2011;2011:156869. doi: 10.1155/2011/156869. [DOI] [PMC free article] [PubMed] [Google Scholar]
- Panzeri S, Brunel N, Logothetis NK, Kayser C. Sensory neural codes using multiplexed temporal scales. Trends Neurosci. 2010;115:1885–1895. doi: 10.1016/j.tins.2009.12.001. [DOI] [PubMed] [Google Scholar]
- Peelle JE, Davis MH. Neural oscillations carry speech rhythm through to comprehension. Front Psychol. 2012;3:320. doi: 10.3389/fpsyg.2012.00320. [DOI] [PMC free article] [PubMed] [Google Scholar]
- Peretz I, Zatorre RJ. Brain organization for musical processing. Annu Rev Psychol. 2005;56:89–114. doi: 10.1146/annurev.psych.56.091103.070225. [DOI] [PubMed] [Google Scholar]
- Picton TW, John MS, Dimitrijevic A, Purcell D. Human auditory steady-state responses. Int J Audiol. 2003;42:177–219. doi: 10.3109/14992020309101316. [DOI] [PubMed] [Google Scholar]
- Schönwiesner M, Zatorre RJ. Depth electrode recordings show double dissociation between pitch processing lateral Heschl's gyrus and sound onset processing in medial Heschl's gyrus. Exp Brain Res. 2008;187:97–105. doi: 10.1007/s00221-008-1286-z. [DOI] [PubMed] [Google Scholar]
- Schroeder CE, Lakatos P. Low-frequency neuronal oscillations as instruments of sensory selection. Trends Neurosci. 2009;32:9–18. doi: 10.1016/j.tins.2008.09.012. [DOI] [PMC free article] [PubMed] [Google Scholar]
- Shigeno S. The auditory tau and kappa effects for speech and nonspeech stimuli. Percept Psychoph. 1986;4:9–19. doi: 10.3758/bf03207588. [DOI] [PubMed] [Google Scholar]
- Smulders FT. Simplifying jackknifing of ERPs and getting more out of it: retrieving estimates of participants' latencies. Psychophysiology. 2010;47:387–392. doi: 10.1111/j.1469-8986.2009.00934.x. [DOI] [PubMed] [Google Scholar]
- Stefanics G, Hangya B, Hernádi I, Winkler I, Lakatos P, Ulbert I. Phase entrainment of human delta oscillations can mediate the effects of expectation on reaction speed. J Neurosci. 2010;30:13578–13585. doi: 10.1523/JNEUROSCI.0703-10.2010. [DOI] [PMC free article] [PubMed] [Google Scholar]
- Tallon-Baudry C, Bertrand O. Oscillatory gamma activity in humans and its role in object representation. Trends Cogn Sci. 1999;3:151–162. doi: 10.1016/S1364-6613(99)01299-1. [DOI] [PubMed] [Google Scholar]
- Taulu S, Kajola M, Simola J. Suppression of interference and artifacts by the signal space separation method. Brain Topogr. 2004;16:269–275. doi: 10.1023/b:brat.0000032864.93890.f9. [DOI] [PubMed] [Google Scholar]
- Teki S, Grube M, Kumar S, Griffiths TD. Distinct neural substrates of duration-based and beat-based auditory timing. J Neurosci. 2011;31:3805–3812. doi: 10.1523/JNEUROSCI.5561-10.2011. [DOI] [PMC free article] [PubMed] [Google Scholar]
- Van Veen B, van Drongelen W, Yuchtman M, Suzuki A. Localization of brain electrical activity via linearly constrained minimum variance spatial filtering. IEEE T Bio-Med Eng. 1997;44:867–880. doi: 10.1109/10.623056. [DOI] [PubMed] [Google Scholar]
- Zanto TP, Snyder JS, Large EW. Neural correlates of rhythmic expectancy. Adv Cogn Psychol. 2006;2:221–231. doi: 10.2478/v10053-008-0057-5. [DOI] [Google Scholar]